U.S. index futures open July 5 mixed, with ES, YM, RTY and FDAX holding bullish weekly setups while NQ stays more corrective ahead of Fed minutes.
Fundamentals: U.S. index ETFs, oil supply changes, and the June Fed minutes set the tone for weekend market commentary. S&P 500 and tech-focused ETFs remain in focus as traders weigh valuation near highs, while lower crude prices reflect rising OPEC+ output and improved Strait of Hormuz traffic. Treasury bill issuance is also drawing attention for its liquidity impact.
Technicals: U.S. equity futures and major ETFs ended the prior session with a mixed tone, as AAPL, IBIT and GLD advanced while QQQ, META and TSLA weakened. Weekly structure remains constructive in ES, YM, RTY and FDAX, but NQ is showing a more corrective short-term setup. The radar highlights index trends, benchmark alignment and key pivot levels across multiple timeframes.
Market Week Ahead – Trading 360° view Market Radar for: holidays, earnings, eco-news, market-news summary, news sentiment, and major ETFs, MAG7, Higher Time Frame Analysis Indices Futures Summary, and ETF SPY S&P500, QQQ Tech, USO Oil, GLD Gold Weekly Chart analysis
As of: July 5, 2026 06:15 CT
EcoNews Radar U.S. Events
| Day | Time | Impact | Event |
|---|---|---|---|
| Mon | 10:00 | High | ISM Services PMI |
| Wed | 10:30 | Low | Crude Oil Inventories |
| Wed | 14:00 | High | FOMC Meeting Minutes |
| Thu | 08:30 | Medium | Unemployment Claims |
EcoNews Summary
Key U.S. releases center on a high-impact services reading on Monday, crude oil inventories at midweek, and FOMC Meeting Minutes on Wednesday afternoon. The 10:00 to 10:30 release window also matters for intraday reversal or continuation setups, especially when market participation is concentrated around data hits.
Event Notes:
- Monday 10:00 – High USD ISM Services PMI: Measures activity in the U.S. services sector, including new orders, business activity, employment, and prices. Traders monitor it for signals on economic momentum, inflation pressure, and the policy outlook.
- Wednesday 10:30 – Low USD Crude Oil Inventories: Measures the weekly change in U.S. crude stockpiles. Traders monitor it for information on supply balance, refinery demand, and energy-price direction, with spillover effects into inflation-sensitive indices.
- Wednesday 14:00 – High USD FOMC Meeting Minutes: A detailed record of the latest Federal Reserve policy meeting. Traders monitor it for clues on rate-bias language, inflation concerns, and internal policy debate that affect yields, dollar direction, and index volatility.
- Thursday 08:30 – Medium USD Unemployment Claims: Measures new filings for U.S. jobless benefits. Traders monitor it as a timely labor-market indicator, though it carries less direct market impact than the high-impact releases listed here.
Conclusion:
Wednesday is the most important day, led by the 14:00 FOMC Meeting Minutes. Market momentum and volume often slow ahead of major events such as FOMC, with increased volatility at release time. The Wednesday 10:30 crude oil inventories report adds an energy-specific input, and news around the 10 AM time cycle acts as a catalyst for reversals or continuations. High oil prices directly affect markets through inflation and geopolitical concerns.
For full details visit: Forex Factory EcoNews
Market News Summary:
Index ETF comparisons, oil supply increases, and upcoming Fed minutes shaped the weekend’s market backdrop for futures traders.
Primary Drivers & Risks:
- Primary Driver: OPEC+ supply increases
- Primary Risk: Treasury bill liquidity drain
Tone:
Mixed, with energy pressure and liquidity concerns offset by firm equity market positioning.
Stock Market / ETFs / Indices:
Large-cap index ETFs remain the core focus, with VTI and VOO described as broad-market holdings while QQQ faces valuation scrutiny near highs. S&P 500 technical commentary points to a bullish pattern but also consolidation and reversal risk, and stock futures opened a week featuring Fed minutes.
Oil / Energy:
OPEC+ approved another output increase for August, adding supply as Strait of Hormuz traffic recovered and crude prices stayed near pre-conflict levels. Multiple headlines pointed to softer oil conditions and rising global supply.
Gold / Metals:
Gold price attention centered on Fed minutes and a test of the 52-week moving average, with the move framed as a possible confirmation point for the recent XAU/USD rally.
Fed / Financials:
The week’s key central bank event is the June Fed minutes, while a separate report highlighted a large Treasury bill issuance wave that removes liquidity and tightens financial conditions through bank reserve drains.
Macro / Other:
REIT coverage was constructive, citing stronger earnings growth, demand in healthcare, data centers, and improved leasing trends in parts of office real estate. Housing costs also came into view through a Fed paper linking unauthorized immigration to higher home prices and rents.
Conclusion:
Primary attention stays on the balance between equity market resilience and macro pressure from oil supply changes and liquidity withdrawal. Futures traders also face event risk from Fed minutes, with gold, rate sensitivity, and broad index momentum tied to that release.
Secondary cross-currents include valuation concerns in tech-heavy ETFs, constructive REIT fundamentals, and lower oil prices from recovering supply. The overall setup features competing forces rather than a single dominant catalyst across indices.
Market News Sentiment
Market News Articles: 11
- Neutral: 45.45%
- Positive: 36.36%
- Negative: 18.18%
Sentiment Summary: Market news is mostly neutral with 45% neutral coverage, 36% positive coverage, and 18% negative coverage across 11 articles.
Conclusion: The news flow shows a mixed but slightly neutral-to-positive tone, with neutral articles the largest share.
GLD,Gold Articles: 1
- Neutral: 100.00%
Sentiment Summary: GLD/Gold news sentiment is neutral, with 100% of articles classified as Neutral.
Conclusion: The gold-related news flow shows no directional sentiment bias in this snapshot.
USO,Oil Articles: 6
- Negative: 66.67%
- Neutral: 16.67%
- Positive: 16.67%
Sentiment Summary: USO oil-related articles were mostly negative, with 67% negative, 17% neutral, and 17% positive coverage across 6 articles.
Conclusion: The news flow on USO and oil was dominated by negative tone, with limited neutral and positive coverage.
SPY Weekly View
Overall Rating
- Short-Term: Neutral
- Intermediate-Term: Bullish
- Long-Term: Bullish.
Key Insights Summary
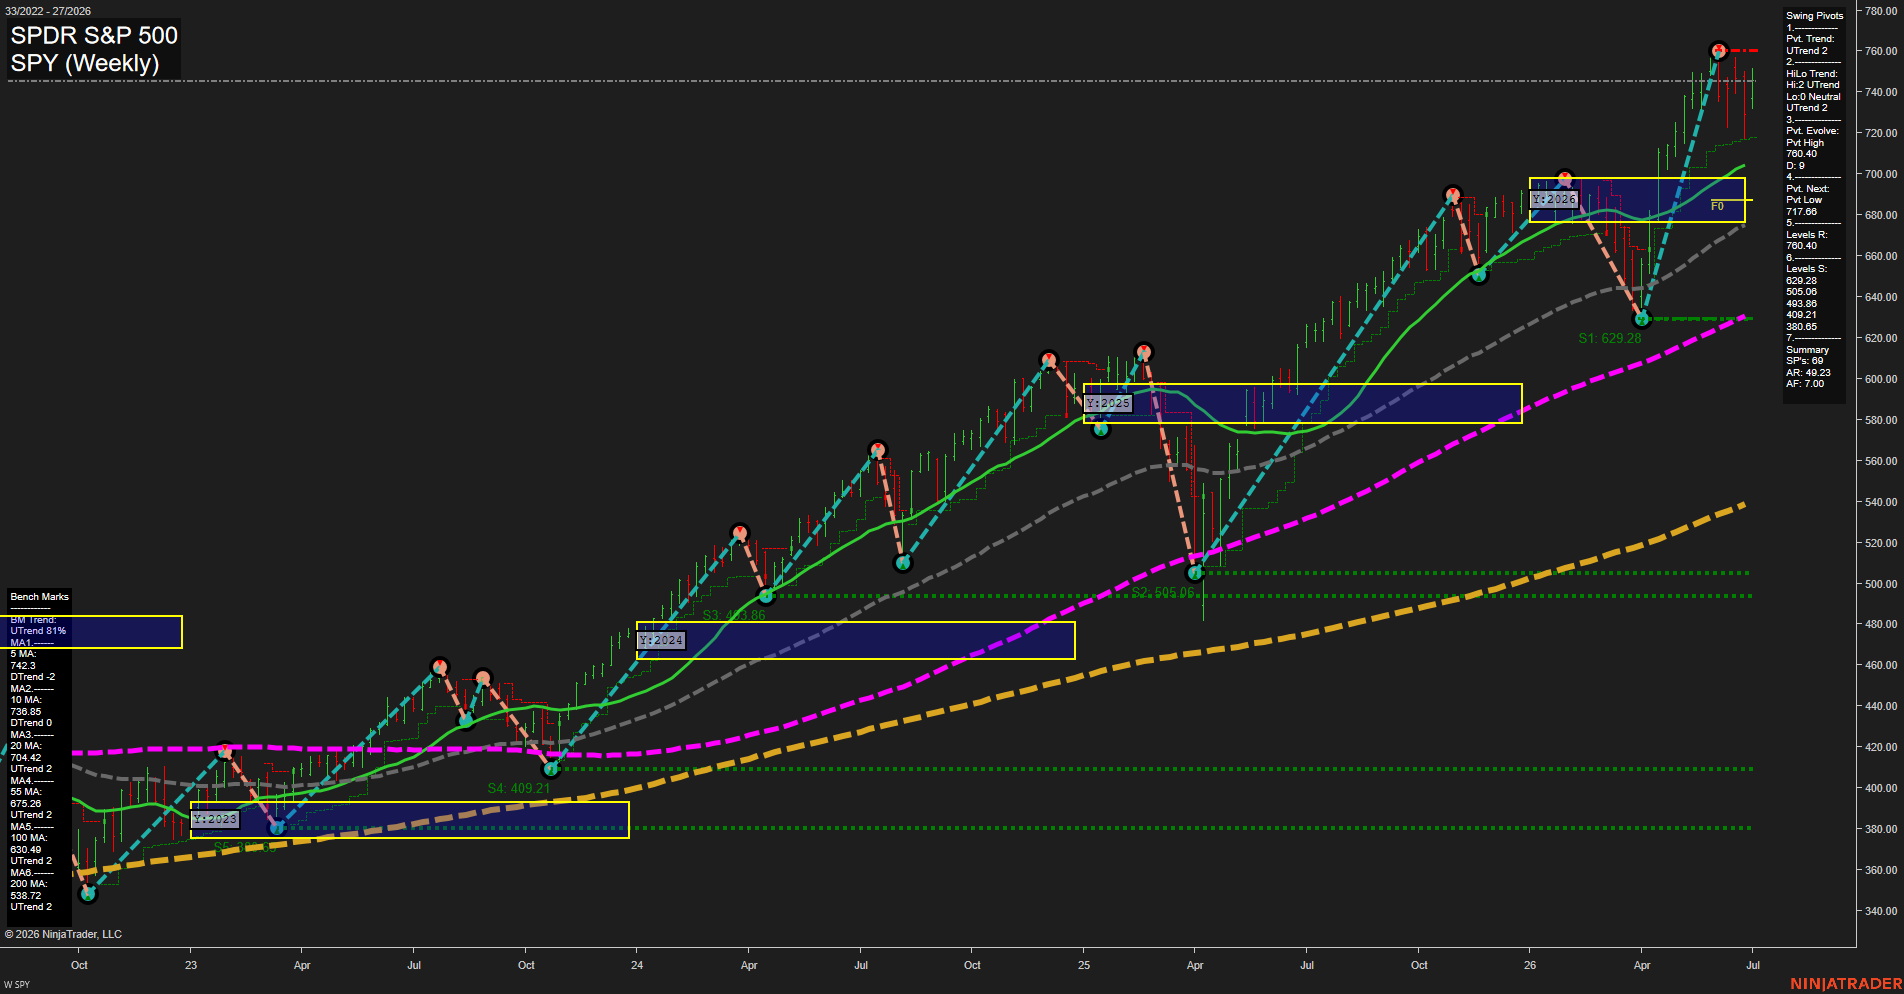
SPY remains in a dominant higher-timeframe uptrend with price holding well above the rising 20, 55, 100, and 200 week benchmarks, confirming a strong long-cycle bull structure. The current weekly price action shows a powerful expansion leg into new highs near the 760 area, followed by a sharp pullback from the extreme, which keeps the short-term tone more mixed than the broader trend. The swing pivot structure is still positive with both pivot trend and hi/lo trend pointed higher, while the next pivot reference sits below the recent high, reflecting a cooling phase after a vertical advance. The yearly 2026 session is trading in its upper NTZ zone after a strong rally from the mid-year breakout area, suggesting the market has shifted from base-building into price discovery and then a fast retracement within an otherwise constructive trend.
View charts on: AlphaWebTrader HTF Charts
QQQ Weekly View
Overall Rating
- Short-Term: Neutral
- Intermediate-Term: Bullish
- Long-Term: Bullish.
Key Insights Summary
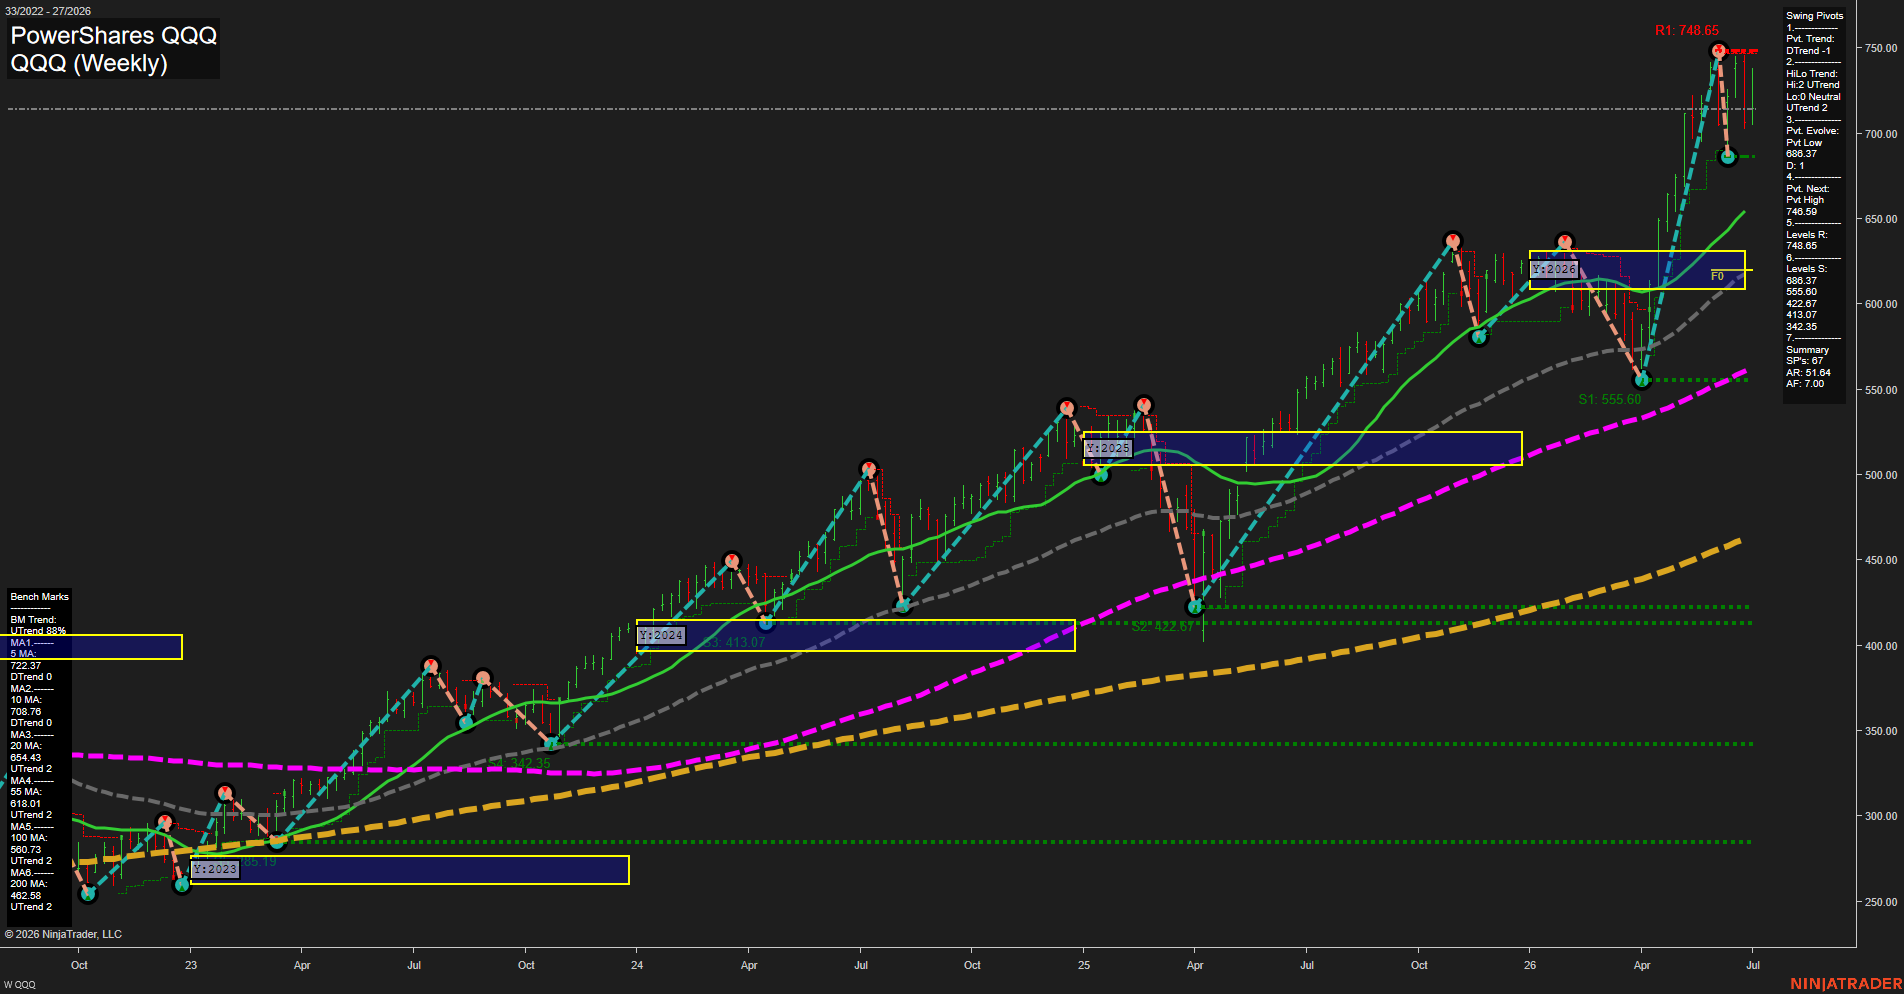
QQQ remains in a dominant multi-year bullish structure, with price holding well above all benchmark moving averages and the longer-term averages still sloping higher. The weekly chart shows a strong advance into the 700s after a sharp retracement from the 748.65 pivot high, followed by a rebound from the 688.37 pivot low. That sequence keeps the intermediate and long-term trend intact even though the short-term swing pivot has turned lower. The current action looks like a high-level consolidation after an extended rally, with price working above the 20/55/100/200-week framework and staying near the upper part of the yearly session range. The chart reflects a mature uptrend with periodic countertrend swings, higher structural support, and repeated tests of overhead resistance near the prior highs.
View charts on: AlphaWebTrader HTF Charts
USO Weekly View
Overall Rating
- Short-Term: Bearish
- Intermediate-Term: Bearish
- Long-Term: Bullish.
Key Insights Summary
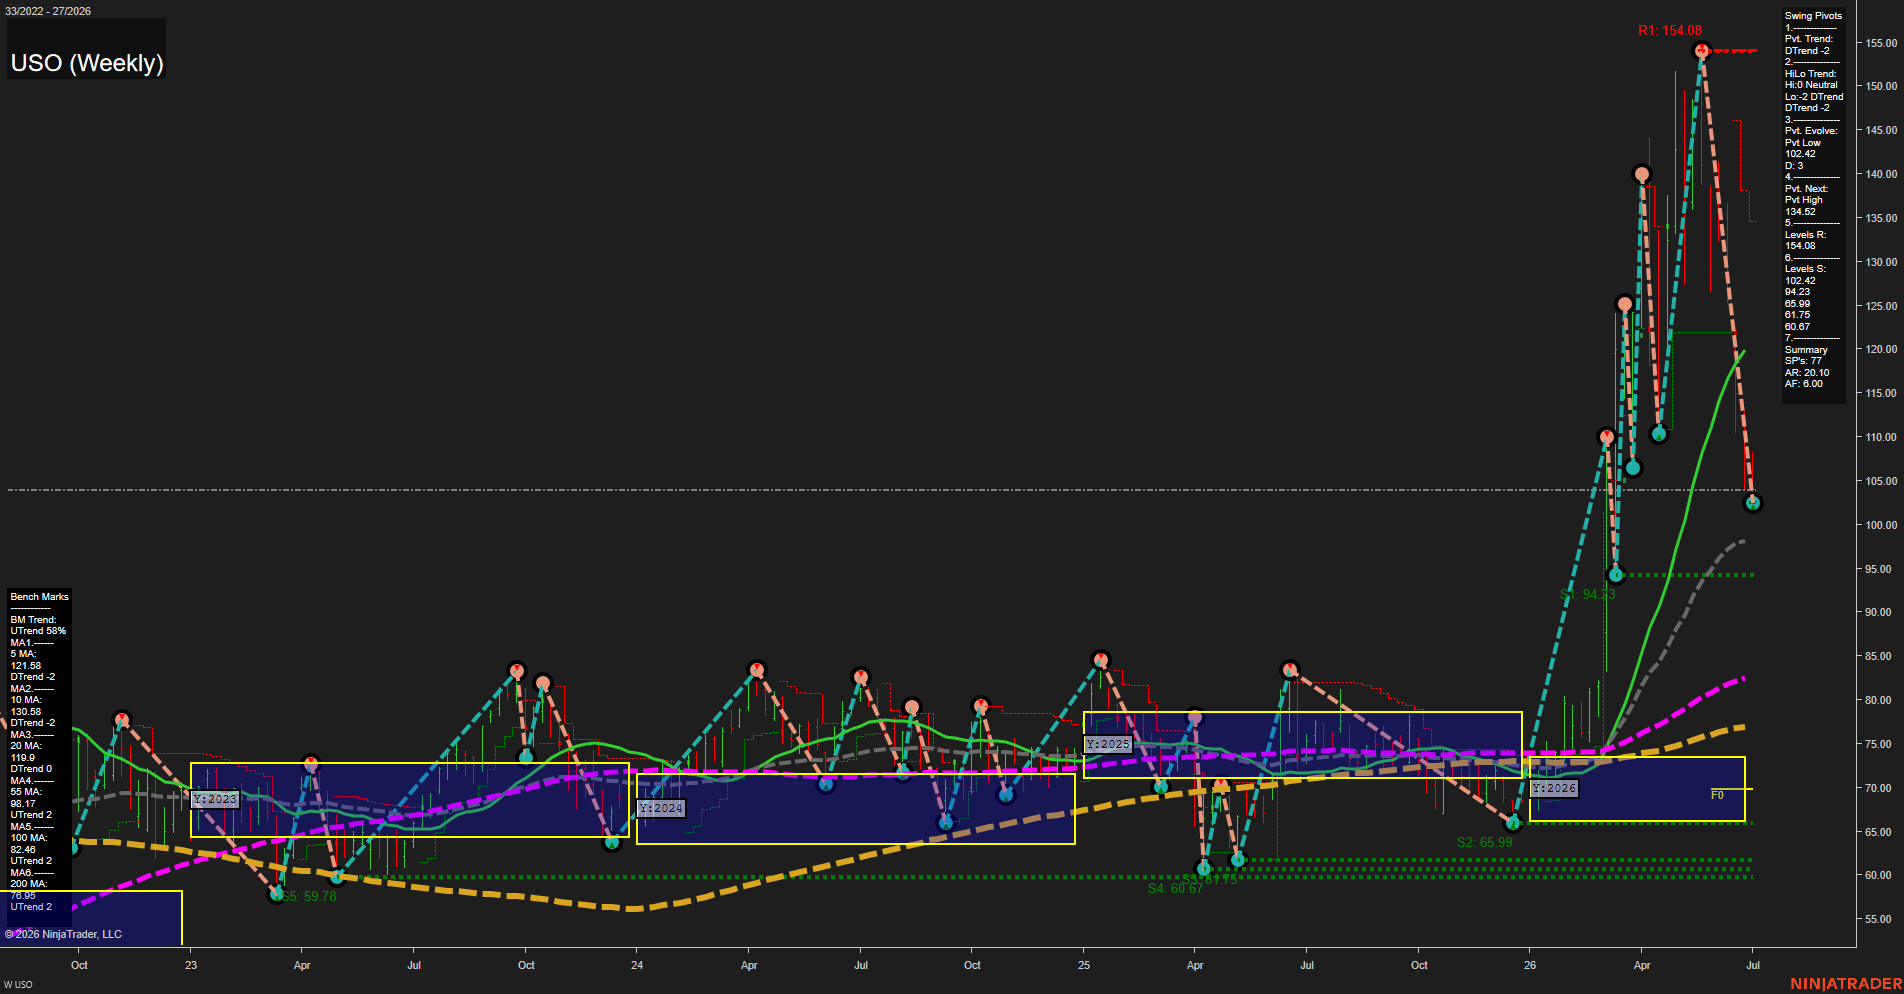
USO is in a sharp weekly pullback after a powerful multi-week surge into the 150s, with the latest bar showing fast downside momentum and a reset back to the 102 area. The short-term pivot structure remains in DTrend, and the current price is aligned with the most recent pivot low, indicating the swing has shifted from breakout expansion into retracement/consolidation behavior. Weekly and monthly session fib grids are still neutral at the current location, reflecting that price has moved out of the extreme upper expansion zone and back toward a more balanced area. Benchmark structure is mixed underneath the decline: price sits below the 5, 10, and 20-week benchmarks, while the 55, 100, and 200-week averages remain in uptrend configuration, preserving the broader long-term constructive backdrop. The chart shows a prior V-shaped rally, a test at the highs near R1 154.08, and a subsequent sharp rejection, leaving the market in a fast mean-reversion phase with a lower-high / lower-low swing character in the near term.
View charts on: AlphaWebTrader HTF Charts
GLD Weekly View
Overall Rating
- Short-Term: Bearish
- Intermediate-Term: Bearish
- Long-Term: Bullish.
Key Insights Summary
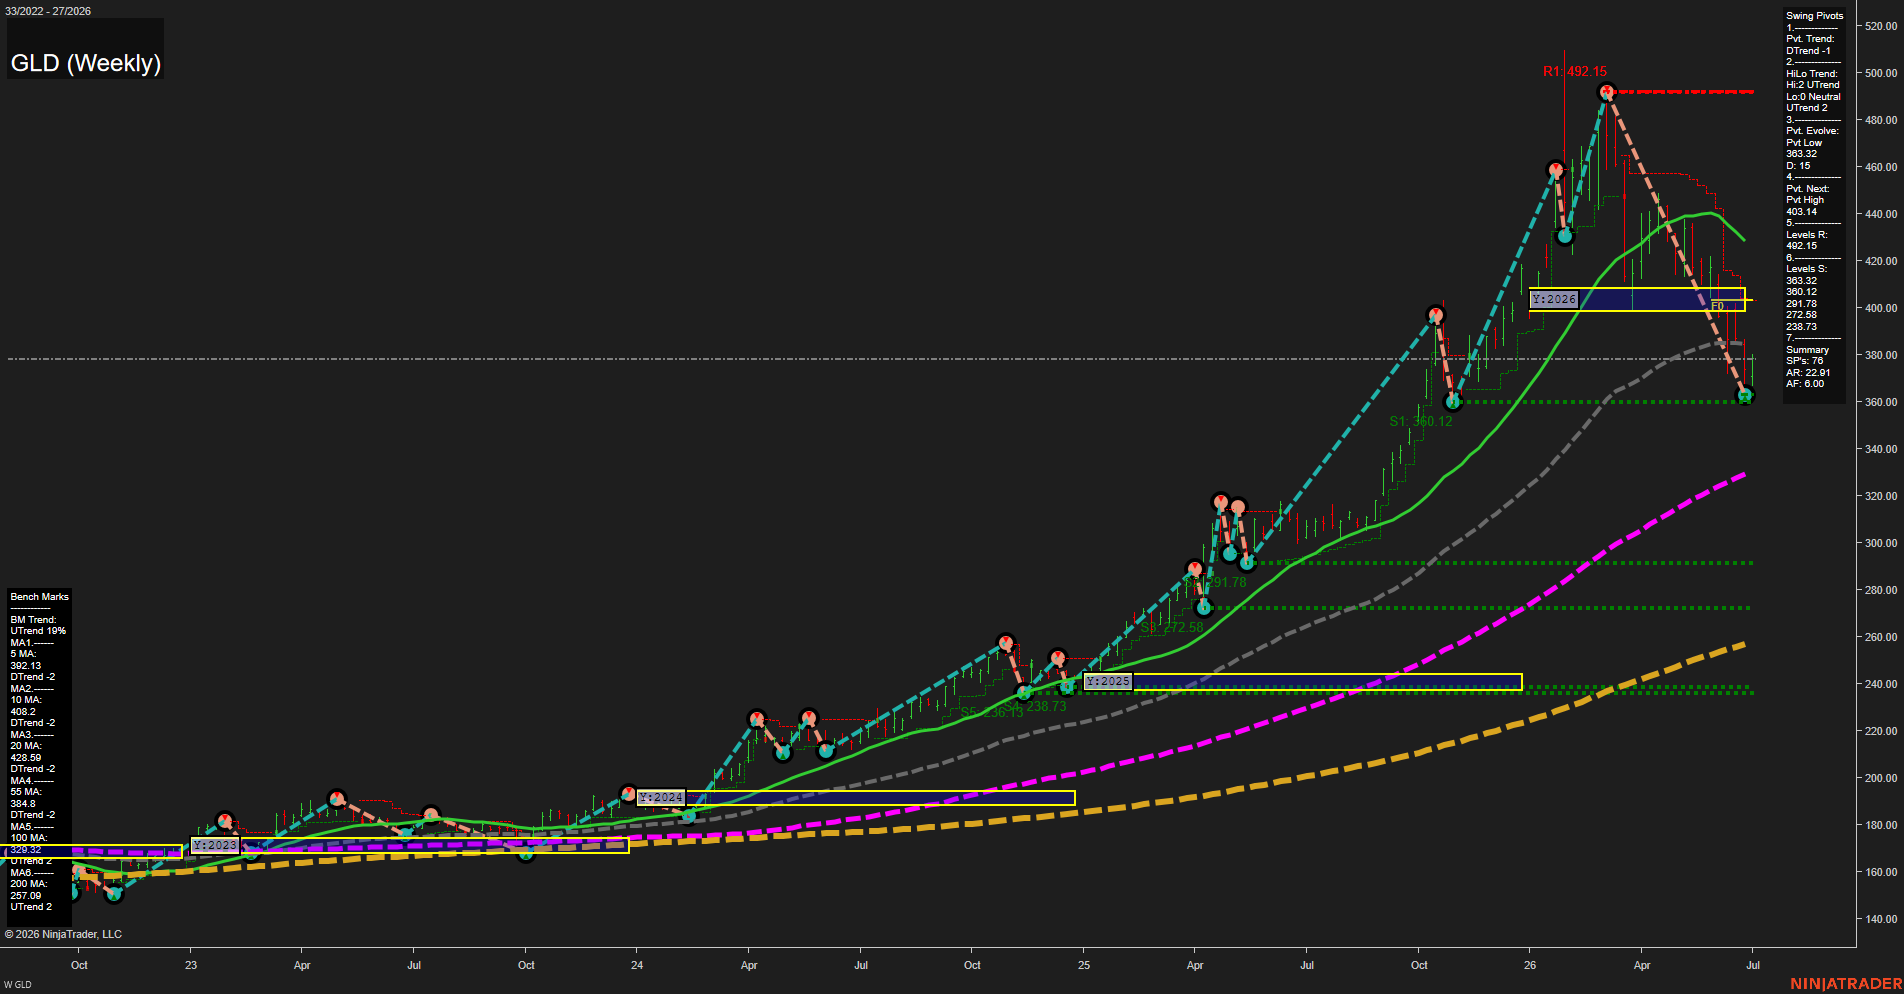
GLD has completed a powerful multi-year advance from the 2023 base through the 2026 peak near 492.15, and the weekly structure now reflects a sharp corrective phase back into the 360 area. The current candle is large with fast downside momentum, and price is below the short- and intermediate-term benchmarks, confirming a bearish swing backdrop. The pivot trend is in DTrend while the HiLo trend remains UTrend, showing a mixed larger structure with the higher-timeframe uptrend still intact despite the recent drawdown. The 100-day and 200-day benchmarks remain rising and well below price, which keeps the long-term trend constructive even as the weekly chart works through a pullback, retracement, and possible consolidation around the 360.12 support zone.
View charts on: AlphaWebTrader HTF Charts