
U.S. stock index futures and major ETFs hold bullish weekly and daily structure as traders watch Iran headlines, Treasury pressure, and key data.
Fundamentals: Equity indices remain firm after eight straight weekly gains for the S&P 500, with dip-buying and broad participation helping keep the market near record highs. Traders are also watching Iran-related headlines, crude oil swings, Treasury market pressure, private credit stress, and a week of inflation, GDP, home sales, and earnings data.
Technicals: Friday's ETF session saw TSLA, AAPL, and IWM close higher while USO, NVDA, and IBIT finished lower. Sunday futures analysis shows bullish weekly and daily structure across ES, NQ, YM, EMD, RTY, and FDAX, with price holding above key moving averages and session fib reference zones.
Market Week Ahead – Trading 360° view Market Radar for: holidays, earnings, eco-news, market-news summary, news sentiment, and major ETFs, MAG7, Higher Time Frame Analysis Indices Futures Summary, and ETF SPY S&P500, QQQ Tech, USO Oil, GLD Gold Weekly Chart analysis
As of: May 24, 2026 06:15 CT
Holiday Radar
- 2026-05-25 Memorial Day
Earnings Radar
Monitoring for earnings releases by the Magnificent 7, AI-tech-related firms, and major financial institutions.
- SNOW Release: 2026-05-27 T:AMC
- CRM Release: 2026-05-27 T:AMC
Conclusion: SNOW and CRM report on 2026-05-27 after the close, placing two large-cap software names into the same earnings window and adding event risk for broad index sentiment around enterprise tech. Market momentum and volume can slow ahead of major earnings releases, especially major tech names.
For full details visit: Yahoo Earnings Calendar
EcoNews Radar U.S. Events
| Day | Time | Impact | Event |
|---|---|---|---|
| Tue | 10:00 | Medium | CB Consumer Confidence |
| Thu | 08:30 | High | Core PCE Price Index m/m |
| Thu | 08:30 | High | Prelim GDP q/q |
| Thu | 08:30 | Medium | Prelim GDP Price Index q/q |
| Thu | 08:30 | Medium | Unemployment Claims |
| Thu | 10:00 | Medium | New Home Sales |
| Thu | 12:00 | Low | Crude Oil Inventories |
EcoNews Summary
Thursday is the key macro session, led by high-impact U.S. Core PCE Price Index m/m and Prelim GDP q/q at 08:30. These releases measure inflation pressure and overall economic growth, both central inputs for rates, index valuation, and volatility across equity futures. The only oil-linked release listed is Crude Oil Inventories at 12:00, which tracks weekly changes in U.S. crude stockpiles and is watched for energy-supply signals and spillover into inflation sentiment.
Event Notes:
- Tue 10:00 – USD CB Consumer Confidence: surveys household sentiment on current conditions and expectations; traders monitor it for clues on spending strength and broad risk appetite.
- Thu 08:30 – USD Core PCE Price Index m/m: measures consumer inflation excluding food and energy; this is a key Fed inflation gauge and a major driver of rate and index volatility.
- Thu 08:30 – USD Prelim GDP q/q: measures the quarterly pace of economic growth; traders watch it for confirmation of expansion or slowdown and its impact on yields and equities.
- Thu 08:30 – USD Prelim GDP Price Index q/q: measures inflation embedded in GDP; it helps frame the inflation component inside growth data and informs rate expectations.
- Thu 08:30 – USD Unemployment Claims: measures new filings for jobless benefits; traders monitor it as a timely labor-market indicator and a read on economic resilience.
- Thu 10:00 – USD New Home Sales: measures sales of newly built homes; it is watched as a housing-demand indicator and a signal for consumer demand and construction activity.
- Thu 12:00 – USD Crude Oil Inventories: measures weekly changes in U.S. crude stockpiles; traders follow it for supply-demand balance in energy markets and possible inflation spillover.
Conclusion:
Thursday is the most important day of the week, with Core PCE Price Index m/m and Prelim GDP q/q at 08:30 forming the main market-moving pair. These high-impact releases often concentrate volatility at the open of the U.S. session, while the later 10:00 releases can act as additional intraday catalysts. Crude Oil Inventories at 12:00 adds a smaller energy-focused input that matters when oil and inflation sensitivity are in focus. Market momentum and volume often slow ahead of major events such as PCE and GDP, with increased volatility at release time.
For full details visit: Forex Factory EcoNews
Market News Summary:
Equity indices remain strong on persistent dip-buying and record highs, while geopolitical headlines, bond-market pressure, and private credit stress add cross-currents.
Primary Drivers & Risks:
- Primary Driver: Record-high S&P 500 momentum
- Primary Risk: Geopolitical and bond-market stress
Tone:
Risk-on in equities, but with visible caution beneath the surface.
Stock Market / ETFs / Indices:
The S&P 500 has posted eight straight weekly gains, with strong dip-buying, limited pullbacks, and a new record high. Broad participation has expanded into small caps, microcaps, REITs, consumer cyclical names, and value equities, while forward S&P 500 earnings estimates continue to rise.
Geopolitical:
Iran-related headlines remain a major market input, with peace talks and a potential deal shaping risk sentiment. Traders are also reacting to the earlier war-driven repricing and the market response to shifting Middle East developments.
Oil / Energy:
Crude futures remain sensitive to Iran headlines, stalled talks, and shifting demand signals. Both major crude benchmarks are already up about 70% from the start of the year.
Fed / Financials:
The U.S. Treasury selloff is testing tolerance for higher borrowing costs. Rising private credit defaults are adding stress for banks and insurers.
Macro / Other:
Housing affordability is improving in some red-hot markets as inventory conditions shift. This week also brings inflation, GDP, home sales, and several major earnings reports.
Conclusion:
The main market driver is persistent equity strength, supported by record highs and steady rotation into a wider set of stocks. Earnings resilience and continued buying interest remain central to the index backdrop.
Secondary drivers include Iran-related headlines, crude oil volatility, Treasury market pressure, and private credit default concerns. Housing, inflation, GDP, and earnings data add more context for cross-asset sentiment.
Market News Sentiment
Market News Articles: 12
- Positive: 41.67%
- Negative: 33.33%
- Neutral: 25.00%
Sentiment Summary: Market news was mixed across 12 articles, with 42% positive, 33% negative, and 25% neutral coverage.
Conclusion: The news flow showed a mildly positive tilt, but overall sentiment remained balanced and not strongly directional.
No stock-related news items found.
Sentiment Summary: No stock-related news items were found, leaving the news-driven sentiment for indices futures neutral and unconfirmed.
Conclusion: With no relevant stock news in the snapshot, there is no identifiable market tone from this data alone.
USO,Oil Articles: 2
- Positive: 50.00%
- Negative: 50.00%
Sentiment Summary: USO/oil news sentiment is evenly split, with 50% positive and 50% negative across 2 articles.
Conclusion: The current oil sentiment reading is neutral and does not show a clear directional bias.
SPY Weekly View
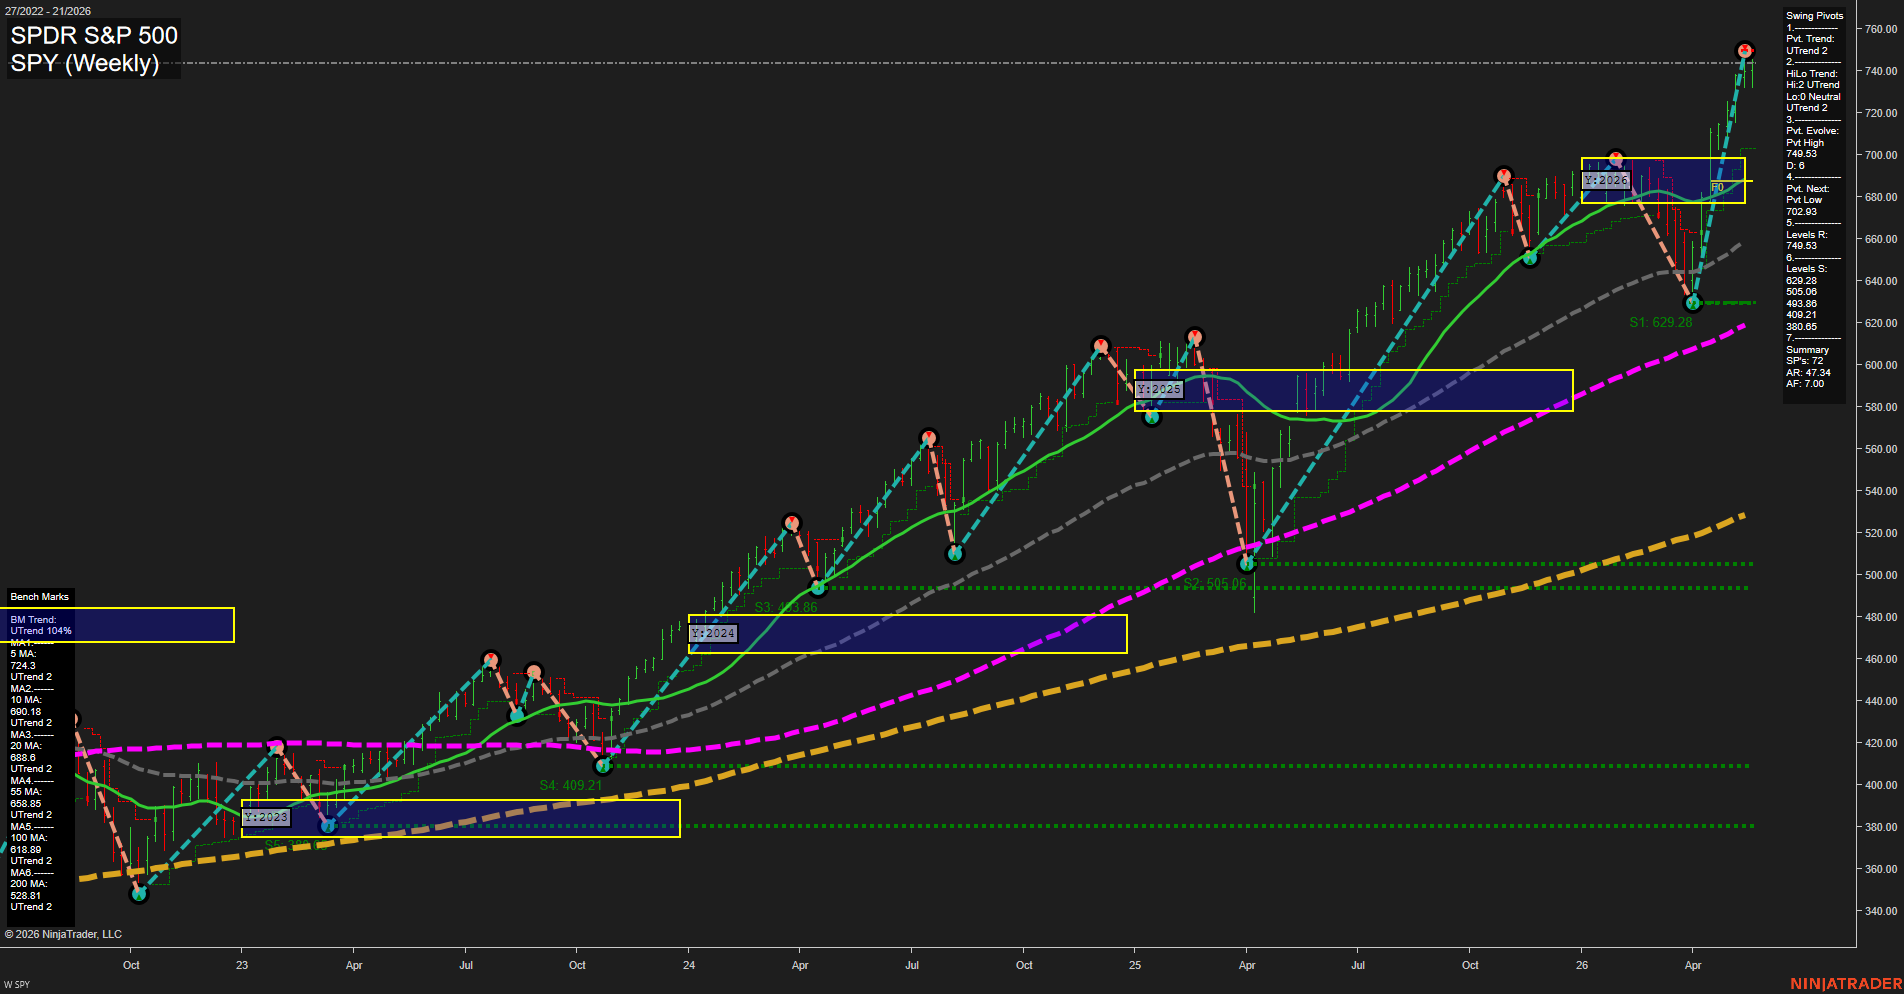
Overall Rating
- Short-Term: Bullish
- Intermediate-Term: Bullish
- Long-Term: Bullish.
Key Insights Summary
SPY remains in a persistent higher-high, higher-low weekly advance with all benchmark moving averages aligned in upward trends and price extended well above the 20/55/100/200-day structure. The swing pivot model shows an active UTrend, with the latest move pushing into a fresh pivot high near 749.53 after a sharp rebound from the 702.93 pivot-low area. The weekly and monthly session fib structure is neutral at the centerline, but the broader tape is still dominated by trend continuation behavior rather than reversal structure. Current action reflects a strong breakout/recovery profile with large weekly bars and fast momentum, while the rising benchmark stack supports a bullish intermediate and long-term regime.
View charts on: AlphaWebTrader HTF Charts
QQQ Weekly View
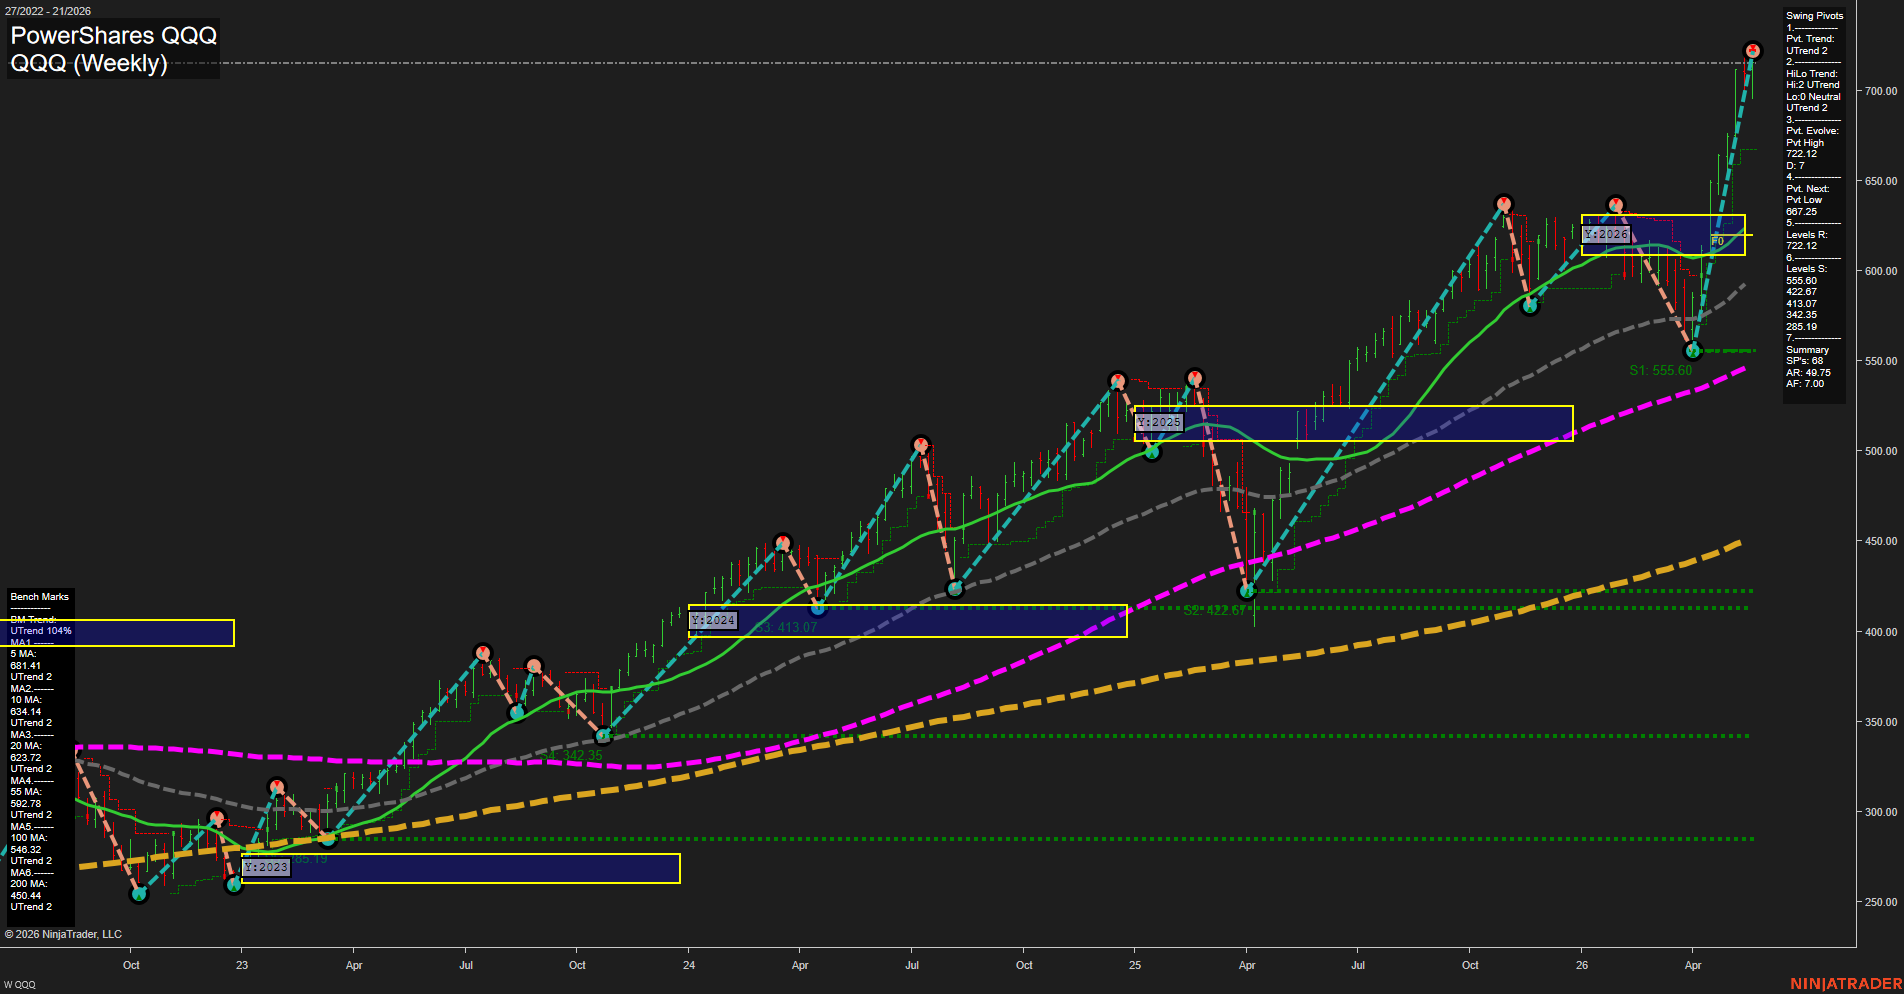
Overall Rating
- Short-Term: Bullish
- Intermediate-Term: Bullish
- Long-Term: Bullish.
Key Insights Summary
QQQ is in a strong weekly uptrend with price pressing to fresh highs near 722.12, showing large weekly range expansion and fast upside momentum. The swing pivot structure remains constructive with both the short-term pivot trend and the higher-level hi/lo trend aligned to the upside, while the next meaningful downside pivot sits lower at 687.25. Price is trading well above every benchmark moving average from the 5-day through the 200-day, confirming broad trend alignment across short, intermediate, and long horizons. The yearly and monthly session fib grids are sitting in a neutral/transition zone on the chart, but the dominant message is trend continuation: higher highs, higher lows, and repeated bullish recovery legs after pullbacks. The broader pattern remains impulsive rather than corrective, with prior consolidation zones now acting as stepped support areas beneath the current advance.
View charts on: AlphaWebTrader HTF Charts
USO Weekly View
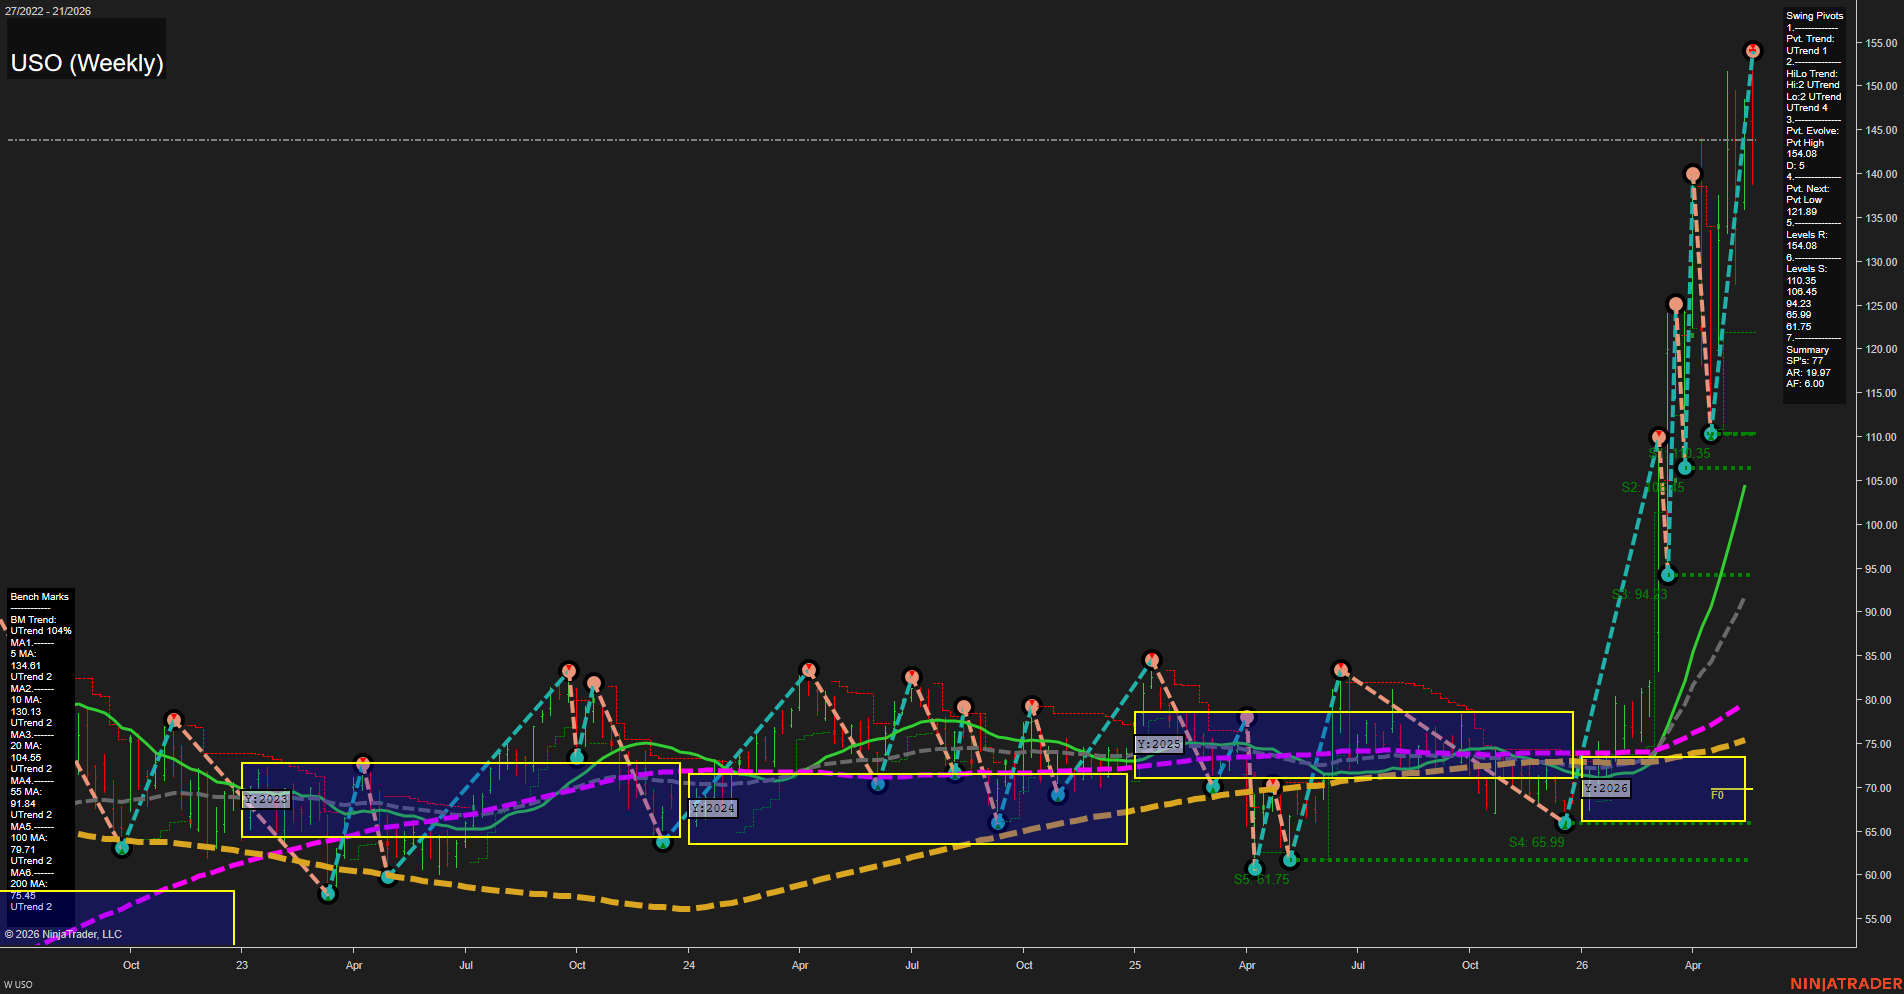
Overall Rating
- Short-Term: Bullish
- Intermediate-Term: Bullish
- Long-Term: Bullish.
Key Insights Summary
USO is in a strong weekly expansion phase with a fast upside momentum impulse pushing price into fresh highs near 154.08. The pivot structure remains in an uptrend across both the short-term and intermediate-term swing readings, while the benchmark stack is fully aligned in rising order, confirming a broad bullish trend profile. The move stands well above the 2026 yearly fib NTZ area and has already cleared prior resistance levels at 110.35, 106.45, and 94.23, showing a clean breakout from a long consolidation and base-building sequence. From a futures swing trader viewpoint, the chart reflects trend continuation behavior rather than mean reversion, with large weekly bars and accelerated momentum defining the current cycle.
View charts on: AlphaWebTrader HTF Charts
GLD Weekly View
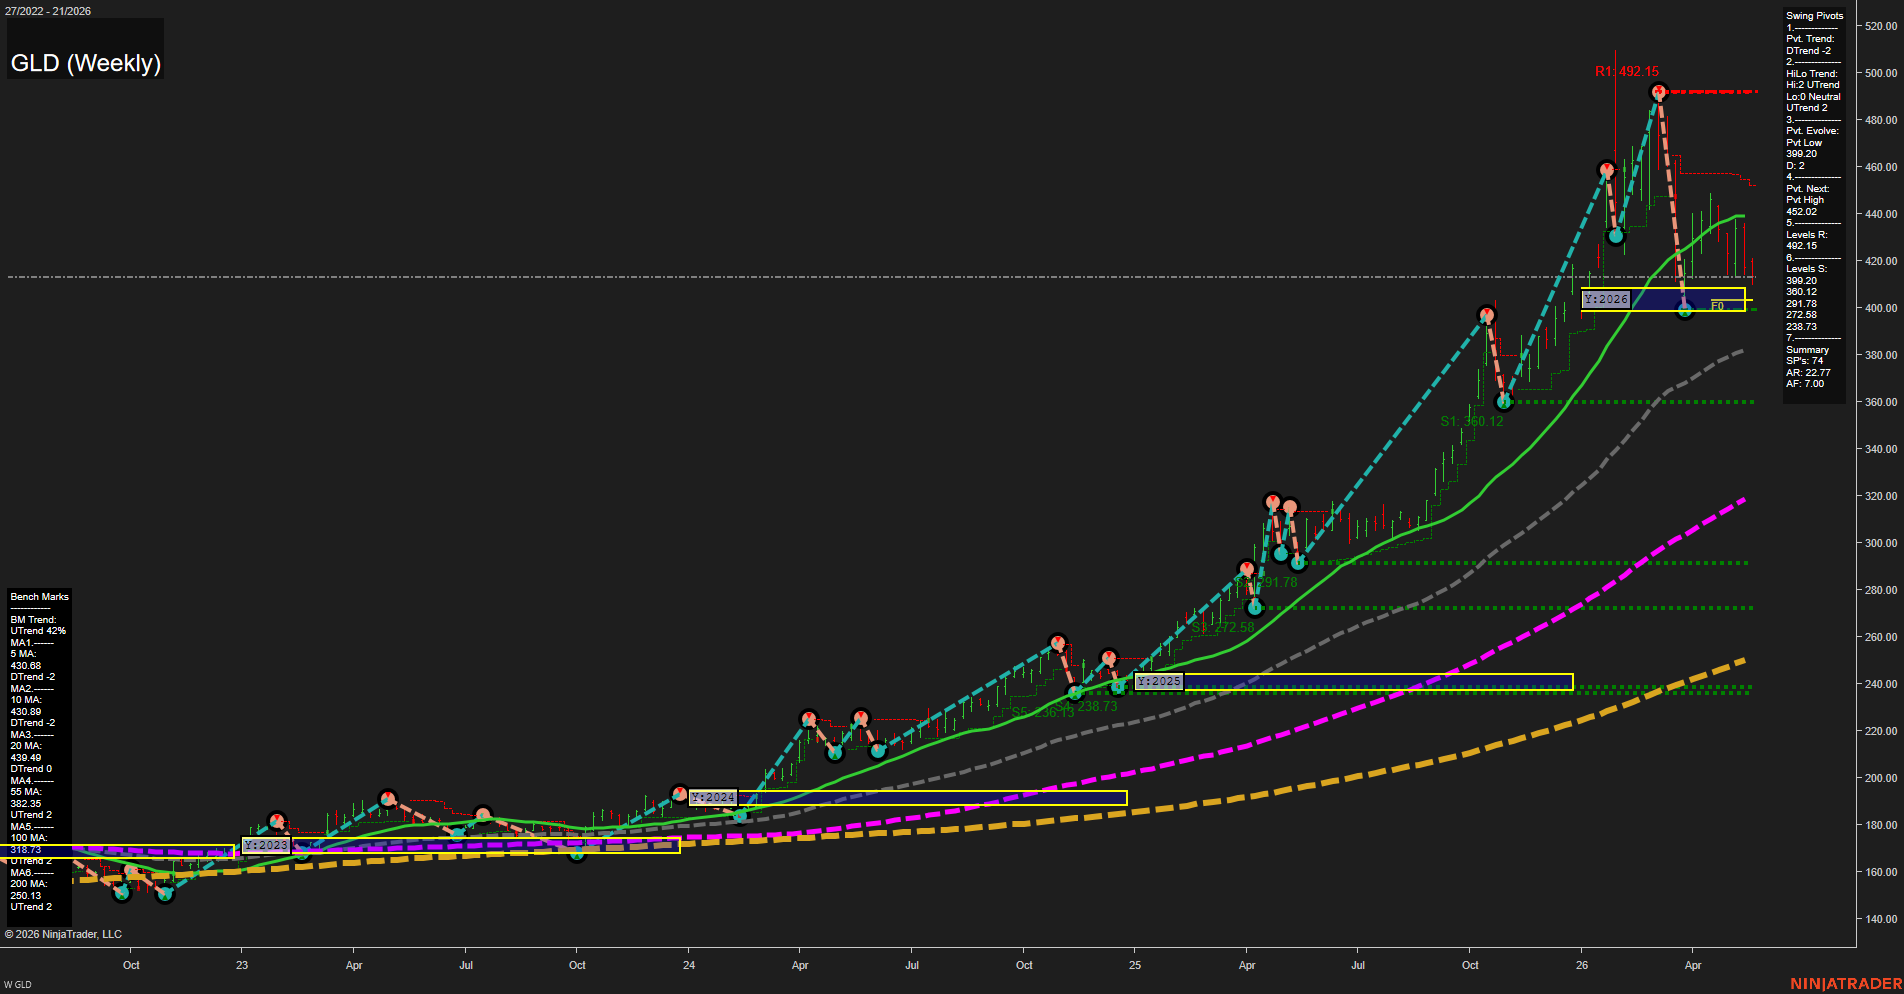
Overall Rating
- Short-Term: Bearish
- Intermediate-Term: Bullish
- Long-Term: Bullish.
Key Insights Summary
GLD remains in a powerful primary uptrend on the weekly timeframe, but the recent swing has shifted into a fast counter-trend pullback from the 492.15 pivot high toward the 399-400 pivot low zone. Short-term structure is weak with price trading below the 5, 10, and 20-day benchmarks and the current pivot trend marked DTrend, while the intermediate and long-term backdrop stays constructive because price is still well above the 55, 100, and 200-day benchmarks. The 2026 yearly fib NTZ around 399.20 is the key balance area, with overhead supply layered near 430-440 and the prior major resistance at 492.15. The broader pattern still reflects a strong multi-month rally with a sharp corrective phase, leaving the weekly chart in a bullish-long-term but bearish-short-term posture.
View charts on: AlphaWebTrader HTF Charts