
U.S. stocks rose as semiconductor shares rebounded ahead of tech earnings, while Middle East oil risks, tariffs and valuation concerns persisted.
Fundamentals: U.S. equities ended higher as semiconductor shares recovered and investors turned attention to major technology earnings after a three-session decline. Oil prices advanced amid Middle East conflict and threats to Saudi shipping routes, while gold and silver gained on haven demand. Tariff tensions, AI spending concerns, elevated valuations and higher-rate risks remained market cross-currents.
Technicals: USO, Tesla and IBIT led the listed movers higher, while Amazon, Microsoft and Alphabet declined. Futures analysis showed long-term bullish structures across major contracts, but daily conditions were mixed to bearish as ES, NQ, YM, EMD, RTY and FDAX consolidated or pulled back from recent pivot highs.
After Market Close daily snapshot: market news summary and sentiment, major ETFs, Magnificent 7 analysis, Indices Futures Higher Time Frame Analysis, and E-mini S&P500, Nasdaq 100, NYMEX Crude, Gold Futures Daily Chart analysis.
As of: July 21, 2026 05:00 CT
Market News Summary:
U.S. equities closed higher as semiconductor shares rebounded ahead of major technology earnings, while Middle East conflict and oil-supply risks remained active cross-currents.
Primary Drivers & Risks:
- Primary Driver: Chip rebound ahead of tech earnings
- Primary Risk: Middle East oil supply disruption
Tone:
Constructive equity tone with elevated geopolitical and valuation concerns.
Stock Market / ETFs / Indices:
U.S. stocks rose broadly, ending a three-session decline as chipmakers recovered and investors focused on Big Tech earnings. The Dow gained 384.46 points, or 0.74%, to 52,223.72. Software shares and loans showed signs of stabilization, while Chinese AI competition and slower hyperscaler capital-expenditure growth renewed pressure on AI pricing-power narratives.
Geopolitical:
Fresh Middle East attacks and ceasefire hopes continued to shape risk sentiment. Markets showed limited immediate reaction to the conflict, although Houthi threats against Saudi shipping heightened concerns around regional energy flows. A new 50% tariff on select Canadian goods added to U.S.-Canada trade tensions, with reported market reaction described as mild.
Oil / Energy:
Crude prices rose amid the U.S.-Iran conflict and threats to Saudi oil shipments. Asian refiners explored Suez Canal and Africa routes as Houthi naval-blockade threats challenged Red Sea exports. Commentary also described Brent and WTI gains as muted relative to the geopolitical backdrop, while WTI tested key technical resistance after a 13-day advance.
Gold / Metals:
Gold and silver advanced despite higher Treasury yields, a firmer dollar, and rising crude, supported by short covering and renewed haven demand. Gold held gains as ceasefire hopes countered the conflict premium. Commentary cited limited downside risk, central-bank demand, Asian buying, and a technical move above trend resistance; other coverage emphasized higher volatility and drawdown risk in gold-miner ETFs versus physical-gold funds.
Fed / Financials:
Jamie Dimon said he would not buy stocks or long-term Treasurys at current prices, citing underpriced geopolitical and fiscal risks. Gold commentary also referenced investor concern over higher interest rates.
Macro / Other:
AI-driven defense and manufacturing investment remained a thematic focus, including a Navy contract for robotics technology. MSCI shares fell after Q2 revenue and EPS missed expectations, while higher expense projections raised margin concerns despite stronger free-cash-flow guidance.
Conclusion:
Semiconductor strength and positioning ahead of major technology earnings drove the equity rebound. The market looked past near-term conflict headlines during Tuesday’s advance.
Oil shipping threats, Middle East escalation, and tariff tensions remained risk factors. AI spending and competitive pressures, elevated stock and bond valuations, and higher-rate concerns added cross-currents.
Market News Sentiment
Market News Articles: 41
- Neutral: 36.59%
- Negative: 36.59%
- Positive: 26.83%
Sentiment Summary: Market news sentiment is balanced between neutral and negative coverage at 37% each, while positive coverage accounts for 27%.
Conclusion: Indices futures headlines reflect a cautious tone, with neutral and negative articles comprising 73% of the 41 articles reviewed.
GLD,Gold Articles: 14
- Positive: 64.29%
- Negative: 28.57%
- Neutral: 7.14%
Sentiment Summary: GLD/Gold coverage is predominantly positive at 64%, with 29% negative and 7% neutral across 14 articles.
Conclusion: Gold-related sentiment is net positive, indicating a generally supportive news tone relevant to index futures risk sentiment.
USO,Oil Articles: 16
- Neutral: 43.75%
- Negative: 31.25%
- Positive: 25.00%
Sentiment Summary: Oil coverage is mixed to neutral, with 44% neutral, 31% negative, and 25% positive articles across 16 items.
Conclusion: For indices futures day traders, oil-related news tone is primarily neutral, with negative coverage exceeding positive coverage.
Market Data Snapshot
ETF Snapshot of major stock market ETFs, Mag7, and others as of: July 21, 2026 05:00
Top Movers & Losers
- USO 128.85 Bullish 2.66% ▲
- TSLA 378.93 Bullish 2.53% ▲
- IBIT 37.67 Bullish 2.11% ▲
- AMZN 247.55 Bearish -0.98% ▼
- MSFT 397.75 Bearish -1.13% ▼
- GOOG 346.19 Bearish -1.47% ▼
Major Index ETFs: SPY, QQQ, DIA, IWM, IJH
- QQQ 708.97 Bullish 1.85% ▲
- IWM 296.54 Bullish 1.45% ▲
- IJH 75.72 Bullish 1.05% ▲
- SPY 748.28 Bullish 0.83% ▲
- DIA 521.51 Bullish 0.69% ▲
Index ETFs were Bullish across the group. QQQ led with a +1.85% gain, followed by IWM at +1.45% and IJH at +1.05%. SPY added +0.83%, while DIA was the least positive mover at +0.69%.
Mag 7 Stocks: AAPL, MSFT, GOOG, AMZN, META, NVDA, TSLA
- TSLA 378.93 Bullish 2.53% ▲
- NVDA 207.29 Bullish 1.97% ▲
- AAPL 327.74 Bullish 0.35% ▲
- META 643.81 Bearish -0.32% ▼
- AMZN 247.55 Bearish -0.98% ▼
- MSFT 397.75 Bearish -1.13% ▼
- GOOG 346.19 Bearish -1.47% ▼
Mixed Mag7 context: TSLA is the most bullish mover at +2.53%, followed by NVDA at +1.97%; AAPL is modestly Bullish at +0.35%. GOOG is the most bearish mover at -1.47%, with MSFT at -1.13%, AMZN at -0.98%, and META marginally Bearish at -0.32%.
Cross-Market ETFs: TLT, GLD, USO, IBIT
- USO 128.85 Bullish 2.66% ▲
- IBIT 37.67 Bullish 2.11% ▲
- GLD 374.81 Bullish 1.96% ▲
- TLT 83.66 Bearish -0.27% ▼
Other ETFs were Mixed: USO was the most bullish mover at +2.66%, followed by IBIT at +2.11% and GLD at +1.96%. TLT was the most bearish mover at -0.27%, showing a modest Bearish move.
ETF, Mag7, and Cross-Market ETF Insights
Overall Tone
Mixed conditions: equity index ETFs were Bullish while Mag7 participation was selective, alongside Bullish oil, gold, and bitcoin exposure.
Equity ETFs and Mag7:
Major Index ETFs were broadly Bullish, led by QQQ at +1.85%, followed by IWM at +1.45% and IJH at +1.05%; DIA was the least positive index ETF at +0.69%. Mag7 action was selective: TSLA was the most bullish mover at +2.53%, with NVDA up +1.97%, while GOOG was the most bearish mover at -1.47%. AAPL was modestly Bullish at +0.35%, while META, AMZN, and MSFT were Bearish.
Cross-Market ETFs:
Cross-market ETFs were mostly Bullish, led by USO as the most bullish mover at +2.66%, with IBIT up +2.11% and GLD up +1.96%. TLT was the most bearish mover at -0.27%, a modest Bearish divergence against gains in equities, commodities, gold, and bitcoin exposure.
Futures Indices – Higher Time Frame Analysis
Summary of the current state of US Indices Futures based on higher time-frame (HTF) technical analysis as of: 2026-07-21: 17:00 CT.
US Indices Futures
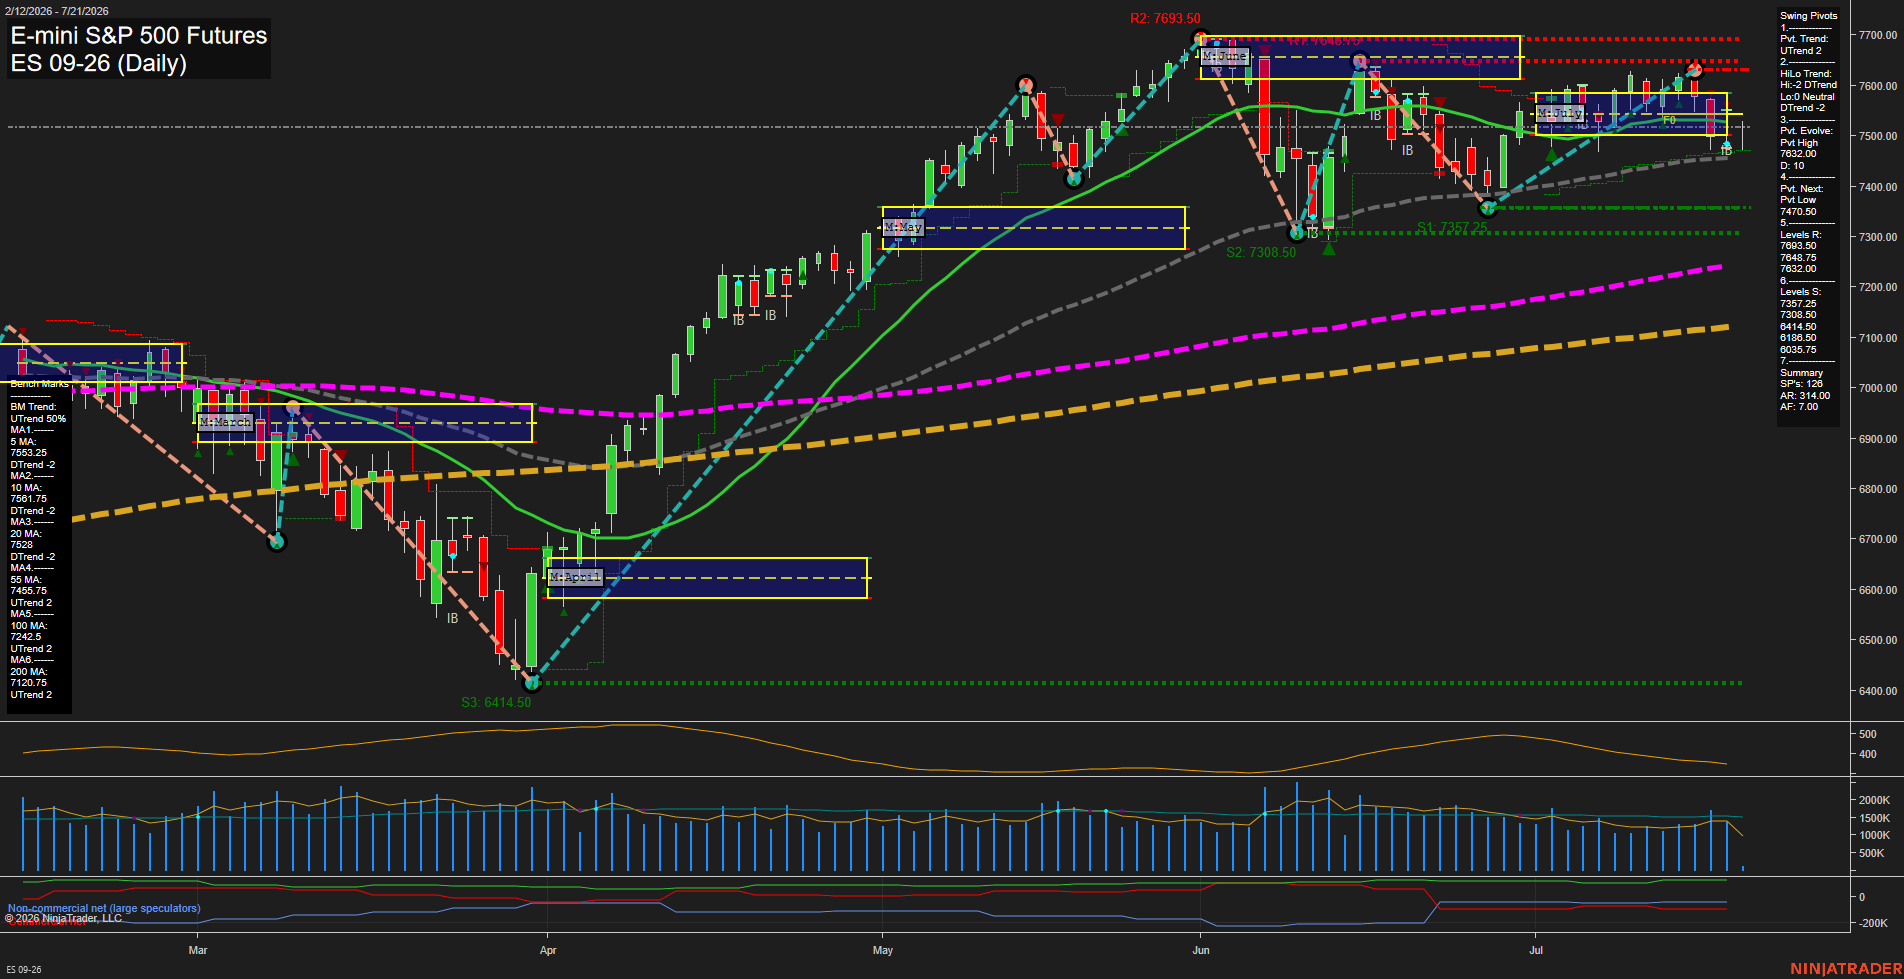
- ES: YSFG/WSFG above F0%, MSFG below; UTrend; above rising long benchmarks; support 7470.50/7292.00, resistance 7632.00-7693.50.
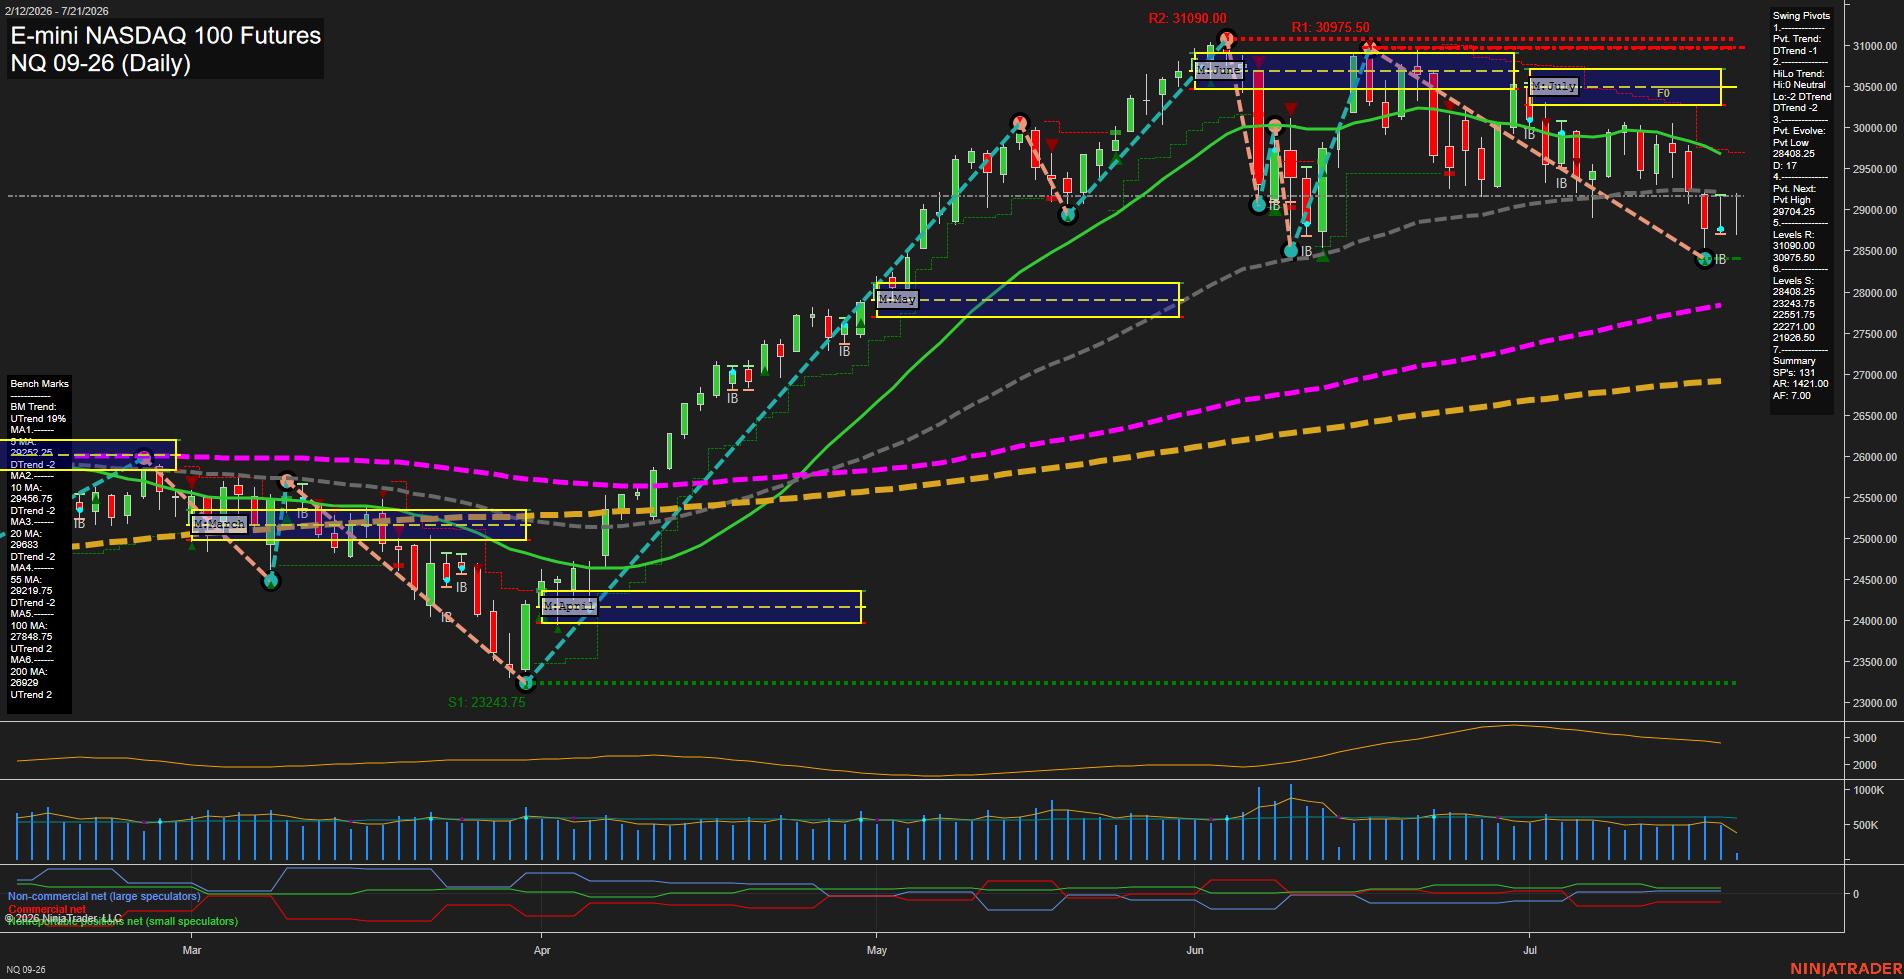
- NQ: YSFG/WSFG above F0%, MSFG below; daily DTrend; above rising long benchmarks; support 28408.25, reversal 29704.25, resistance 31090.00.
- YM: YSFG above F0%, WSFG/MSFG below centers; short-term DTrend; rising long benchmarks; support 51936/51009, resistance 53127/53658.
- EMD: YSFG above F0%, WSFG/MSFG below references; short-term retracement; rising long benchmarks; support 3721.1/3692.9, resistance 3892.4.
- RTY: YSFG/WSFG above F0%, MSFG below; daily DTrend; rising long benchmarks; support 2944.3/2835.6, resistance 3014.4/3068.4.
- FDAX: YSFG near F0%, MSFG below; weekly UTrend, daily DTrend; rising long benchmarks; support 24787/22210, resistance 25481/26064.
Overall State
- Short-Term: Bearish
- Intermediate-Term: Neutral
- Long-Term: Bullish
Conclusion
Daily structures are predominantly in retracement or DTrend conditions, with NQ and FDAX also intermediate bearish. ES, YM, EMD, RTY, and FDAX monthly grids remain below F0%, while yearly grids and rising 100/200-period benchmarks retain long-term bullish alignment. ES and RTY weekly structures remain upward; NQ, YM, and EMD hold above major long-term benchmarks amid pullbacks. Key pivot supports and overhead swing highs define current HTF ranges.
Note: Intra-day counter-trend pullbacks or retracements may occur, HTF is context for informational usage and market structure. Glossary: Session Fib Grids periods of YSFG:’Yearly’, MSFG:’Monthly’, WSFG:’Weekly’
For full details visit: AlphaWebTrader Technicals
ES Daily View
Overall Rating
- Short-Term: Neutral
- Intermediate-Term: Bearish
- Long-Term: Bullish.
Key Insights Summary
Price is consolidating beneath the declining 5-, 10-, and 20-day benchmarks after rejection from the 7632 to 7648.75 pivot-resistance area. The short-term pivot structure remains UTrend, but momentum has slowed and the monthly grid remains below its F0% level, reflecting an intermediate counter-trend pullback within a still-positive long-term structure. The 7470.50 pivot-low reversal level and rising 55-day average near 7455.75 define the nearby support zone, while 7632.00, 7648.75, and 7693.50 remain the overhead swing-resistance sequence. Long-term trend alignment remains constructive above the rising 100- and 200-day averages, while elevated ATR reflects a broad daily trading range and choppy price rotation.
View charts on: AlphaWebTrader HTF Charts
NQ Daily View
Overall Rating
- Short-Term: Bearish
- Intermediate-Term: Bearish
- Long-Term: Bullish.
Key Insights Summary
The daily structure reflects a countertrend decline within a still-positive long-term advance. Price is below the declining 10-, 20-, and 55-day benchmarks and the monthly F0% level, while the short-term pivot trend remains down. The weekly grid remains positive, indicating the decline is occurring above the broader weekly framework, but momentum has slowed and recent bars show a lower-high sequence. The 28408.25 pivot low is the immediate structural support, while 29704.25 is the defined reversal level for a new short-term pivot high. Longer-term trend support remains constructive through the rising 100- and 200-day averages and the positive yearly grid position.
View charts on: AlphaWebTrader HTF Charts
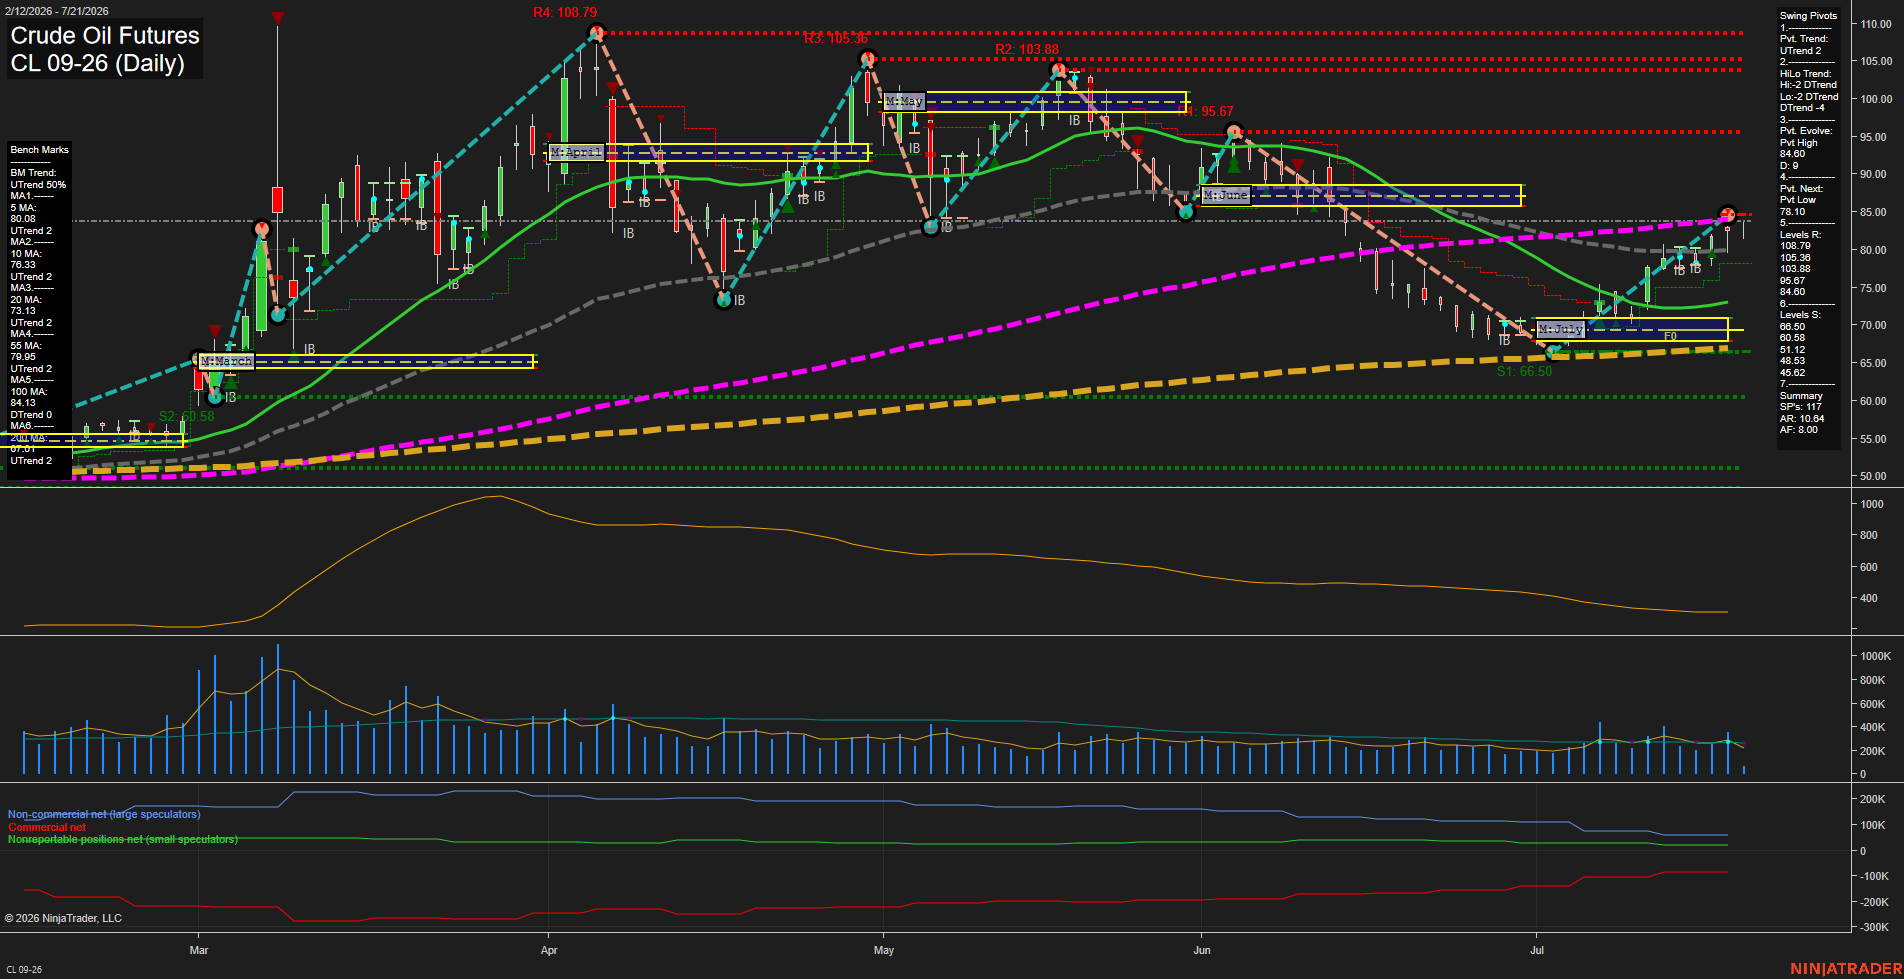
CL Daily View
Overall Rating
- Short-Term: Bullish
- Intermediate-Term: Bullish
- Long-Term: Bullish.
Key Insights Summary
CL has completed a sharp V-style recovery from the early-July low near 66.50 and is holding above the weekly and monthly F0%/NTZ structures. Short-term pivot structure is upward, with price above all short- and intermediate-term benchmarks and reclaiming the declining 100-day average near 84.13. The intermediate HiLo pivot trend remains down, reflecting the broader decline from the April and May highs, but the recovery has established higher lows and shifted momentum higher. The 84.60 pivot-high level has been exceeded, making 95.67 the next major overhead pivot resistance, while 78.10 is the nearby pivot-reversal reference. Volume has remained moderate versus earlier peaks and ATR is declining from spring extremes, indicating a less volatile but still active recovery phase.
View charts on: AlphaWebTrader HTF Charts
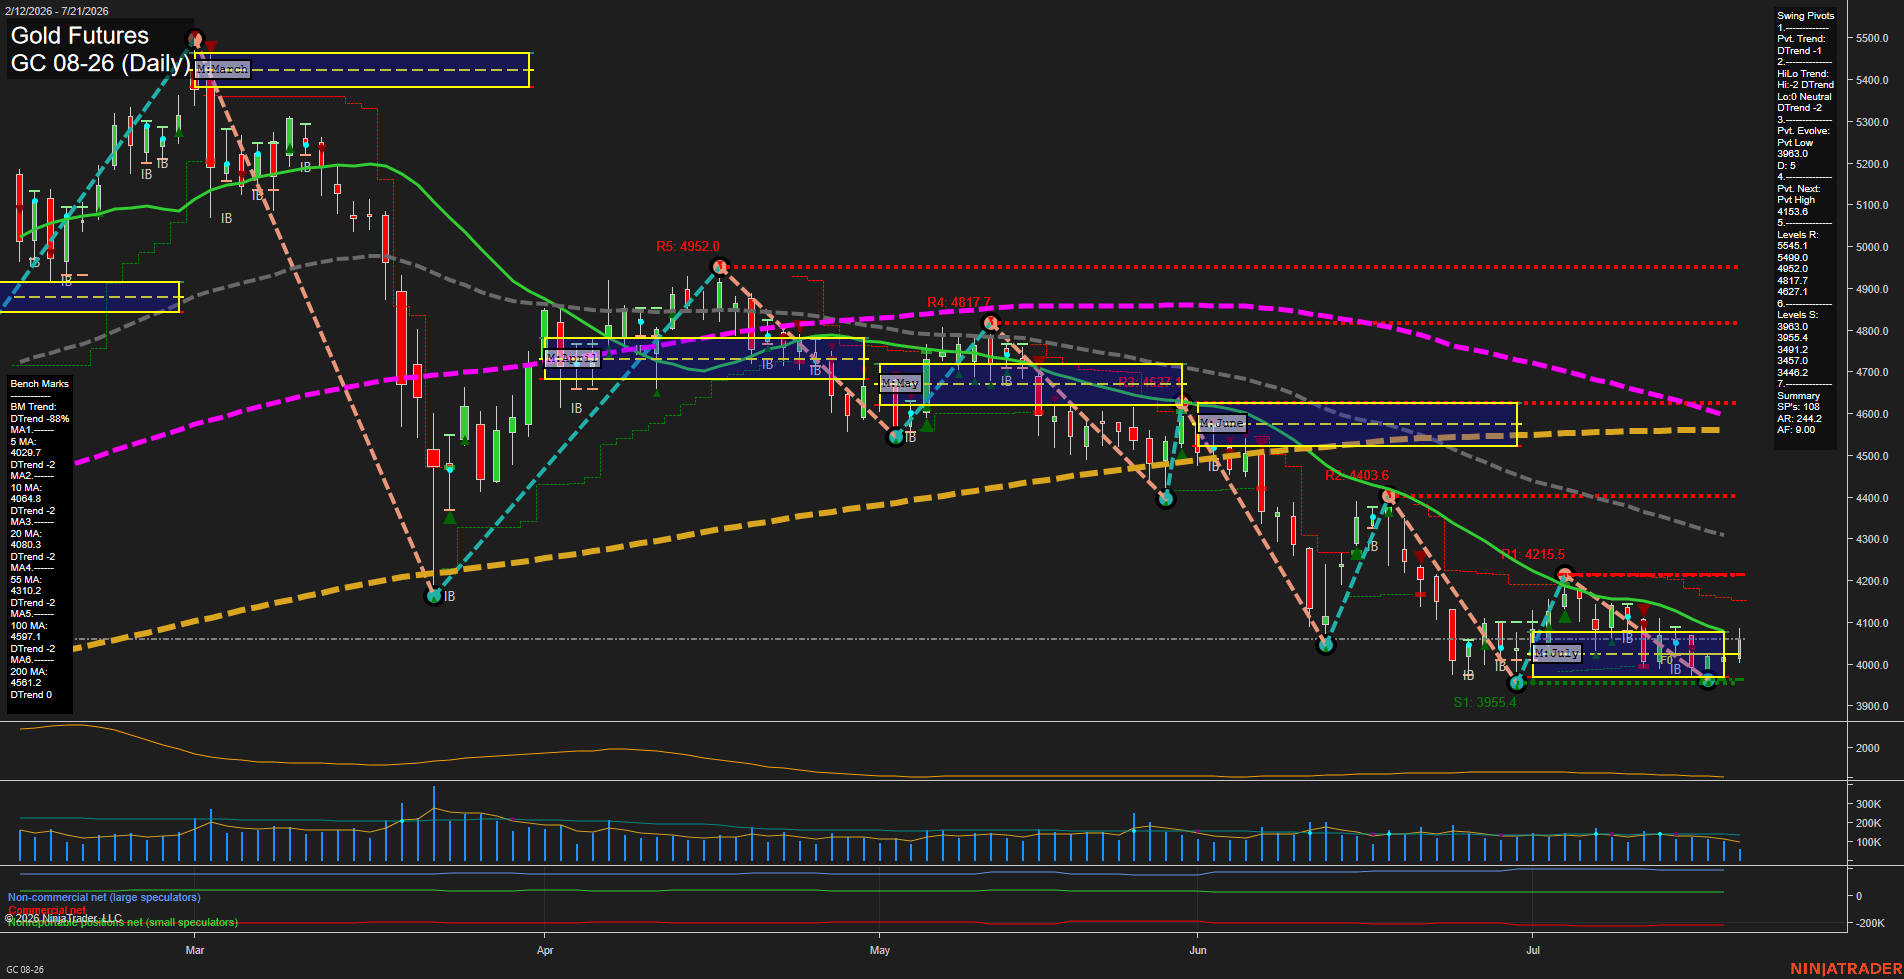
GC Daily View
Overall Rating
- Short-Term: Neutral
- Intermediate-Term: Bearish
- Long-Term: Bearish.
Key Insights Summary
Gold is consolidating in a narrow, low-momentum range just above the clustered 3951.9-3955.4 swing-support area following a broader sequence of lower highs and lower lows. Short-term WSFG structure is constructive, but price remains beneath the declining 10-, 20-, 55-, 100-, and 200-day benchmarks, while both pivot-trend measures remain in DTrend. The 4153.6 pivot-next level and 4215.5 resistance define the near-term upside swing threshold; the July range has so far displayed compression rather than a confirmed trend reversal. Intermediate and long-term structure remains dominated by the decline from the spring highs, despite the current stabilization above support.
View charts on: AlphaWebTrader HTF Charts