U.S. stocks and gold fell as hawkish Fed remarks lifted yields and rate-hike odds, while chips weakened, software held firmer and wheat prices rose.
Fundamentals: Hawkish Federal Reserve messaging lifted bond yields and increased rate-hike expectations, pressuring U.S. equity indices and gold. Semiconductors, including Nvidia and Marvell, declined while software showed relative strength. Gold broke below its 200-day moving average, while wheat and corn prices rose amid supply concerns and Black Sea export disruptions.
Technicals: The session showed mixed market leadership, with Amazon, Microsoft and Apple advancing while Nvidia, GLD and IBIT declined. Futures analysis retained bullish intermediate- and long-term ratings across major equity indexes, although daily charts showed consolidation or corrective pressure in the S&P 500, Nasdaq 100, Russell 2000 and E-mini Dow.
After Market Close daily snapshot: market news summary and sentiment, major ETFs, Magnificent 7 analysis, Indices Futures Higher Time Frame Analysis, and E-mini S&P500, Nasdaq 100, NYMEX Crude, Gold Futures Daily Chart analysis.
As of: August 28, 2026 05:00 CT
Market News Summary:
Hawkish Federal Reserve messaging dominated market reaction, lifting bond yields and pressuring U.S. equity indices and gold.
Primary Drivers & Risks:
- Primary Driver: Hawkish Fed rate-hike repricing
- Primary Risk: Inflation and rising bond yields
Tone:
Cautious and risk-off, with leadership rotation.
Stock Market / ETFs / Indices:
The S&P 500 and Nasdaq edged lower after Chair Kevin Warsh emphasized unfinished inflation work and increased September rate-hike odds. Chips, including Nvidia and Marvell, faced pressure while software retained buyer interest; commentary also cited a shift in market leadership and a bearish September technical setup.
Geopolitical:
Black Sea export disruptions contributed to higher wheat prices, while the breakdown in U.S.-Canada trade talks added urgency to Canadian west-coast pipeline planning.
Oil / Energy:
Persian Gulf oil exports recovered to about two-thirds of pre-war levels, easing supply pressure and keeping crude referenced in the high-$70s to low-$80s range. Canadian pipeline planning gained focus amid trade tensions with the United States.
Gold / Metals:
Gold retreated sharply after the hawkish Fed shift, breaking its 200-day moving average as the dollar and rate-hike expectations rose. Key cited support levels included $4,500 and the 20-day average near $4,410, while longer-term gold commentary remained constructive around debt, liquidity, and central-bank demand themes.
Fed / Financials:
Warsh put inflation and price stability at the center of his Jackson Hole remarks, prompting higher yields and renewed discussion of a near-term rate increase. Commentary described financial conditions as easy, credit spreads as tight, and Fed views as divided; banks Truist and Fifth Third paused sales of Delaware Life products amid reporting-related probes.
Macro / Other:
Inflation remained a central concern, with reporting that 47% experienced real-wage declines. Corn and wheat reached more than three-year highs, tied respectively to tighter U.S. supply expectations and Black Sea export disruptions.
Conclusion:
Fed hawkishness, higher bond yields, and increased rate-hike odds drove the session’s cross-asset response. U.S. equity indices weakened while gold sold off.
Inflation pressures, elevated agricultural prices, and oil-supply normalization added competing macro signals. Sector performance diverged, with software firmer than semiconductors.
Market News Sentiment
Market News Articles: 50
- Neutral: 58.00%
- Negative: 28.00%
- Positive: 14.00%
Sentiment Summary: Of 50 market news articles, 58% were neutral, 28% negative, and 14% positive, indicating predominantly neutral coverage with a negative tilt.
Conclusion: Indices futures day traders are facing a news backdrop where negative articles outnumber positive articles.
GLD,Gold Articles: 14
- Negative: 42.86%
- Neutral: 35.71%
- Positive: 21.43%
Sentiment Summary: GLD/Gold coverage is predominantly negative at 43%, with 36% neutral and 21% positive across 14 articles.
Conclusion: Gold-related news tone is net negative, indicating a cautious sentiment backdrop for indices futures day traders.
USO,Oil Articles: 6
- Neutral: 66.67%
- Negative: 16.67%
- Positive: 16.67%
Sentiment Summary: USO and oil coverage is predominantly neutral (67%), with negative and positive sentiment each at 17%.
Conclusion: Oil-related news tone is balanced overall, with limited directional sentiment for indices futures context.
Market Data Snapshot
ETF Snapshot of major stock market ETFs, Mag7, and others as of: August 28, 2026 05:00
Top Movers & Losers
- AMZN 266.43 Bullish 3.97% ▲
- MSFT 513.53 Bullish 1.68% ▲
- AAPL 319.70 Bullish 1.63% ▲
- IBIT 43.90 Bearish -3.07% ▼
- GLD 408.89 Bearish -3.24% ▼
- NVDA 217.55 Bearish -4.58% ▼
Major Index ETFs: SPY, QQQ, DIA, IWM, IJH
- DIA 535.06 Bearish -0.03% ▼
- SPY 769.35 Bearish -0.23% ▼
- QQQ 716.43 Bearish -0.65% ▼
- IJH 75.76 Bearish -1.16% ▼
- IWM 295.75 Bearish -1.35% ▼
Major Index ETFs were Bearish across the group. IWM led losses at -1.35%, followed by IJH at -1.16% and QQQ at -0.65%. SPY declined -0.23%, while DIA was the least negative mover and near-flat at -0.03%.
Mag 7 Stocks: AAPL, MSFT, GOOG, AMZN, META, NVDA, TSLA
- AMZN 266.43 Bullish 3.97% ▲
- MSFT 513.53 Bullish 1.68% ▲
- AAPL 319.70 Bullish 1.63% ▲
- GOOG 342.88 Bullish 1.53% ▲
- META 578.02 Bullish 1.21% ▲
- TSLA 348.75 Bearish -1.71% ▼
- NVDA 217.55 Bearish -4.58% ▼
Mixed Mag7 snapshot: AMZN is the most bullish mover at +3.97%, followed by MSFT at +1.68%, AAPL at +1.63%, GOOG at +1.53%, and META at +1.21%. TSLA is Bearish at -1.71%, while NVDA is the most bearish mover at -4.58%.
Cross-Market ETFs: TLT, GLD, USO, IBIT
- USO 129.70 Bearish -0.24% ▼
- TLT 82.88 Bearish -0.30% ▼
- IBIT 43.90 Bearish -3.07% ▼
- GLD 408.89 Bearish -3.24% ▼
Other ETFs were Bearish across the snapshot. GLD led losses at -3.24%, followed by IBIT at -3.07%. TLT declined -0.30%, while USO was the least negative mover at -0.24%.
ETF, Mag7, and Cross-Market ETF Insights
Overall Tone
Mixed: large-cap technology leadership was Bullish while major equity ETFs and cross-market ETFs were broadly Bearish.
Equity ETFs and Mag7:
Major Index ETFs were Bearish, led lower by IWM -1.35% and IJH -1.16%, while DIA was marginal at -0.03%; QQQ fell -0.65% and SPY declined -0.23%. Mag7 performance was selective: AMZN was the most bullish mover at +3.97%, while NVDA was the most bearish mover at -4.58%; MSFT, AAPL, GOOG, and META were Bullish, while TSLA was Bearish at -1.71%. Equity performance was not broadly aligned, with mega-cap gains diverging from index ETF weakness.
Cross-Market ETFs:
Cross-Market ETFs were uniformly Bearish, with GLD the most bearish mover at -3.24% and IBIT also sharply lower at -3.07%. TLT was the least negative mover at -0.30%, while USO declined -0.24%, showing broad weakness across bonds, commodities, precious metals, and bitcoin exposure.
Futures Indices – Higher Time Frame Analysis
Summary of the current state of US Indices Futures based on higher time-frame (HTF) technical analysis as of: 2026-08-28: 17:00 CT.
US Indices Futures
- ES YSFG/MSFG/WSFG above F0%, benchmarks aligned upward, weekly pivots up; daily consolidation below 7838.50, support 7665.00-7683.50.
- NQ YSFG/MSFG/WSFG above F0%, benchmarks rising; weekly UTrend approaches 30343/31090, daily pivot structure down, support 28946.75.
- YM YSFG/MSFG/WSFG upward, benchmarks aligned higher, pivots broadly up; resistance 54884, reversal reference 52456, support 52812.
- EMD MSFG/YSFG above F0% and long benchmarks rising; WSFG below F0%, short pivots down, resistance 3860.0-3868.8, support 3792.4.
- RTY MSFG/YSFG above F0% and benchmarks upward; WSFG down below F0%, daily pivots down, resistance 3056.8-3079.9, support 2993.2.
- FDAX YSFG/MSFG/WSFG above F0%, all benchmarks upward, pivots up; resistance 26594-26685, support 25965 and opposite pivot 25145.
Overall State
- Short-Term: Neutral
- Intermediate-Term: Bullish
- Long-Term: Bullish
Conclusion
Intermediate and long-term directional correlation remains upward across all contracts, supported by rising benchmark alignment and YSFG/MSFG positioning. ES and NQ are consolidating beneath pivot resistance; EMD and RTY retain short-term corrective WSFG and pivot conditions. YM and FDAX maintain upward short-term structure, while major resistance levels remain active across the complex.
Note: Intra-day counter-trend pullbacks or retracements may occur, HTF is context for informational usage and market structure. Glossary: Session Fib Grids periods of YSFG:’Yearly’, MSFG:’Monthly’, WSFG:’Weekly’
For full details visit: AlphaWebTrader Technicals
ES Daily View
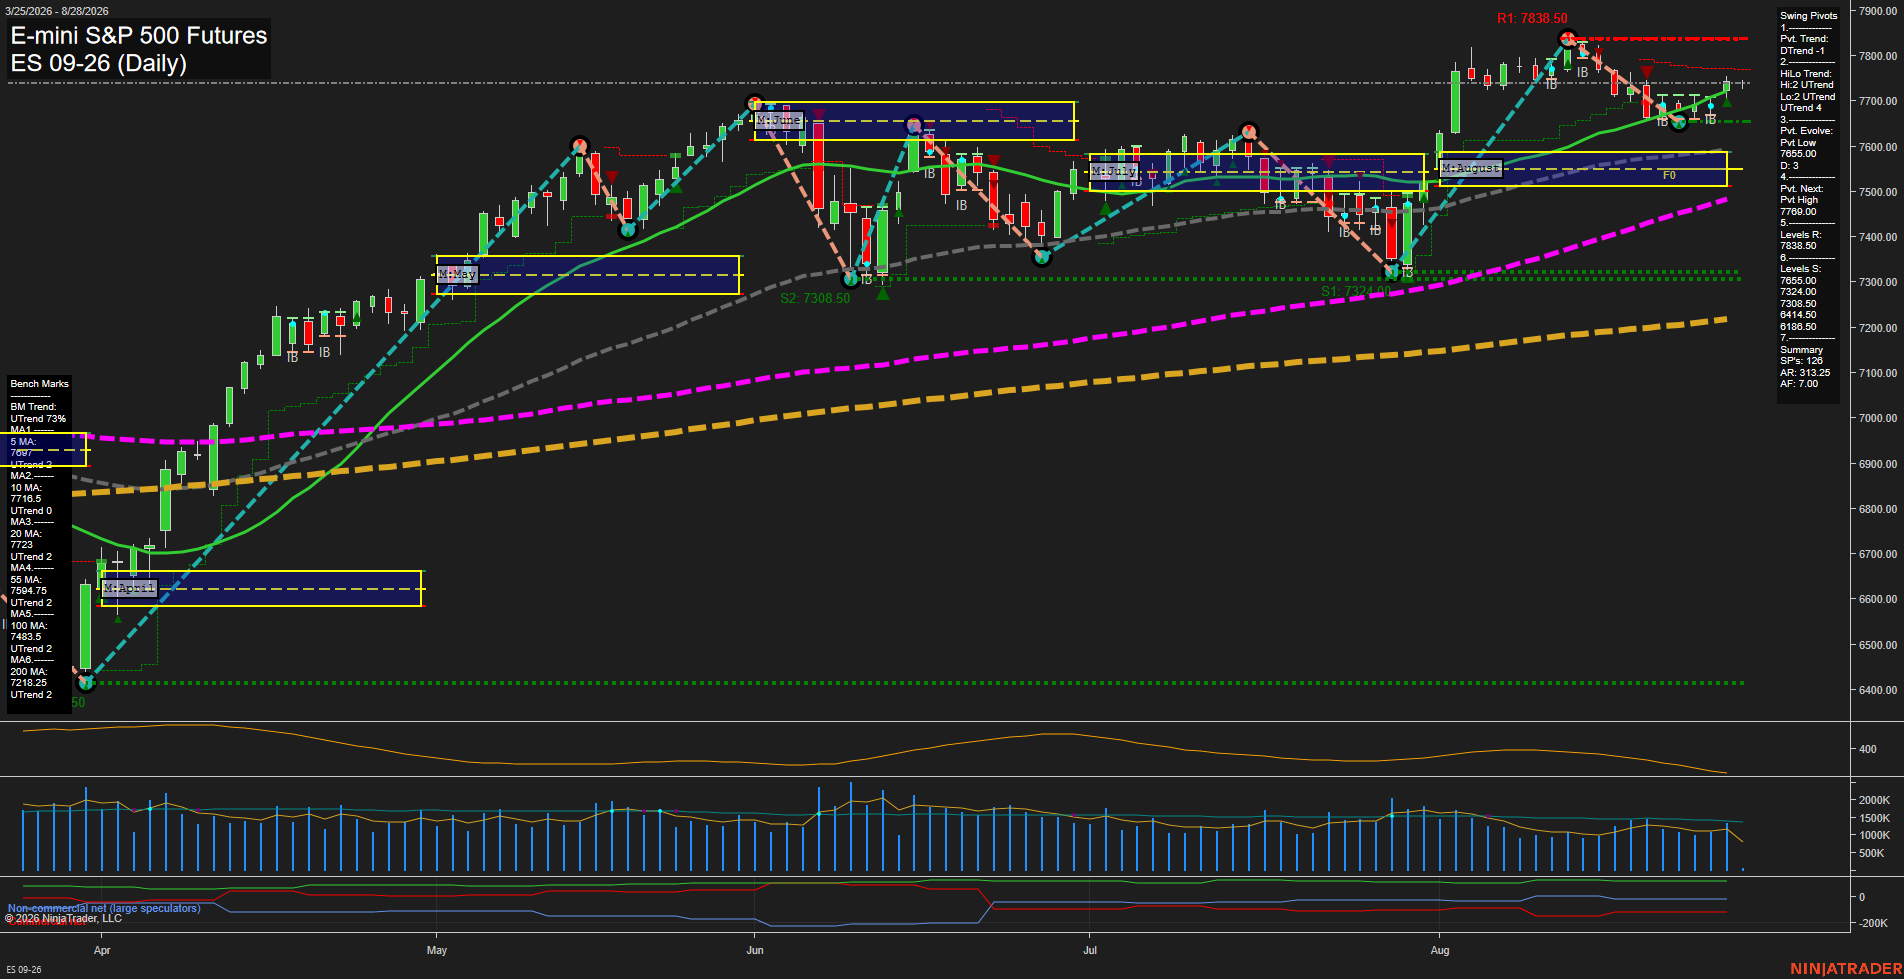
Overall Rating
- Short-Term: Neutral
- Intermediate-Term: Bullish
- Long-Term: Bullish.
Key Insights Summary
Price remains above every benchmark average and above the weekly, monthly, and yearly F0% levels, preserving the broader bullish structure. The intermediate pivot sequence remains an uptrend, while the short-term pivot trend is down after rejection beneath 7838.50 resistance. Recent small bars and slow momentum indicate consolidation following the August rally, with 7665.00 to 7683.50 defining the nearby pullback-support zone and 7789.00 to 7838.50 defining the overhead pivot-resistance zone.
View charts on: AlphaWebTrader HTF Charts
NQ Daily View
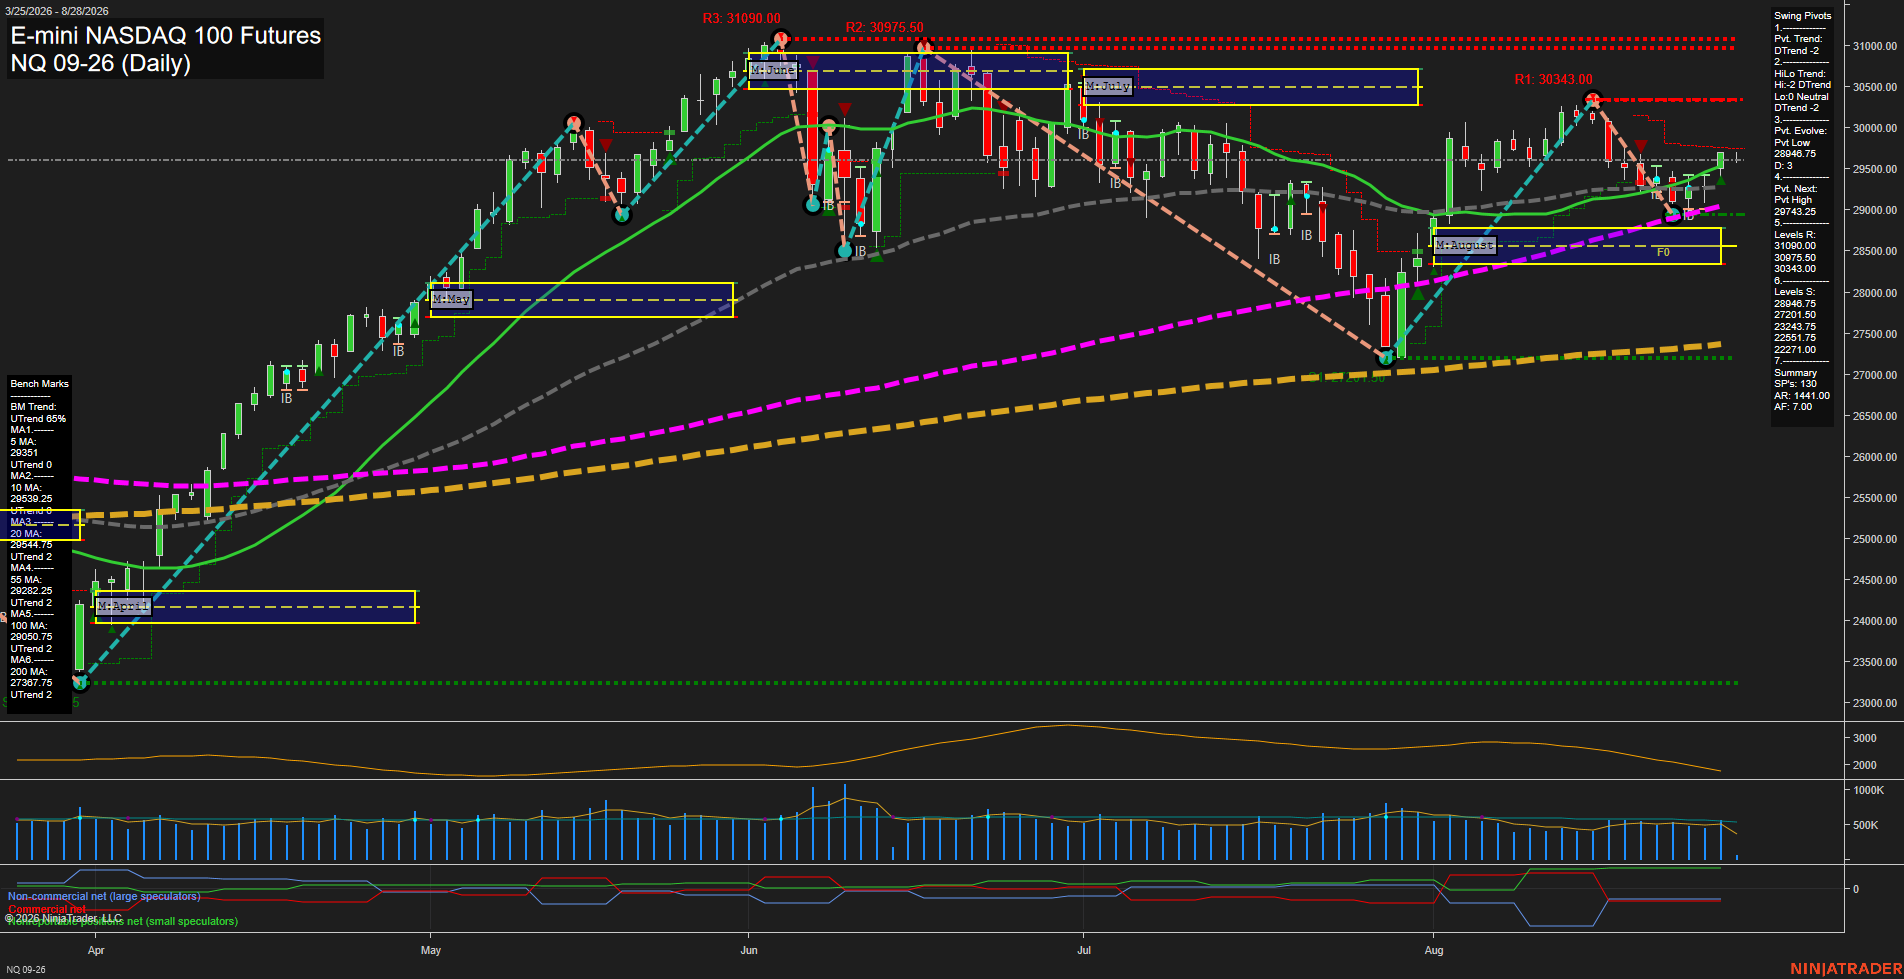
Overall Rating
- Short-Term: Neutral
- Intermediate-Term: Bullish
- Long-Term: Bullish.
Key Insights Summary
Price is consolidating near 29585 after the August V-recovery from the 28946.75 pivot low. Short-term moving averages and the weekly grid remain constructive, but the active pivot and HiLo structures remain in DTrend, reflecting a countertrend rebound beneath 29743.25 pivot confirmation. Intermediate and long-term structure remains positive: price is above the rising 20-, 55-, 100-, and 200-day benchmarks and above the monthly and yearly F0% grids. The immediate range is framed by 28946.75 support and 30343.00 resistance, with declining momentum and relatively contained volume indicating a choppy consolidation rather than a broad impulsive breakout.
View charts on: AlphaWebTrader HTF Charts
CL Daily View
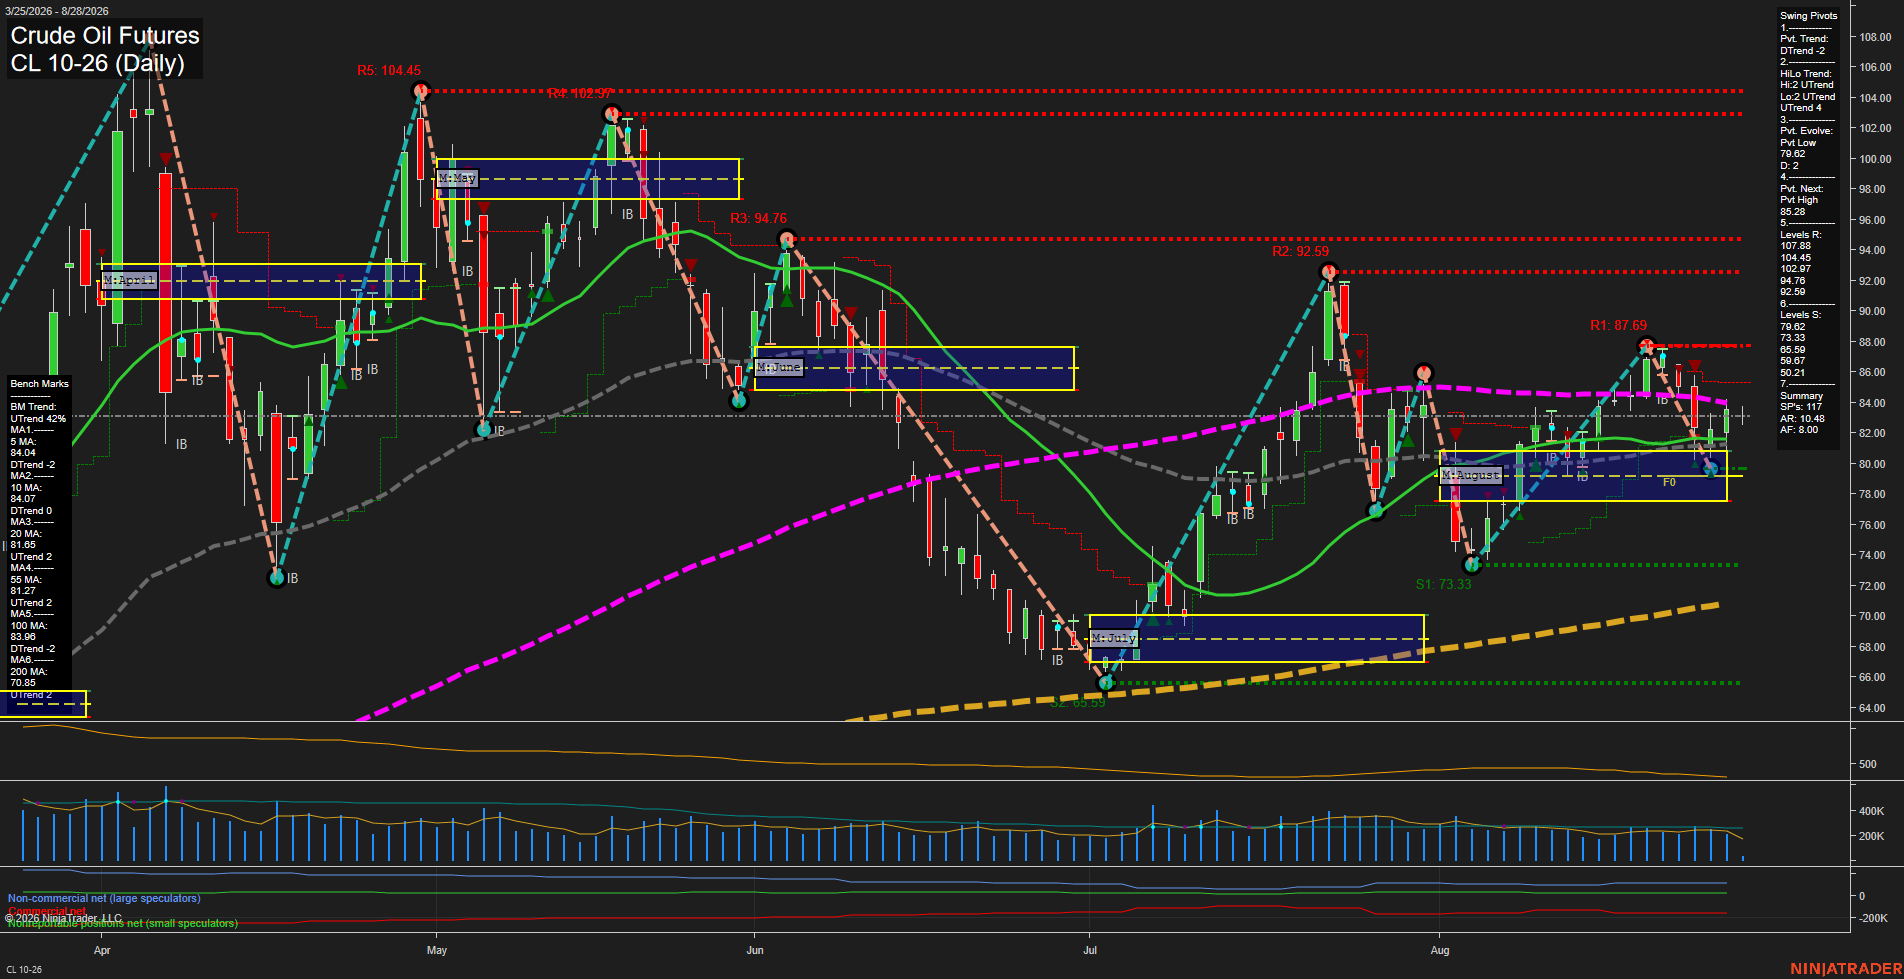
Overall Rating
- Short-Term: Bearish
- Intermediate-Term: Bullish
- Long-Term: Bullish.
Key Insights Summary
CL is consolidating with small, slower-momentum daily bars after a rejection from the 87.69 swing-high area. The short-term structure is corrective: price is below the weekly F0% area, the pivot trend is down, and the 5- and 10-day benchmarks slope lower. Intermediate structure remains constructive because price holds above the rising 20- and 55-day averages, the monthly grid remains positive, and the HiLo pivot trend is still up. The 79.62 pivot support and 79.02 pivot-evolve level define the nearby structural floor, while 85.28 is the next pivot reversal threshold and 87.69 is the more prominent overhead swing resistance. Long-term conditions remain positively aligned with the annual grid and rising 200-day benchmark, although the declining 100-day average at 83.90 reflects unresolved overhead supply.
View charts on: AlphaWebTrader HTF Charts
GC Daily View
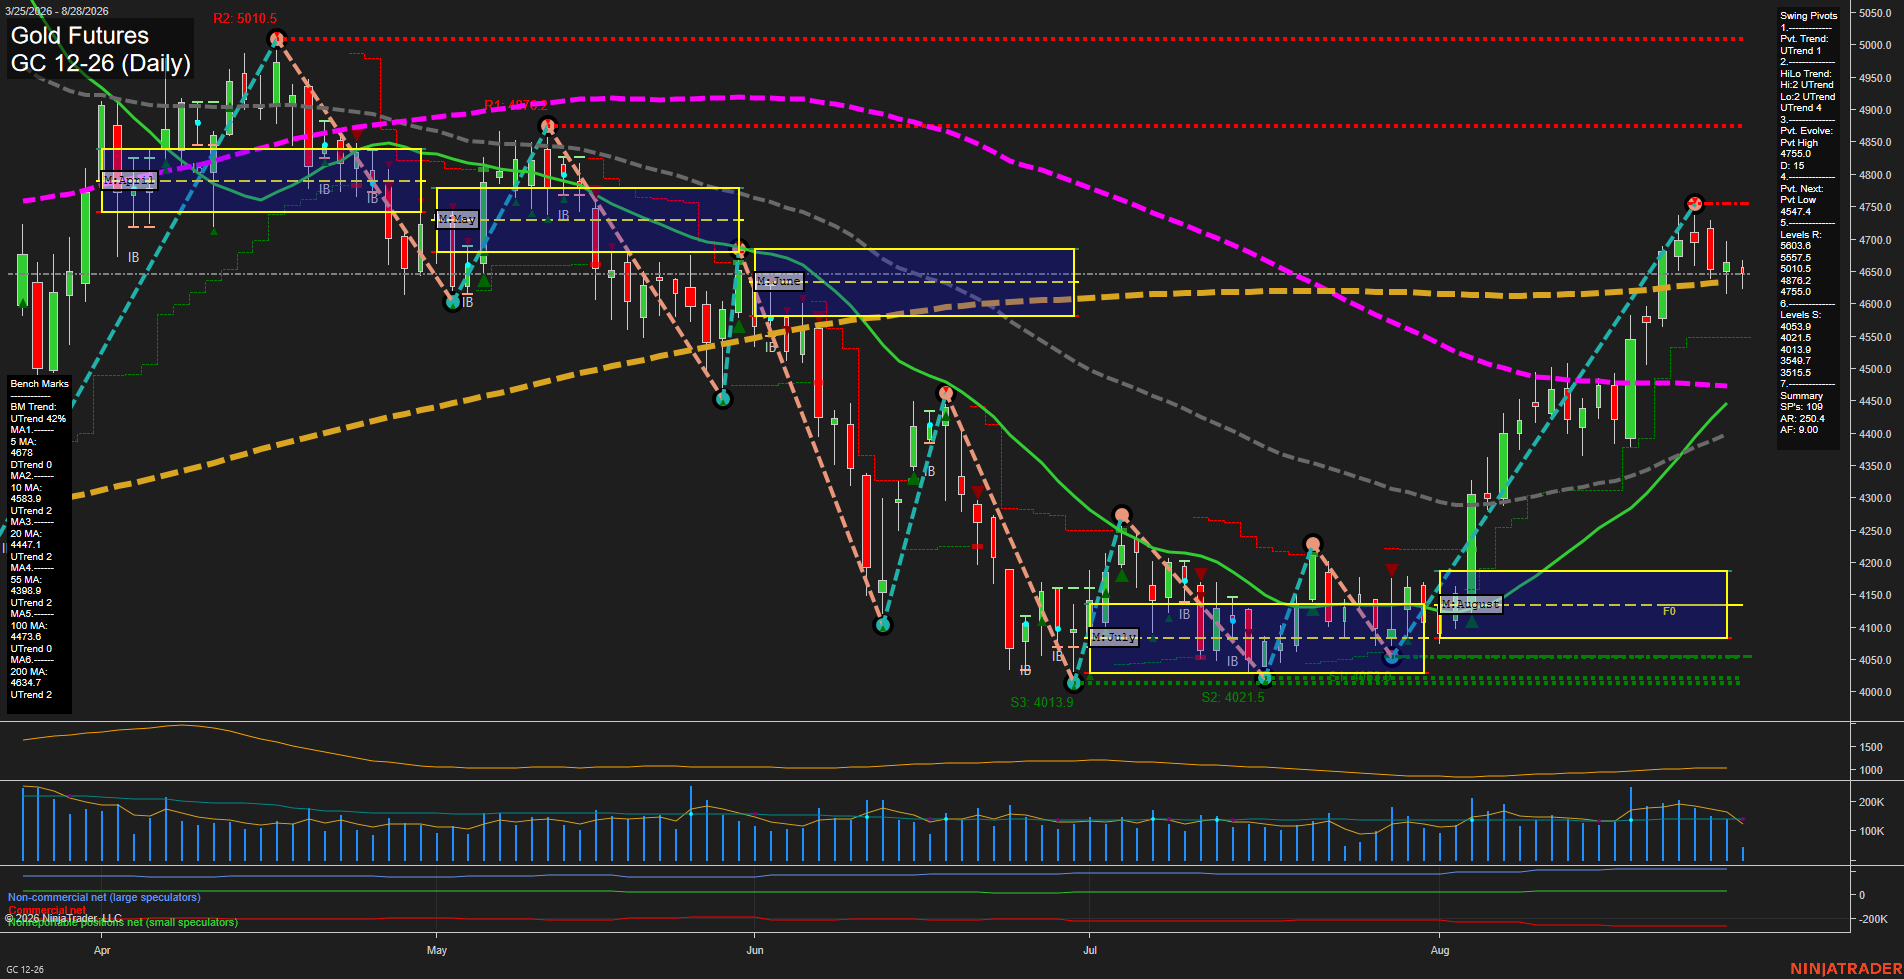
Overall Rating
- Short-Term: Neutral
- Intermediate-Term: Bullish
- Long-Term: Neutral.
Key Insights Summary
Gold remains in an intermediate pivot uptrend following the August advance from the 4050 area, with price holding above the rising 10-, 20-, 55-, 100-, and 200-day benchmarks. The recent push into the 4758 pivot high was rejected and has produced small, consolidating daily bars near the 5-day average, while the weekly fib-grid condition remains down and recent short-term signals are negative. This creates a mixed short-term structure beneath 4755.5-4758 resistance, while the broader August recovery remains intact above the 4547.4 pivot-reversal level and the rising intermediate moving-average cluster.
View charts on: AlphaWebTrader HTF Charts