Markets weighed Fed policy, rising Treasury yields and fiscal debt concerns as equities showed mixed technicals, while oil and gold held key levels.
Fundamentals: Equity markets faced mixed signals as Nasdaq 100 technicals remained compressed and S&P 500 options activity indicated upside-breakout positioning. Attention centered on Fed communication, a 30-year Treasury yield above 5.2%, and U.S. debt reaching $40 trillion. Gold held near $4,600, while crude tracked support levels amid Persian Gulf tensions.
Technicals: Equity-linked ETFs were mixed at the close, with Nvidia, Tesla and USO higher while Alphabet, Meta and Amazon declined. Weekly futures structures for the S&P 500, Nasdaq, Dow and DAX remained broadly bullish, though daily charts showed consolidation or pullbacks in several contracts. E-mini Dow was stronger short term, while E-mini S&P and Nasdaq were neutral and small caps and emerging markets were corrective.
After Market Close daily snapshot: market news summary and sentiment, major ETFs, Magnificent 7 analysis, Indices Futures Higher Time Frame Analysis, and E-mini S&P500, Nasdaq 100, NYMEX Crude, Gold Futures Daily Chart analysis.
As of: August 27, 2026 05:00 CT
Market News Summary:
Indices futures face cross-currents from Fed-policy uncertainty, elevated long-term yields, fiscal-debt concerns, and mixed technical signals across equities and commodities.
Primary Drivers & Risks:
- Primary Driver: Fed policy and Treasury yields
- Primary Risk: Fiscal debt and market volatility
Tone:
Cautious and range-bound, with selective bullish signals.
Stock Market / ETFs / Indices:
The Nasdaq 100 remains compressed in a Bollinger-band squeeze, with cited technical levels spanning 27,000 to 30,750. S&P 500 options activity and volatility indicators show upside-breakout signals, while another market view cites record valuations, deficits, and geopolitical risk as pressure points. Large S&P 500 index funds remain major holdings for Millennium Management.
Geopolitical:
Persian Gulf tensions continue to influence crude pricing and Strait of Hormuz transit discussions. Canadian officials stated that any U.S. trade agreement requires protection for Canada’s auto assembly and parts industry.
Oil / Energy:
WTI and Brent held around their 200-day EMA areas amid Gulf tensions, with Brent defending the $85 area. Later technical commentary showed WTI testing roughly $79 support after a bearish wedge breakdown.
Gold / Metals:
Gold traded near $4,590-$4,600 after weekly jobless claims fell to 203,000, while a firmer rates backdrop restrained momentum. Commentary cited U.S. fiscal debt, de-dollarization, and dollar-debasement concerns as longer-term supports; near-term technical references included $4,527-$4,500 support and resistance near $4,700.
Fed / Financials:
Attention centers on Fed Chair Kevin Warsh’s Jackson Hole remarks, inflation expectations, and Treasury plans to repurchase long-dated debt. The 30-year Treasury yield exceeded 5.2%, while softer jobs, retail-sales, and inflation data prompted reduced near-term rate-hike expectations. Former Fed officials described the labor market as broadly balanced and Treasury intervention as a complication for policy communication.
Macro / Other:
U.S. federal debt reached $40 trillion, intensifying discussion around deficit reduction and currency debasement. Technology companies urged expanded defenses against AI-driven cyberattacks.
Conclusion:
Fed communication, long-duration Treasury yields, and equity-index technical positioning are the central market inputs. Gold remains sensitive to rate and dollar movements, while crude tracks key support levels and Gulf developments.
High federal debt and bond-market pressure add a broader valuation and volatility backdrop. Treasury debt operations, inflation expectations, and trade or geopolitical headlines remain cross-currents for risk assets.
Market News Sentiment
Market News Articles: 33
- Neutral: 54.55%
- Positive: 33.33%
- Negative: 12.12%
Sentiment Summary: Of 33 market news articles, 55% were neutral, 33% positive, and 12% negative.
Conclusion: News sentiment for indices futures is predominantly neutral, with positive coverage exceeding negative coverage.
GLD,Gold Articles: 12
- Positive: 66.67%
- Negative: 25.00%
- Neutral: 8.33%
Sentiment Summary: GLD/Gold coverage was predominantly positive at 67%, with 25% negative and 8% neutral across 12 articles.
Conclusion: Gold-related news tone was positive overall, indicating a generally favorable sentiment backdrop relevant to indices futures monitoring.
USO,Oil Articles: 9
- Negative: 55.56%
- Neutral: 33.33%
- Positive: 11.11%
Sentiment Summary: USO and oil coverage was predominantly negative at 56%, with 33% neutral and 11% positive across 9 articles.
Conclusion: The oil news tone is negative overall, indicating a predominantly risk-sensitive commodity backdrop for indices futures day traders.
Market Data Snapshot
ETF Snapshot of major stock market ETFs, Mag7, and others as of: August 27, 2026 05:00
Top Movers & Losers
- NVDA 227.98 Bullish 8.74% ▲
- TSLA 354.81 Bullish 2.60% ▲
- USO 130.01 Bullish 2.09% ▲
- GOOG 337.71 Bearish -0.41% ▼
- META 571.10 Bearish -0.87% ▼
- AMZN 256.26 Bearish -1.54% ▼
Major Index ETFs: SPY, QQQ, DIA, IWM, IJH
- QQQ 721.11 Bullish 1.37% ▲
- SPY 771.10 Bullish 0.66% ▲
- IWM 299.81 Bullish 0.29% ▲
- DIA 535.22 Bullish 0.19% ▲
- IJH 76.65 Bullish 0.04% ▲
Major index ETFs were Bullish across the board. QQQ led as the most bullish mover at +1.37%, followed by SPY at +0.66%. IWM gained +0.29% and DIA added +0.19%, while IJH was the least positive mover and near-flat at +0.04%.
Mag 7 Stocks: AAPL, MSFT, GOOG, AMZN, META, NVDA, TSLA
- NVDA 227.98 Bullish 8.74% ▲
- TSLA 354.81 Bullish 2.60% ▲
- MSFT 505.06 Bullish 1.75% ▲
- AAPL 314.58 Bullish 0.36% ▲
- GOOG 337.71 Bearish -0.41% ▼
- META 571.10 Bearish -0.87% ▼
- AMZN 256.26 Bearish -1.54% ▼
Mixed Mag7 action: NVDA was the most bullish mover at +8.74%, followed by TSLA at +2.60% and MSFT at +1.75%. AAPL was modestly Bullish at +0.36%. AMZN was the most bearish mover at -1.54%, with META at -0.87% and GOOG at -0.41%.
Cross-Market ETFs: TLT, GLD, USO, IBIT
- USO 130.01 Bullish 2.09% ▲
- IBIT 45.29 Bullish 1.87% ▲
- GLD 422.60 Bullish 0.30% ▲
- TLT 83.13 Bearish -0.20% ▼
Mixed cross-market snapshot: USO is the most bullish mover at +2.09%, followed by IBIT at +1.87%. GLD is modestly Bullish at +0.30%, while TLT is the most bearish mover at -0.20%.
ETF, Mag7, and Cross-Market ETF Insights
Overall Tone
Mixed, with broad equity ETFs Bullish while Mag7 participation is selective and cross-market flows show commodity and bitcoin strength alongside marginal TLT Bearish movement.
Equity ETFs and Mag7:
Major Index ETFs were broadly Bullish: QQQ led at +1.37%, followed by SPY at +0.66%, while IJH was marginally positive at +0.04%. Mag7 performance was selective, led decisively by NVDA at +8.74%, the most bullish mover across all provided instruments; TSLA at +2.60% and MSFT at +1.75% also advanced. AMZN at -1.54% was the most bearish mover, with META at -0.87% and GOOG at -0.41% lower, indicating selective rather than fully aligned equity leadership.
Cross-Market ETFs:
Cross-market ETFs were Mixed: USO led at +2.09%, the most bullish cross-market mover, while IBIT gained +1.87% and GLD added +0.30%. TLT declined -0.20%, the most bearish cross-market mover, though the move was modest. Commodity and bitcoin strength contrasted with marginal bond weakness while equity ETFs remained Bullish.
Futures Indices – Higher Time Frame Analysis
Summary of the current state of US Indices Futures based on higher time-frame (HTF) technical analysis as of: 2026-08-27: 17:00 CT.
US Indices Futures
- ES YSFG/MSFG/WSFG upward, above major benchmarks; 7838.50 resistance, 7665.00/7634.00 support; weekly pivots up, daily pullback neutral.
- NQ YSFG/MSFG/WSFG above F0%; benchmarks rising; 30343.00/31090.00 resistance, 28946.75 support; weekly pivots up, daily pivots down.
- YM YSFG/MSFG/WSFG rising, above benchmarks; UTrend pivots; 54884 resistance, 52975-52812 support; daily recovery tests 53811.
- EMD MSFG/YSFG rising and benchmarks supportive; 3941.7 resistance, 3804.7/3792.4 support; weekly neutral, daily DTrend bearish.
- RTY MSFG/YSFG upward and benchmarks rising; 3079.9 resistance, 2993.5/2887.3 support; WSFG down, daily pivots bearish.
- FDAX YSFG/MSFG/WSFG above centers, all benchmarks rising; UTrend pivots; 26665 resistance, 26095/25149 pivot support.
Overall State
- Short-Term: Neutral
- Intermediate-Term: Bullish
- Long-Term: Bullish
Conclusion
Higher-time-frame alignment remains bullish across the index complex: MSFG and YSFG positions are upward, with prices generally above rising major benchmarks. ES and NQ are consolidating below swing highs; YM and FDAX retain upward pivot alignment. EMD and RTY show the deepest short-term retracements, with declining daily pivots and WSFG pressure. Resistance is defined by recent swing highs, while listed pivot lows and benchmark clusters define support.
Note: Intra-day counter-trend pullbacks or retracements may occur, HTF is context for informational usage and market structure. Glossary: Session Fib Grids periods of YSFG:’Yearly’, MSFG:’Monthly’, WSFG:’Weekly’
For full details visit: AlphaWebTrader Technicals
ES Daily View
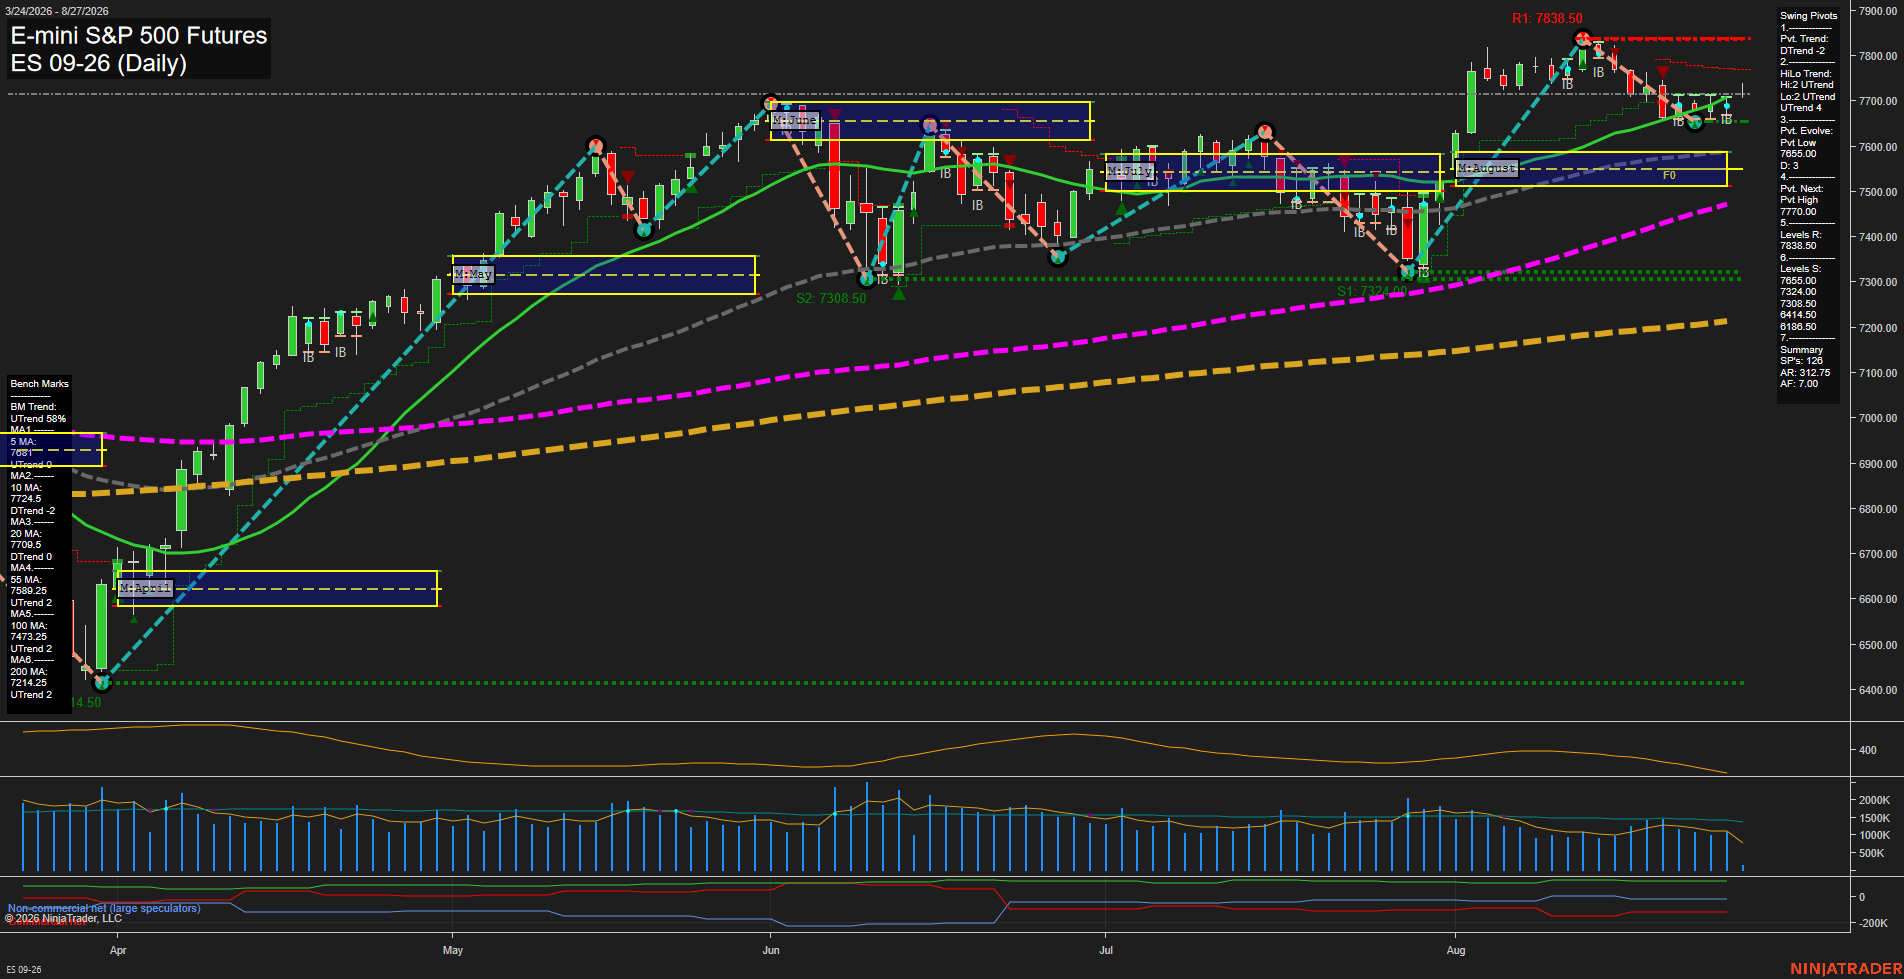
Overall Rating
- Short-Term: Neutral
- Intermediate-Term: Bullish
- Long-Term: Bullish.
Key Insights Summary
The daily structure remains bullish across the intermediate and long-term horizons, with price holding above the rising 55, 100, and 200-day benchmarks and remaining above the monthly and yearly F0% zones. Short-term action is mixed: the pivot trend is down and the 10 and 20-day averages are declining, reflecting a pullback from the 7838.50 swing-high resistance area. The 7665.00 developing pivot low and clustered 7634.00 support identify the near-term retracement structure, while a recovery through the 7700.00 pivot threshold would indicate renewed upside swing evolution. Volume and ATR have moderated versus earlier expansion phases, consistent with consolidation following the August rally rather than a broad intermediate-trend reversal.
View charts on: AlphaWebTrader HTF Charts
NQ Daily View
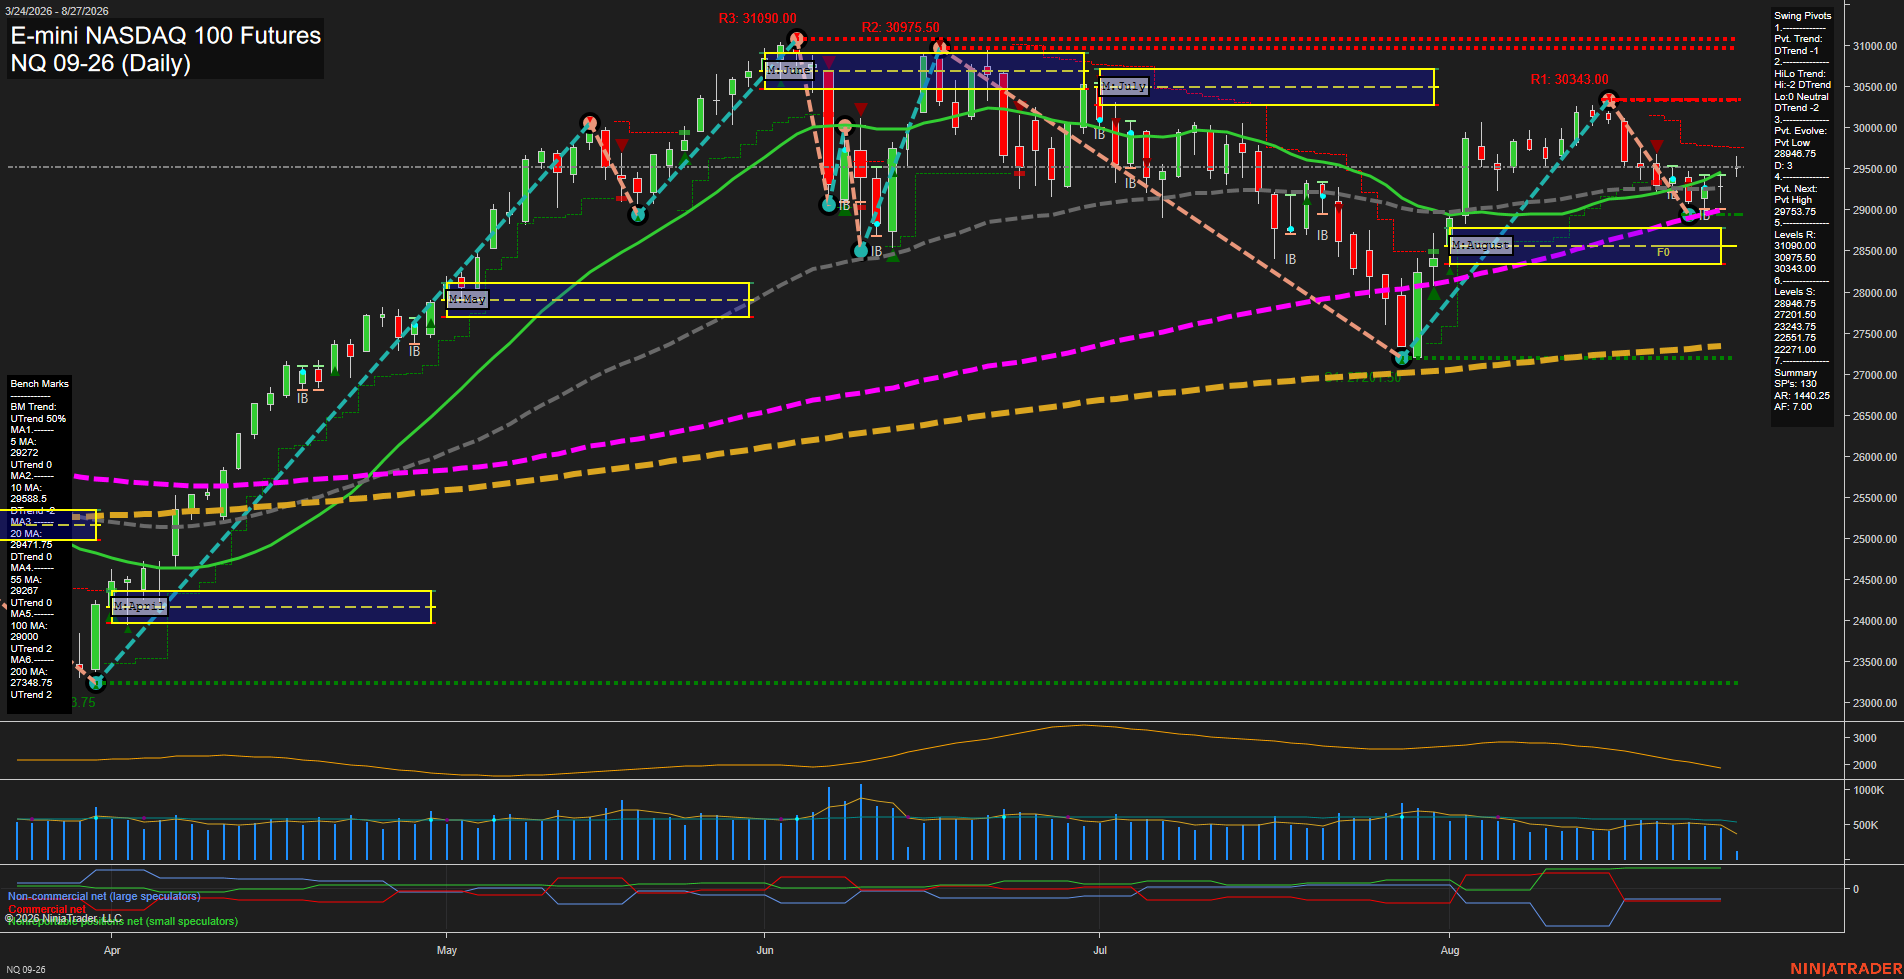
Overall Rating
- Short-Term: Neutral
- Intermediate-Term: Bullish
- Long-Term: Bullish.
Key Insights Summary
Price is holding above the weekly and monthly F0% areas and remains above the rising 55-, 100-, and 200-day benchmarks, preserving the broader recovery structure from the early-August low. Short-term swing pivots remain in DTrend/LoLo status following rejection from the 30343 resistance area, while the developing pivot low at 28946.75 defines the nearby structural floor. The 20-day average remains in a down trend and price is consolidating around the 5- and 10-day benchmarks, reflecting a choppy short-term retracement within a still-positive intermediate and long-term trend. A sustained move through 29763.75 would improve the immediate pivot structure, while 30343.00 remains the principal overhead swing resistance.
View charts on: AlphaWebTrader HTF Charts
CL Daily View
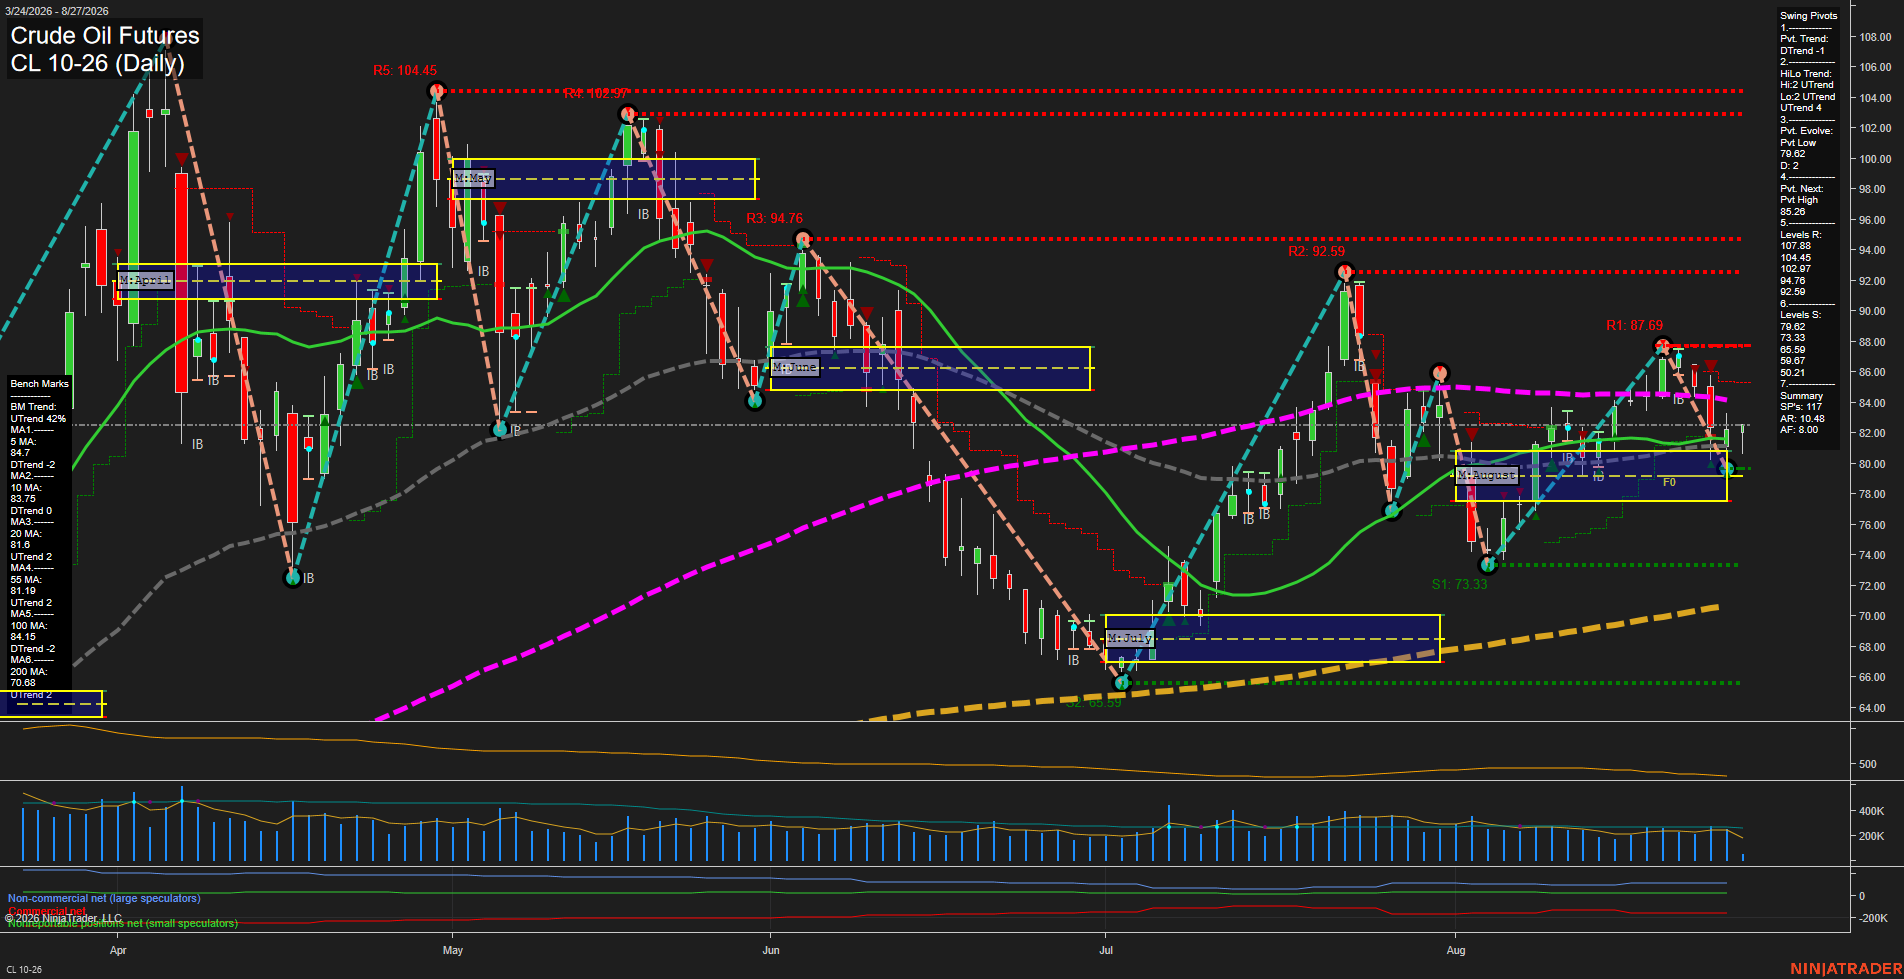
Overall Rating
- Short-Term: Bearish
- Intermediate-Term: Bullish
- Long-Term: Bullish.
Key Insights Summary
Price is consolidating near 80.48 after a sharp rejection from the 87.69 swing high and is trading below the weekly F0% level, with the short-term pivot structure and both 5- and 10-day benchmarks still down. The recent small bars show slowing downside momentum around the 79.62 pivot-low support area. Intermediate structure remains constructive: price holds above the August monthly F0% region, the HiLo trend is up, and the 20- and 55-day averages retain upward trends. The broader yearly structure remains positive above the rising 200-day benchmark, although the declining 100-day average and 85.26 pivot-high reversal level define overhead recovery pressure.
View charts on: AlphaWebTrader HTF Charts
GC Daily View
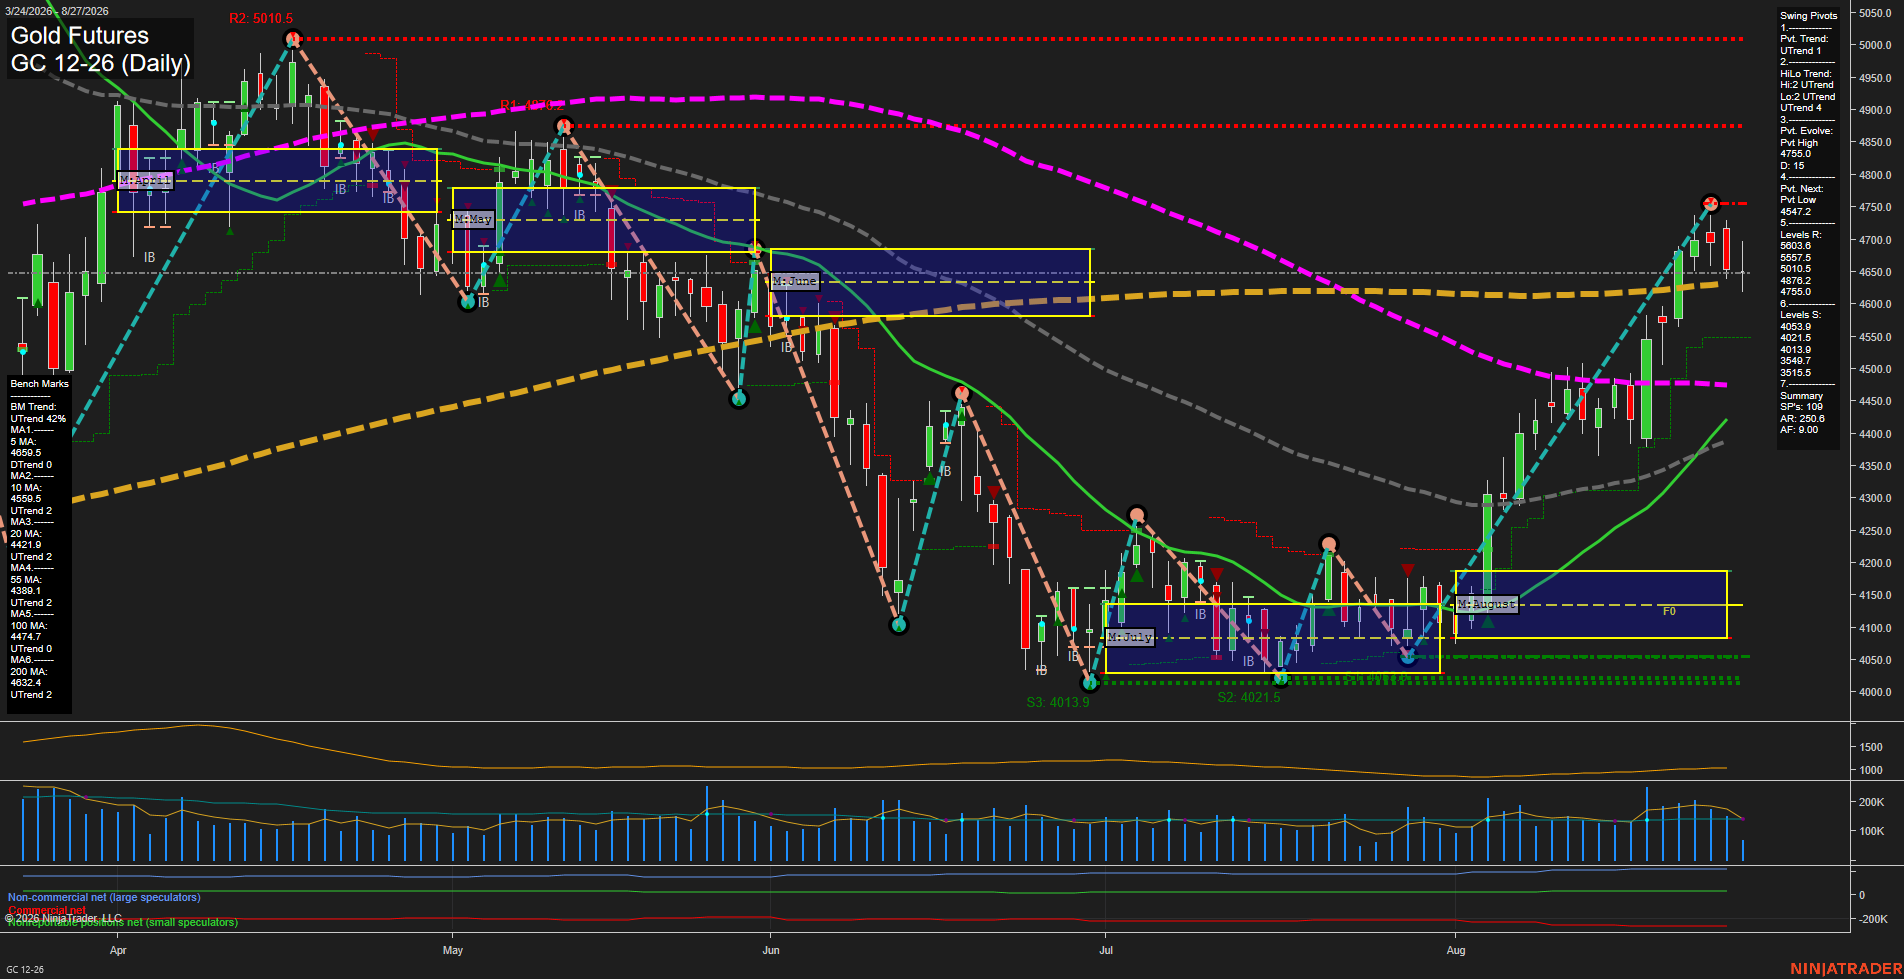
Overall Rating
- Short-Term: Neutral
- Intermediate-Term: Bullish
- Long-Term: Bullish.
Key Insights Summary
Gold remains in a broad recovery structure, with price holding above the rising 10, 20, 55, 100, and 200-day benchmarks and the intermediate pivot structure still registering UTrend. The late-August advance reached the 4755 pivot resistance area and was rejected, creating a short-term pullback while price trades below the weekly F0% level. This leaves the short-term condition mixed: fast momentum has cooled from the rally high, yet the larger sequence of higher lows and positive benchmark alignment remains intact. The 4547.2 reversal-pivot level is the key nearby structural reference beneath current price, while 4755.0 is the immediate overhead swing resistance.
View charts on: AlphaWebTrader HTF Charts