U.S. futures edge higher as tech earnings, Treasury buybacks and Iran sanctions keep bonds, gold, oil, Bitcoin and ETF technicals in focus.
Fundamentals: U.S. index futures moved modestly higher ahead of technology earnings and consumer data, while Treasury plans to buy back longer-dated debt kept bond-market conditions in focus. New U.S. measures targeting Iran and Tehran’s pledge to respond added geopolitical risk. A weaker dollar supported gold and Bitcoin, while oil extended losses despite concerns over Iranian supply.
Technicals: Pre-market conditions follow mixed ETF leadership, with IBIT, Meta and Amazon higher in the prior session while USO, Nvidia and Tesla declined. Futures technicals show short-term consolidation or pullbacks across several major contracts, including ES and NQ, while intermediate and long-term structures generally remain bullish. Key pivot support and resistance levels frame the current market landscape.
Pre-Market Trading 360° view Market Radar of: holidays, earnings, eco-news, market-news summary, news sentiment, prior session major ETFs, MAG7, Higher Time Frame Analysis Indices Futures Summary, and E-mini S&P500, Nasdaq 100, NYMEX Crude, Gold Futures Daily Chart analysis.
As of: August 25, 2026 07:16 CT
Earnings Radar
Monitoring for earnings releases by the Magnificent 7, AI-tech-related firms, and major financial institutions.
- CRM Release: 2026-08-26 T:AMC
- NVDA Release: 2026-08-26 T:AMC
Conclusion: CRM and NVDA report after the close on 2026-08-26, concentrating broad index relevance in enterprise software, AI, and semiconductors. Market momentum and volume can slow ahead of these major tech earnings releases, with post-release reactions shaping index-futures sentiment.
For full details visit: Yahoo Earnings Calendar
EcoNews Radar U.S. Events
| Day | Time | Impact | Event |
|---|---|---|---|
| Tue | 10:00 | Medium | CB Consumer Confidence |
| Wed | 08:30 | High | Core PCE Price Index m/m |
| Wed | 08:30 | High | Prelim GDP q/q |
| Wed | 08:30 | Medium | Prelim GDP Price Index q/q |
| Wed | 10:30 | Low | Crude Oil Inventories |
| Thu | 08:30 | Medium | Unemployment Claims |
| Thu | 12:15 | Medium | Jackson Hole Symposium |
| Fri | 10:00 | High | Fed Chairman Warsh Speaks |
| Fri | 10:00 | High | Prelim Benchmark Payrolls Revision |
| Fri | 10:00 | Medium | Revised UoM Consumer Sentiment |
| Fri | 10:00 | Medium | Revised UoM Inflation Expectations |
| Fri | 12:15 | High | Jackson Hole Symposium |
| Sat | 12:15 | Medium | Jackson Hole Symposium |
EcoNews Summary
Wednesday’s 08:30 releases concentrate the week’s key U.S. inflation and growth data, led by Core PCE Price Index and Preliminary GDP. Friday features a 10:00 cluster of high-impact Federal Reserve communication and labor-market benchmark revision data, followed by the high-impact Jackson Hole Symposium session at 12:15.
Event Notes:
- Wednesday 08:30 Core PCE Price Index m/m: Measures monthly changes in consumer prices excluding food and energy. It is a primary inflation gauge monitored for its connection to Federal Reserve policy and interest-rate expectations.
- Wednesday 08:30 Prelim GDP q/q: Measures the annualized quarterly change in U.S. economic output in the preliminary estimate. Traders monitor it for evidence of economic growth or slowdown and related rate-policy implications.
- Friday 10:00 Fed Chairman Warsh Speaks: Public remarks from the Federal Reserve Chairman. Markets monitor comments for discussion of inflation, growth, labor conditions, and monetary policy.
- Friday 10:00 Prelim Benchmark Payrolls Revision: Revises previously reported payroll levels using more complete employment records. It provides a reassessment of underlying labor-market conditions.
- Friday 12:15 Jackson Hole Symposium: High-impact central-bank symposium session. Traders monitor policy-related commentary and broader discussion of inflation, economic conditions, and monetary frameworks.
Conclusion:
The single most important event is Wednesday’s 08:30 Core PCE Price Index, given its direct inflation and Federal Reserve policy relevance. Market momentum and volume often slow ahead of major PCE and GDP releases, with increased volatility at release time. Friday’s 10:00 event cycle also places Federal Reserve remarks and the payroll benchmark revision at a common catalyst window for reversals or continuations.
For full details visit: Forex Factory EcoNews
Market News Summary:
U.S. index futures edged higher as Treasury buyback plans, tech earnings, Iran sanctions, and a weaker dollar drove cross-asset focus.
Primary Drivers & Risks:
- Primary Driver: Treasury buyback and bond-market focus
- Primary Risk: Iran retaliation and debt-market stress
Tone:
Cautious, with firmer futures amid substantial cross-currents.
Stock Market / ETFs / Indices:
U.S. stock futures edged higher early Tuesday ahead of technology earnings and incoming housing and consumer data. Japanese equities fell 0.8%, led by electronics shares after a decline in U.S. technology stocks overnight. Shein’s Hong Kong IPO order book was fully covered, indicating investor demand for the offering.
Geopolitical:
The U.S. introduced harsher measures targeting Iran and entities connected to its financial networks. Iran pledged a response, raising concern around retaliation and broader exposure for countries and businesses trading with Tehran.
Oil / Energy:
Oil steadied after a prior-session decline of more than 2%, then extended losses toward a 12-day low despite Iran-related supply concerns. Traders assessed whether expanded U.S. sanctions would materially affect Iranian oil flows, while reports cited bearish crude price action.
Gold / Metals:
Gold reached its highest level in more than three months, supported by dollar weakness, Treasury buyback plans, ETF inflows, central-bank demand, fiscal concerns, and geopolitical uncertainty. Silver also remained supported, while GLD taxable-account gains face collectible tax treatment.
Fed / Financials:
Treasury buybacks of longer-dated securities begin under a new structure on Sept. 9, while regular Treasury auctions continue. Market participants described the operations as a cloud over markets and cited reduced usefulness of bond-market signals for Federal Reserve policy assessment. U.S. debt near $40 trillion remained a focal point.
Macro / Other:
Gold and Bitcoin strengthened as concern around government spending and dollar debasement returned to market attention; Bitcoin rose above $80,000. Traders also awaited U.S. PCE inflation data and Jackson Hole remarks.
Conclusion:
U.S. futures were modestly higher ahead of technology earnings and economic data. Treasury buyback plans, elevated debt concerns, and bond-market scrutiny were the main macro catalysts.
Iran sanctions and retaliation threats remained geopolitical risks, though crude prices fell despite supply concerns. Dollar weakness supported gold and Bitcoin, underscoring demand for alternative stores of value.
Market News Sentiment
Market News Articles: 30
- Neutral: 40.00%
- Negative: 36.67%
- Positive: 23.33%
Sentiment Summary: Market news sentiment is mixed to slightly negative, with 40% neutral, 37% negative, and 23% positive articles.
Conclusion: Indices futures coverage shows more negative than positive reporting, while neutral news remains the largest category.
GLD,Gold Articles: 17
- Positive: 52.94%
- Neutral: 41.18%
- Negative: 5.88%
Sentiment Summary: Gold-related coverage is 53% positive, 41% neutral, and 6% negative across 17 articles.
Conclusion: The news tone for GLD and gold is predominantly positive, with limited negative coverage.
USO,Oil Articles: 6
- Positive: 50.00%
- Neutral: 33.33%
- Negative: 16.67%
Sentiment Summary: USO and oil coverage is moderately positive, with 50% positive, 33% neutral, and 17% negative articles.
Conclusion: Oil-related news tone is net positive but includes a meaningful neutral share for indices futures day traders.
Market Data Snapshot
ETF Snapshot of major stock market ETFs, Mag7, and others as of: August 25, 2026 07:16
Top Movers & Losers
- IBIT 44.64 Bullish 2.20% ▲
- META 559.02 Bullish 1.66% ▲
- AMZN 262.07 Bullish 1.33% ▲
- USO 132.21 Bearish -1.80% ▼
- NVDA 208.48 Bearish -2.91% ▼
- TSLA 348.95 Bearish -3.83% ▼
Major Index ETFs: SPY, QQQ, DIA, IWM, IJH
- DIA 533.65 Bullish 0.27% ▲
- SPY 763.47 Bearish -0.29% ▼
- IWM 297.97 Bearish -0.66% ▼
- IJH 76.20 Bearish -0.74% ▼
- QQQ 706.32 Bearish -1.00% ▼
Mixed index ETF context: DIA is the most bullish mover at +0.27%, while QQQ is the most bearish mover at -1.00%. SPY is Bearish at -0.29%, with broader small- and mid-cap weakness in IWM at -0.66% and IJH at -0.74%.
Mag 7 Stocks: AAPL, MSFT, GOOG, AMZN, META, NVDA, TSLA
- META 559.02 Bullish 1.66% ▲
- AMZN 262.07 Bullish 1.33% ▲
- MSFT 487.31 Bullish 0.84% ▲
- GOOG 344.59 Bullish 0.83% ▲
- AAPL 310.34 Bullish 0.32% ▲
- NVDA 208.48 Bearish -2.91% ▼
- TSLA 348.95 Bearish -3.83% ▼
Mixed: META is the most bullish mover at +1.66%, followed by AMZN at +1.33%. MSFT and GOOG are Bullish at +0.84% and +0.83%, while AAPL is modestly Bullish at +0.32%. TSLA is the most bearish mover at -3.83%, with NVDA also Bearish at -2.91%.
Cross-Market ETFs: TLT, GLD, USO, IBIT
- IBIT 44.64 Bullish 2.20% ▲
- GLD 426.69 Bullish 0.79% ▲
- TLT 82.56 Bullish 0.62% ▲
- USO 132.21 Bearish -1.80% ▼
Mixed cross-market context: IBIT is the most bullish mover at +2.20%, while USO is the most bearish mover at -1.80%. GLD adds a Bullish +0.79% and TLT gains +0.62%.
ETF, Mag7, and Cross-Market ETF Insights
Overall Tone
Mixed: equity index ETFs were uneven while Mag7 leadership was selective, alongside Bullish gains in bonds, gold, and Bitcoin exposure.
Equity ETFs and Mag7:
Major Index ETFs were Mixed: DIA rose +0.27%, while SPY fell -0.29%, IWM lost -0.66%, IJH declined -0.74%, and QQQ was the most bearish index ETF at -1.00%. Mag7 performance was selective, led by META—the most bullish equity mover—at +1.66%, followed by AMZN +1.33%, MSFT +0.84%, GOOG +0.83%, and AAPL +0.32%. NVDA fell -2.91% and TSLA was the most bearish mover at -3.83%, showing narrow leadership rather than broad equity alignment.
Cross-Market ETFs:
Cross-market ETFs were Mixed, with IBIT the most bullish mover at +2.20%, while GLD gained +0.79% and TLT added +0.62%. USO was the most bearish cross-market ETF at -1.80%, contrasting with Bullish Bitcoin, gold, and Treasury ETF performance.
Futures Indices – Higher Time Frame Analysis
Summary of the current state of US Indices Futures based on higher time-frame (HTF) technical analysis as of: 2026-08-25: 07:16 CT.
US Indices Futures
- ES YSFG/MSFG rising, WSFG mixed; benchmarks rising; daily pivot down below 7838.50; support 7655/7635, weekly reversal reference 7457.
- NQ YSFG/MSFG rising, WSFG declining; long benchmarks rising; daily DTrend; resistance 30343/31090, support and reversal reference 27201.50.
- YM YSFG/MSFG/WSFG rising, all benchmarks aligned higher; pivot structure up; resistance 53790/54884, support 52934-52812 then 51630.
- EMD YSFG/MSFG rising, WSFG weak; long benchmarks rising; short pivots down; resistance 3854.5-3857.9/3941.7, support 3793.7-3804.7.
- RTY YSFG/MSFG rising, WSFG extended; benchmarks rising; daily DTrend beneath 3079.9; support 2992.3/2926.0, reversal level 3059.4.
- FDAX YSFG/MSFG/WSFG rising, benchmarks aligned higher; intermediate pivots up; daily short pivot down; resistance 26401/26665, support 25985/25918.
Overall State
- Short-Term: Neutral
- Intermediate-Term: Bullish
- Long-Term: Bullish
Conclusion
Higher-timeframe correlations remain upward across all indices through rising YSFG and MSFG structures, long-term benchmark alignment, and generally higher intermediate pivot trends. YM and FDAX retain firmer short-term structures; ES, NQ, EMD, and RTY show pullback or consolidation conditions beneath defined pivot-high resistance. Key resistance is clustered at ES 7838.50, NQ 30343, YM 54884, EMD 3941.7, RTY 3079.9, and FDAX 26665. Nearby pivot supports define the current retracement references.
Note: Intra-day counter-trend pullbacks or retracements may occur, HTF is context for informational usage and market structure. Glossary: Session Fib Grids periods of YSFG:’Yearly’, MSFG:’Monthly’, WSFG:’Weekly’
For full details visit: AlphaWebTrader Technicals
ES Daily View
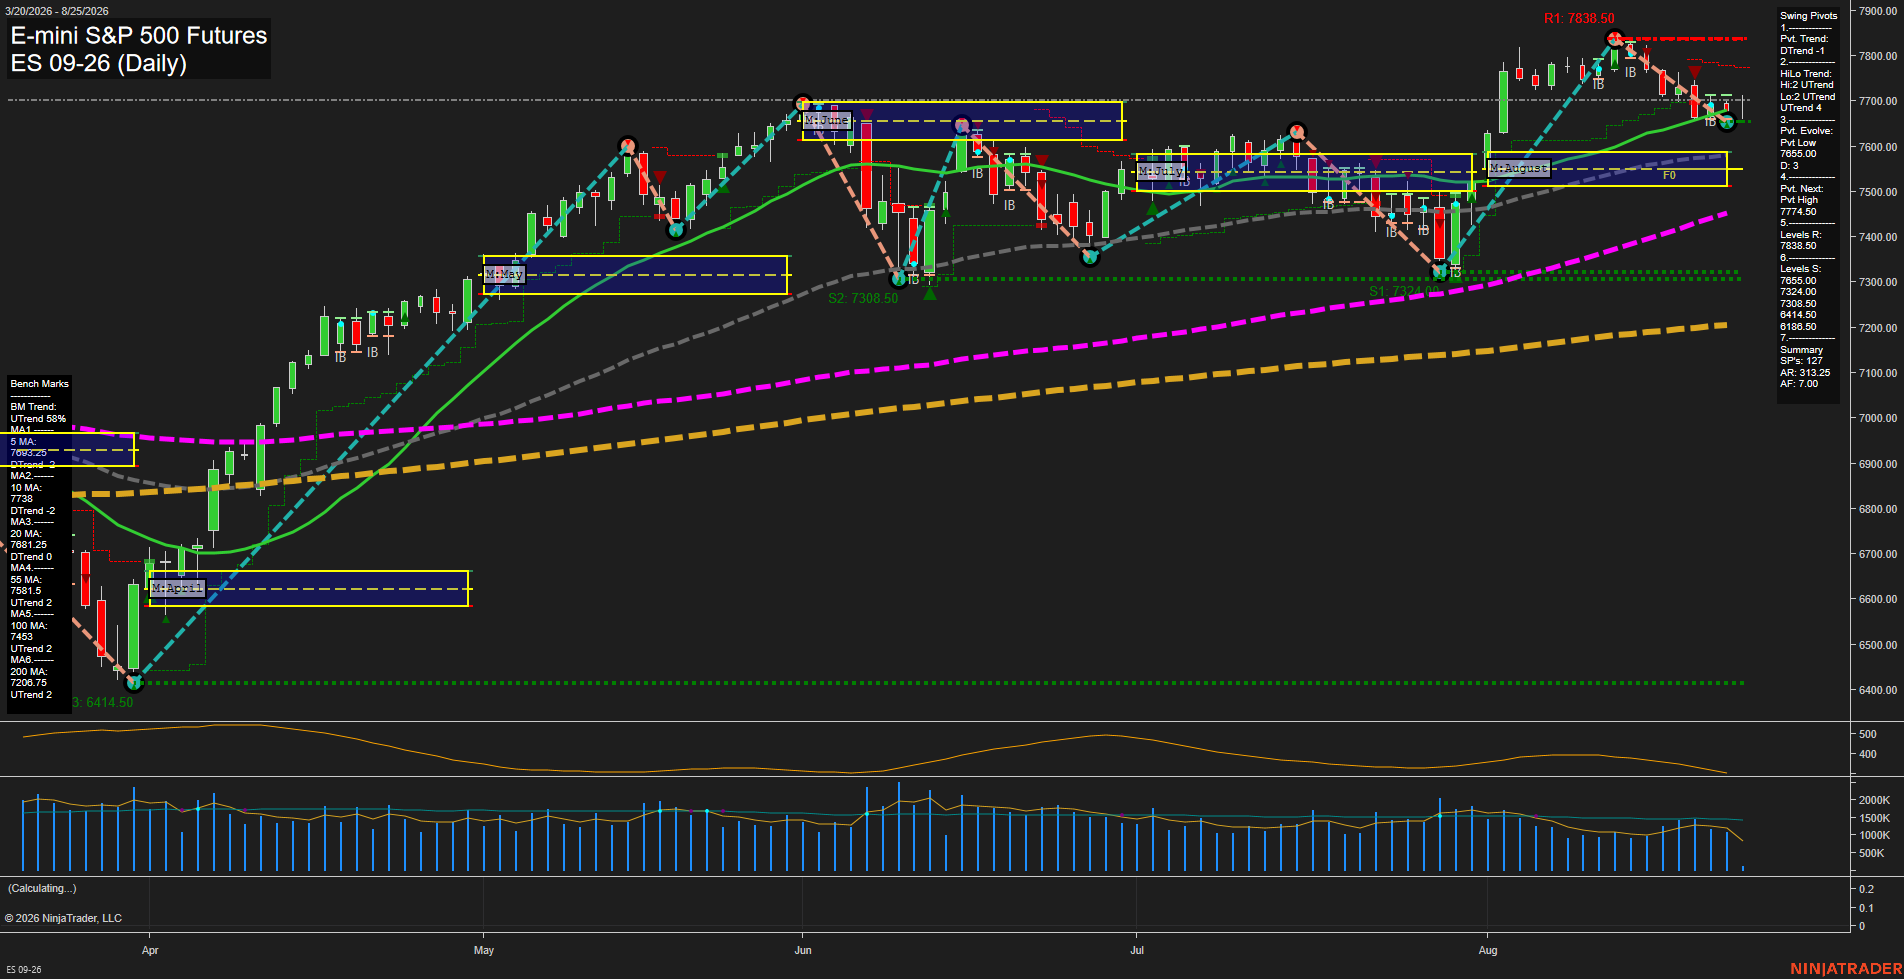
Overall Rating
- Short-Term: Bearish
- Intermediate-Term: Bullish
- Long-Term: Bullish.
Key Insights Summary
Price is consolidating after the August advance and remains above the weekly, monthly, and yearly F0% levels, preserving the broader rising structure. Short-term conditions have softened: the active pivot trend is down, price is below the 5-, 10-, and 20-day benchmarks, and recent short signals align with a pullback phase. The intermediate and long-term structure remains constructive because the HiLo pivot trend is up and price remains above the rising 55-, 100-, and 200-day benchmarks. The 7655.00 pivot low and 7635.00 support area define the nearby pullback zone, while 7747.50 is the next pivot reversal level and 7838.50 remains the major overhead swing resistance.
View charts on: AlphaWebTrader HTF Charts
NQ Daily View
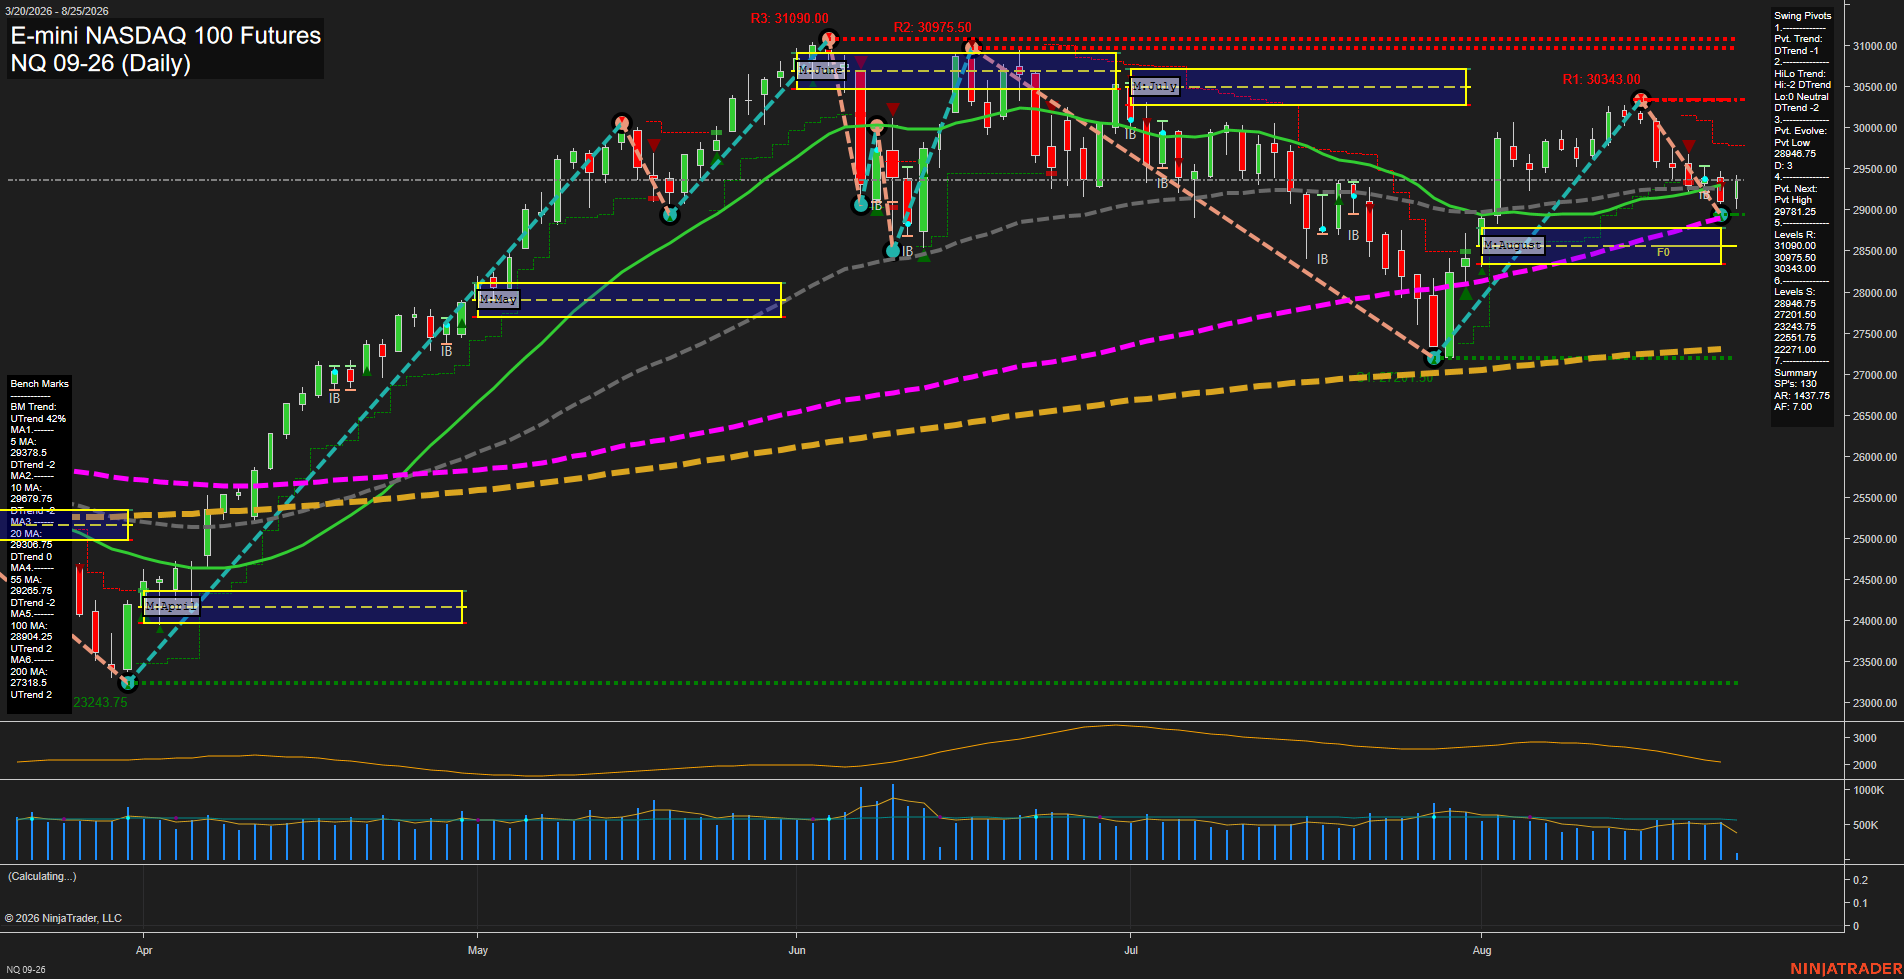
Overall Rating
- Short-Term: Bearish
- Intermediate-Term: Neutral
- Long-Term: Bullish.
Key Insights Summary
Price is consolidating near 29233.5 after a sharp August recovery from the 27201.50 swing low, but the rebound stalled beneath the 30343 resistance zone and has rolled into small, slow-momentum bars. Short-term structure remains bearish: price is below the weekly F0% level and below the declining 5-, 10-, 20-, and 55-day benchmarks, while the current pivot sequence remains a DTrend. Intermediate structure is mixed, with price still above the August monthly F0%/NTZ area but testing the 28946.75 pivot-low support region. The longer-term backdrop remains constructive because price holds above rising 100- and 200-day averages and remains well above the yearly grid midpoint. The chart reflects a countertrend pullback within the larger annual advance, with 30343 followed by 30975.50 and 31090 marking the overhead swing-resistance ladder.
View charts on: AlphaWebTrader HTF Charts
CL Daily View
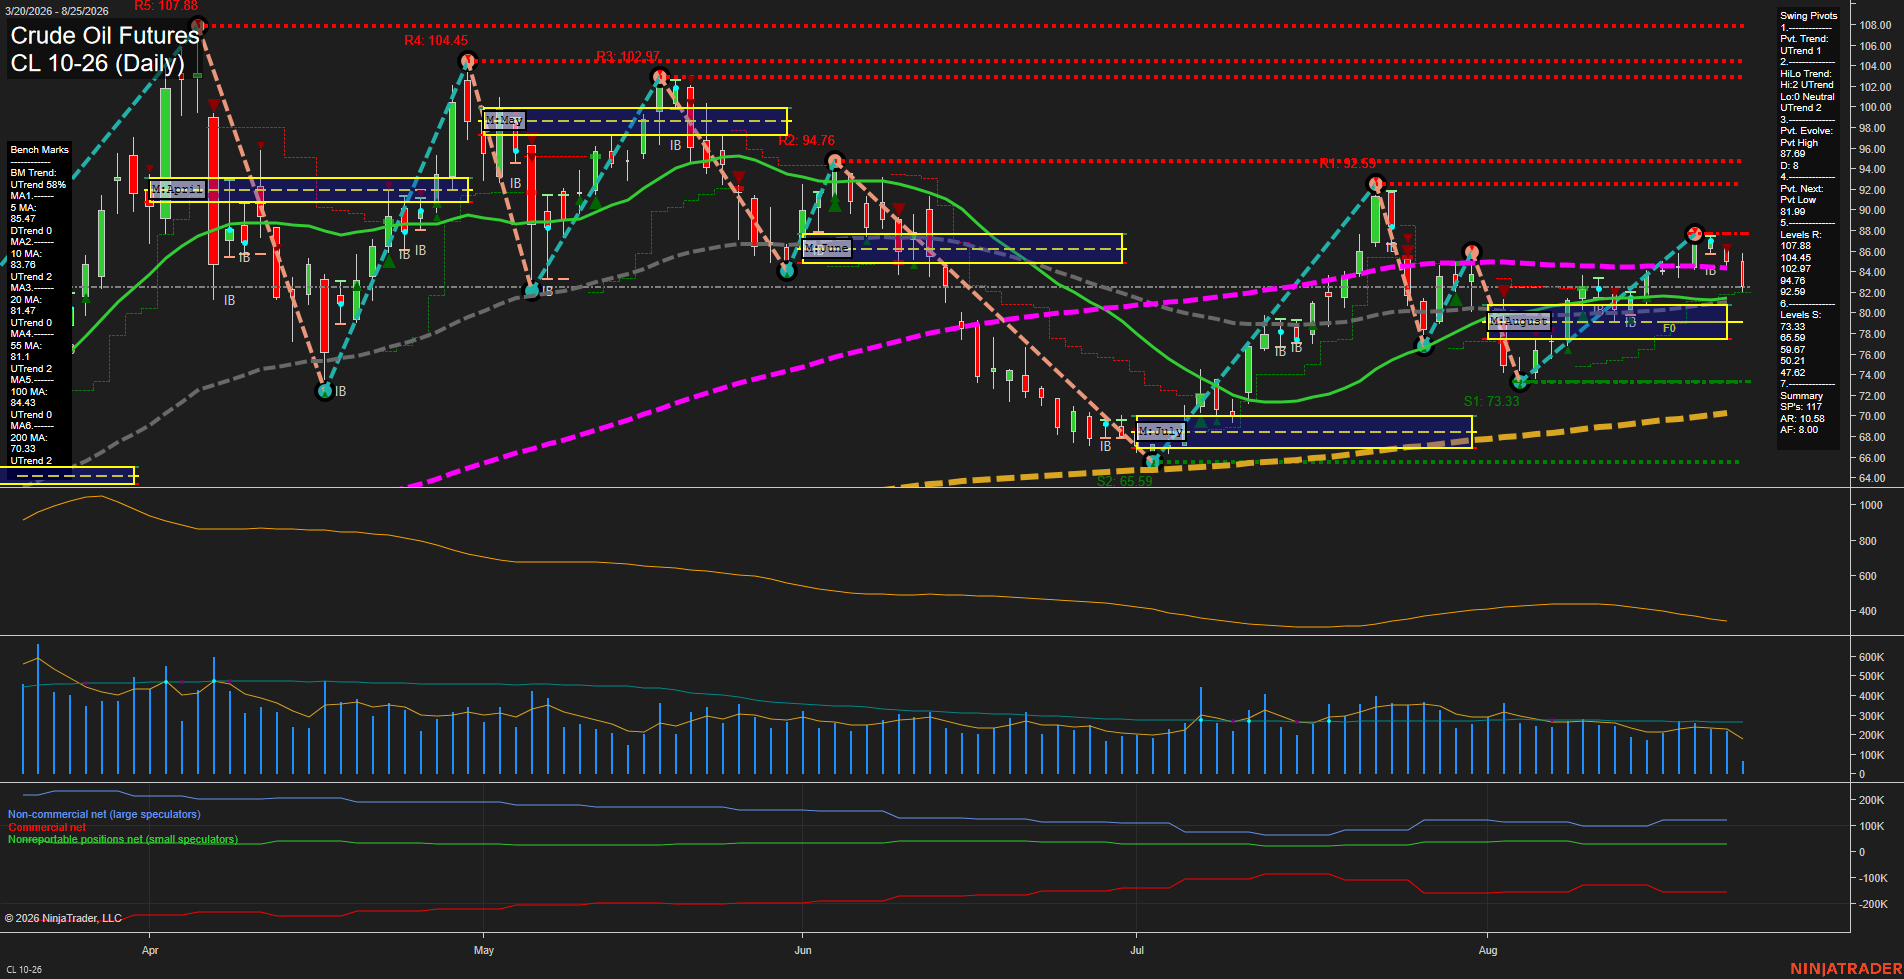
Overall Rating
- Short-Term: Bearish
- Intermediate-Term: Bullish
- Long-Term: Bullish.
Key Insights Summary
CL remains in an intermediate and long-term recovery structure, supported by rising 20, 55, 100, and 200 day benchmarks and UTrend readings in both pivot trend categories. Short-term conditions have softened following rejection beneath the 87.69 pivot-high resistance, with price below the declining 5 day average and below the weekly F0% grid. The recent candles reflect a pullback within the broader advance rather than a confirmed intermediate trend reversal. Price is consolidating above the 10, 20, and 55 day averages, while 81.99 marks the key opposite-pivot reference beneath the current range. Volume has moderated and ATR has contracted from earlier elevated levels, consistent with a choppier consolidation phase after the August rebound.
View charts on: AlphaWebTrader HTF Charts
GC Daily View
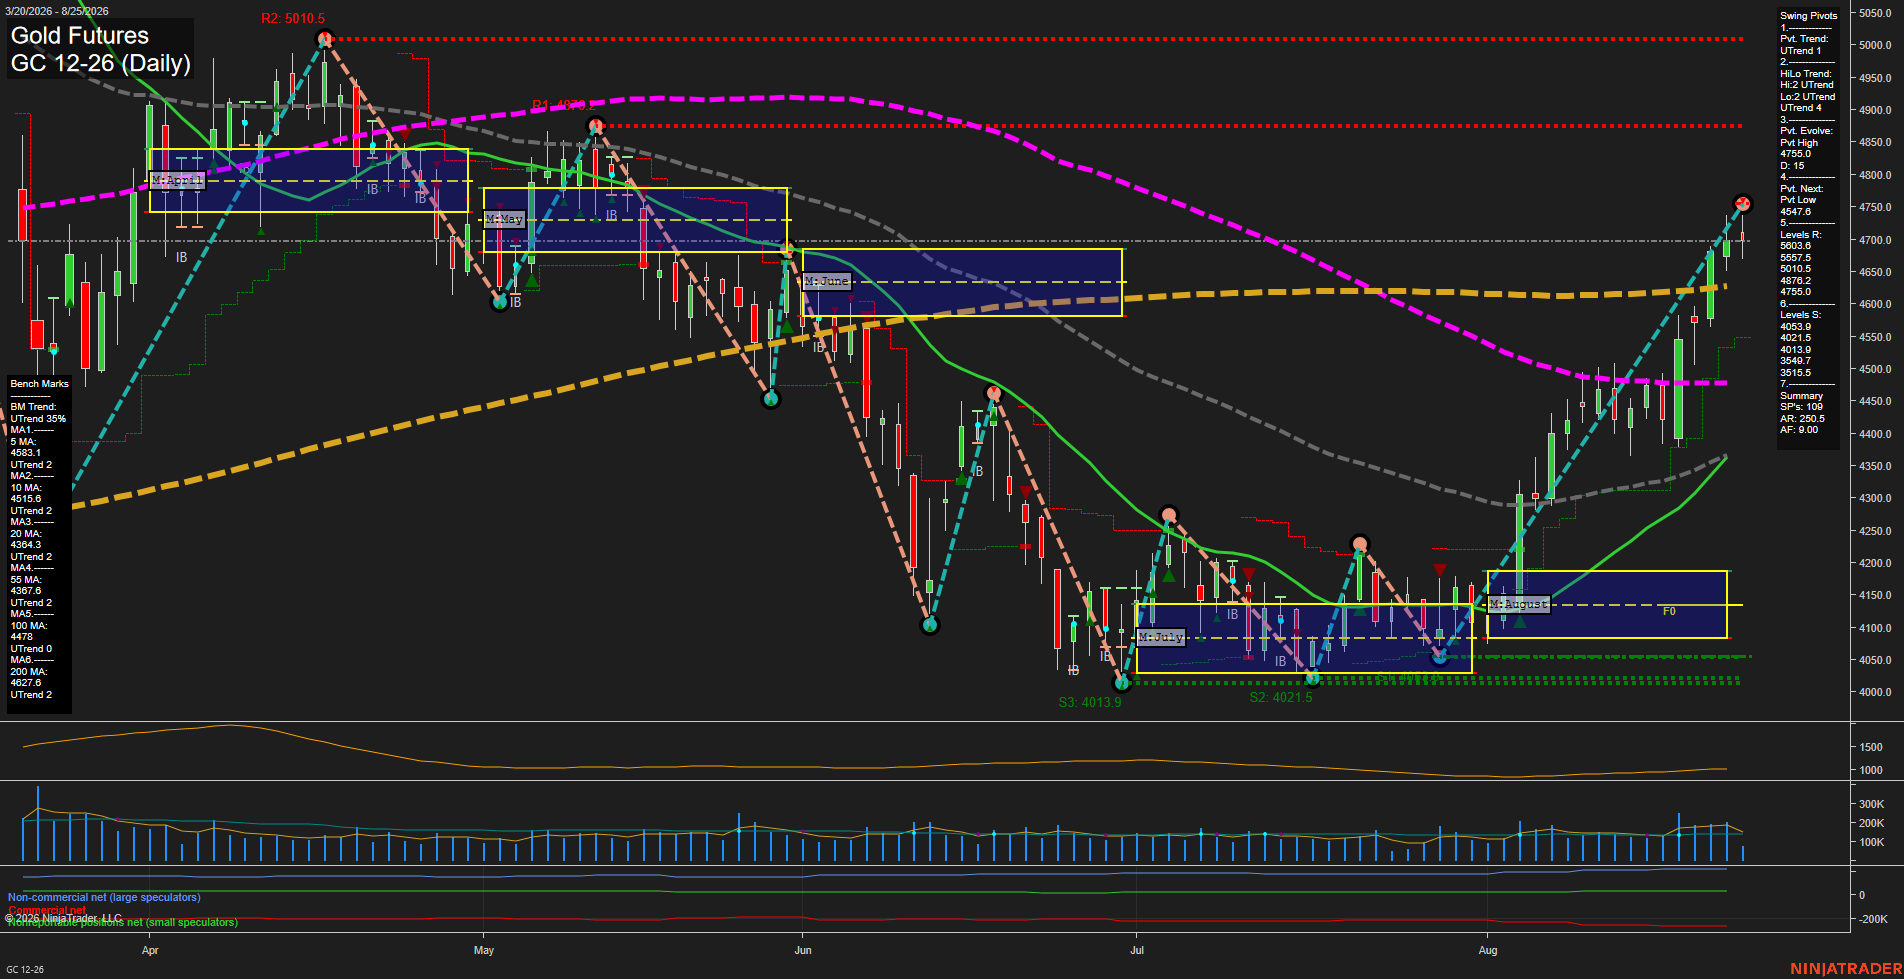
Overall Rating
- Short-Term: Bullish
- Intermediate-Term: Bullish
- Long-Term: Bullish.
Key Insights Summary
Price remains in a strong, fast upside swing following the August breakout from the 4100-area consolidation. The pivot structure is bullish across short- and intermediate-term measures, while price holds above all six rising daily benchmarks. The current pullback from the 4747.5 pivot high is occurring near the 4755 resistance zone, with 4676 identified as the next pivot-low reversal level. The monthly and weekly Fib grids remain positive, although the yearly grid remains below F0%, indicating that the broader recovery is still developing within the longer-term cycle.
View charts on: AlphaWebTrader HTF Charts