U.S. stocks closed mixed as tech and semiconductor weakness offset Dow gains, while Treasury buybacks, fiscal concerns and gold shaped markets.
Fundamentals: U.S. equities ended mixed, with Dow gains offset by declines in technology and semiconductor shares ahead of Nvidia results. Treasury buybacks, long-duration bond liquidity and fiscal concerns drove cross-asset attention as gold neared $4,700. Expanded Iran sanctions, tariff threats, private-credit stress and AI debt concerns added uncertainty.
Technicals: Major U.S. index futures closed with short-term bearish or neutral technical conditions following August volatility and pullbacks from recent highs. ES, NQ, YM, EMD and RTY remain supported by generally bullish intermediate- and long-term structures, while FDAX retains broad strength despite daily consolidation. IBIT, Meta and Amazon gained, while USO, Nvidia and Tesla declined.
After Market Close daily snapshot: market news summary and sentiment, major ETFs, Magnificent 7 analysis, Indices Futures Higher Time Frame Analysis, and E-mini S&P500, Nasdaq 100, NYMEX Crude, Gold Futures Daily Chart analysis.
As of: August 24, 2026 05:00 CT
Market News Summary:
U.S. equities closed mixed as technology weakness offset a Dow gain, while Treasury-market actions, fiscal concerns, gold strength, and Iran-related sanctions shaped cross-asset trading.
Primary Drivers & Risks:
- Primary Driver: Treasury buybacks and fiscal-risk flows
- Primary Risk: AI weakness and Iran sanctions
Tone:
Mixed and cautious, with defensive asset demand.
Stock Market / ETFs / Indices:
The Dow rose while technology and semiconductor declines pulled the S&P 500 and Nasdaq lower ahead of Nvidia results. AI-trade deleveraging, large hyperscaler debt issuance, and concern over hidden leverage remained key pressure points. The S&P 500 retained some bullish commentary, but index trading faced uncertainty from yields, Fed developments, tariffs, and geopolitical headlines.
Geopolitical:
The U.S. outlined expanded sanctions targeting Iran and signaled that countries doing business with Tehran, including China, faced scrutiny. Fresh tariff threats and the sanctions plan added uncertainty to the market backdrop.
Gold / Metals:
Gold advanced toward $4,700 per ounce, reaching a 15-week high as ETF inflows, renewed investment demand, a weaker dollar, Treasury buyback attention, and U.S. fiscal concerns supported the move. Silver and platinum declined as traders took profits, while industrial metals strength supported global mining producers.
Fed / Financials:
Treasury buyback operations and efforts to add long-duration bond liquidity remained central themes as U.S. debt exceeded $40 trillion. Lower Treasury yields were assessed alongside concerns that buybacks reduce Treasury cash rather than resolve bond-market pressures. Private-credit defaults and redemption gates also highlighted financial-stability concerns.
Macro / Other:
Inflation, government borrowing, and competition for capital between Treasury issuance and AI hyperscaler debt were prominent macro themes. Gold and Bitcoin strengthened amid renewed attention to scarce assets and debt sustainability.
Conclusion:
Treasury-market policy actions, fiscal concerns, and gold demand were the main cross-asset drivers. Mixed U.S. equity performance reflected technology and semiconductor weakness against Dow strength.
Iran sanctions and tariff threats added geopolitical uncertainty. AI leverage concerns, private-credit stress, and elevated energy prices remained additional cross-currents.
Market News Sentiment
Market News Articles: 34
- Neutral: 47.06%
- Negative: 29.41%
- Positive: 23.53%
Sentiment Summary: Among 34 market news articles, sentiment is 47% neutral, 29% negative, and 24% positive.
Conclusion: Coverage is predominantly neutral, with negative articles outnumbering positive articles.
GLD,Gold Articles: 16
- Positive: 43.75%
- Neutral: 37.50%
- Negative: 18.75%
Sentiment Summary: GLD/Gold coverage was moderately positive, with 44% positive, 38% neutral, and 19% negative articles across 16 items.
Conclusion: Gold-related news tone was net positive, while neutral coverage remained a substantial portion of the sample.
USO,Oil Articles: 10
- Negative: 60.00%
- Neutral: 30.00%
- Positive: 10.00%
Sentiment Summary: USO and oil coverage is predominantly negative at 60%, with 30% neutral and 10% positive articles.
Conclusion: The oil news tone is negative overall, which may be relevant context for indices futures day traders.
Market Data Snapshot
ETF Snapshot of major stock market ETFs, Mag7, and others as of: August 24, 2026 05:00
Top Movers & Losers
- IBIT 44.64 Bullish 2.20% ▲
- META 559.02 Bullish 1.66% ▲
- AMZN 262.07 Bullish 1.33% ▲
- USO 132.21 Bearish -1.80% ▼
- NVDA 208.48 Bearish -2.91% ▼
- TSLA 348.95 Bearish -3.83% ▼
Major Index ETFs: SPY, QQQ, DIA, IWM, IJH
- DIA 533.65 Bullish 0.27% ▲
- SPY 763.47 Bearish -0.29% ▼
- IWM 297.97 Bearish -0.66% ▼
- IJH 76.20 Bearish -0.74% ▼
- QQQ 706.32 Bearish -1.00% ▼
Mixed index ETF snapshot: DIA was the most bullish mover at +0.27%, while QQQ was the most bearish mover at -1.00%. SPY declined -0.29%, IWM fell -0.66%, and IJH lost -0.74%, indicating broader Bearish pressure outside DIA.
Mag 7 Stocks: AAPL, MSFT, GOOG, AMZN, META, NVDA, TSLA
- META 559.02 Bullish 1.66% ▲
- AMZN 262.07 Bullish 1.33% ▲
- MSFT 487.31 Bullish 0.84% ▲
- GOOG 344.59 Bullish 0.83% ▲
- AAPL 310.34 Bullish 0.32% ▲
- NVDA 208.48 Bearish -2.91% ▼
- TSLA 348.95 Bearish -3.83% ▼
Mixed Mag7 snapshot: META is the most bullish mover at +1.66%, followed by AMZN at +1.33%. MSFT and GOOG are Bullish at +0.84% and +0.83%, while AAPL is modestly Bullish at +0.32%. TSLA is the most bearish mover at -3.83%, with NVDA also Bearish at -2.91%.
Cross-Market ETFs: TLT, GLD, USO, IBIT
- IBIT 44.64 Bullish 2.20% ▲
- GLD 426.69 Bullish 0.79% ▲
- TLT 82.56 Bullish 0.62% ▲
- USO 132.21 Bearish -1.80% ▼
Other ETFs were Mixed: IBIT was the most bullish mover at +2.20%, followed by GLD at +0.79% and TLT at +0.62%. USO was the most bearish mover at -1.80%.
ETF, Mag7, and Cross-Market ETF Insights
Overall Tone
Mixed conditions prevailed, with selective Bullish leadership in several Mag7 names and IBIT while broad equity ETFs and energy were Bearish.
Equity ETFs and Mag7:
Major Index ETFs were Bearish overall: DIA was marginally Bullish at +0.27%, while SPY fell -0.29%, IWM declined -0.66%, IJH lost -0.74%, and QQQ was down -1.00%. Mag7 performance was selective, led by META at +1.66%, the most bullish equity mover, followed by AMZN at +1.33%; TSLA was the most bearish mover at -3.83%, with NVDA also Bearish at -2.91%. AAPL, MSFT, and GOOG remained Bullish at +0.32%, +0.84%, and +0.83%, respectively, showing selective rather than broad equity alignment.
Cross-Market ETFs:
Cross-market ETFs were Mixed: IBIT was the most bullish mover at +2.20%, while GLD gained +0.79% and TLT added +0.62%. USO was the most bearish mover at -1.80%, diverging from the strength in Bitcoin, gold, and bonds. The Bullish moves in GLD and TLT coincided with Bearish broad equity ETF performance, while IBIT showed distinct Bullish leadership.
Futures Indices – Higher Time Frame Analysis
Summary of the current state of US Indices Futures based on higher time-frame (HTF) technical analysis as of: 2026-08-24: 17:00 CT.
US Indices Futures
- ES YSFG/MSFG above F0%, WSFG below F0%; benchmarks rising; UTrend HTF pivots, DTrend short-term; 7838.50 resistance, 7667.75/7657.75 support.
- NQ YSFG/MSFG above F0%, WSFG below F0%; longer benchmarks rising; DTrend daily pivots; 29986.25 reversal threshold, 29116.75/27201.5 support.
- YM YSFG/MSFG above F0%, WSFG below F0%; six weekly benchmarks rising; short-term pullback; 54884 resistance, 53686 threshold, 52810 support.
- EMD YSFG/MSFG above F0%, WSFG aligned upward; longer benchmarks rising; UTrend weekly, DTrend daily; 3941.7 resistance, 3819.8/3804.7 support.
- RTY YSFG/MSFG above F0%, WSFG below F0%; benchmarks rising; UTrend HTF, DTrend daily; 3077.0 resistance, 2993.2 support.
- FDAX YSFG/MSFG above F0%, WSFG recovered neutral grid; benchmarks rising; UTrend weekly, DTrend daily; 26665 resistance, 26130/25965 support.
Overall State
- Short-Term: Bearish
- Intermediate-Term: Bullish
- Long-Term: Bullish
Conclusion
ES, NQ, YM, EMD, and RTY show short-term retracements or consolidation beneath WSFG F0% references and recent pivot highs, while FDAX weekly momentum remains upward. Across the group, YSFG and MSFG alignment is above F0%, longer benchmarks are rising, and intermediate-to-long-term pivot structures remain upward. Near-term direction is governed by stated pivot support and resistance boundaries.
Note: Intra-day counter-trend pullbacks or retracements may occur, HTF is context for informational usage and market structure. Glossary: Session Fib Grids periods of YSFG:’Yearly’, MSFG:’Monthly’, WSFG:’Weekly’
For full details visit: AlphaWebTrader Technicals
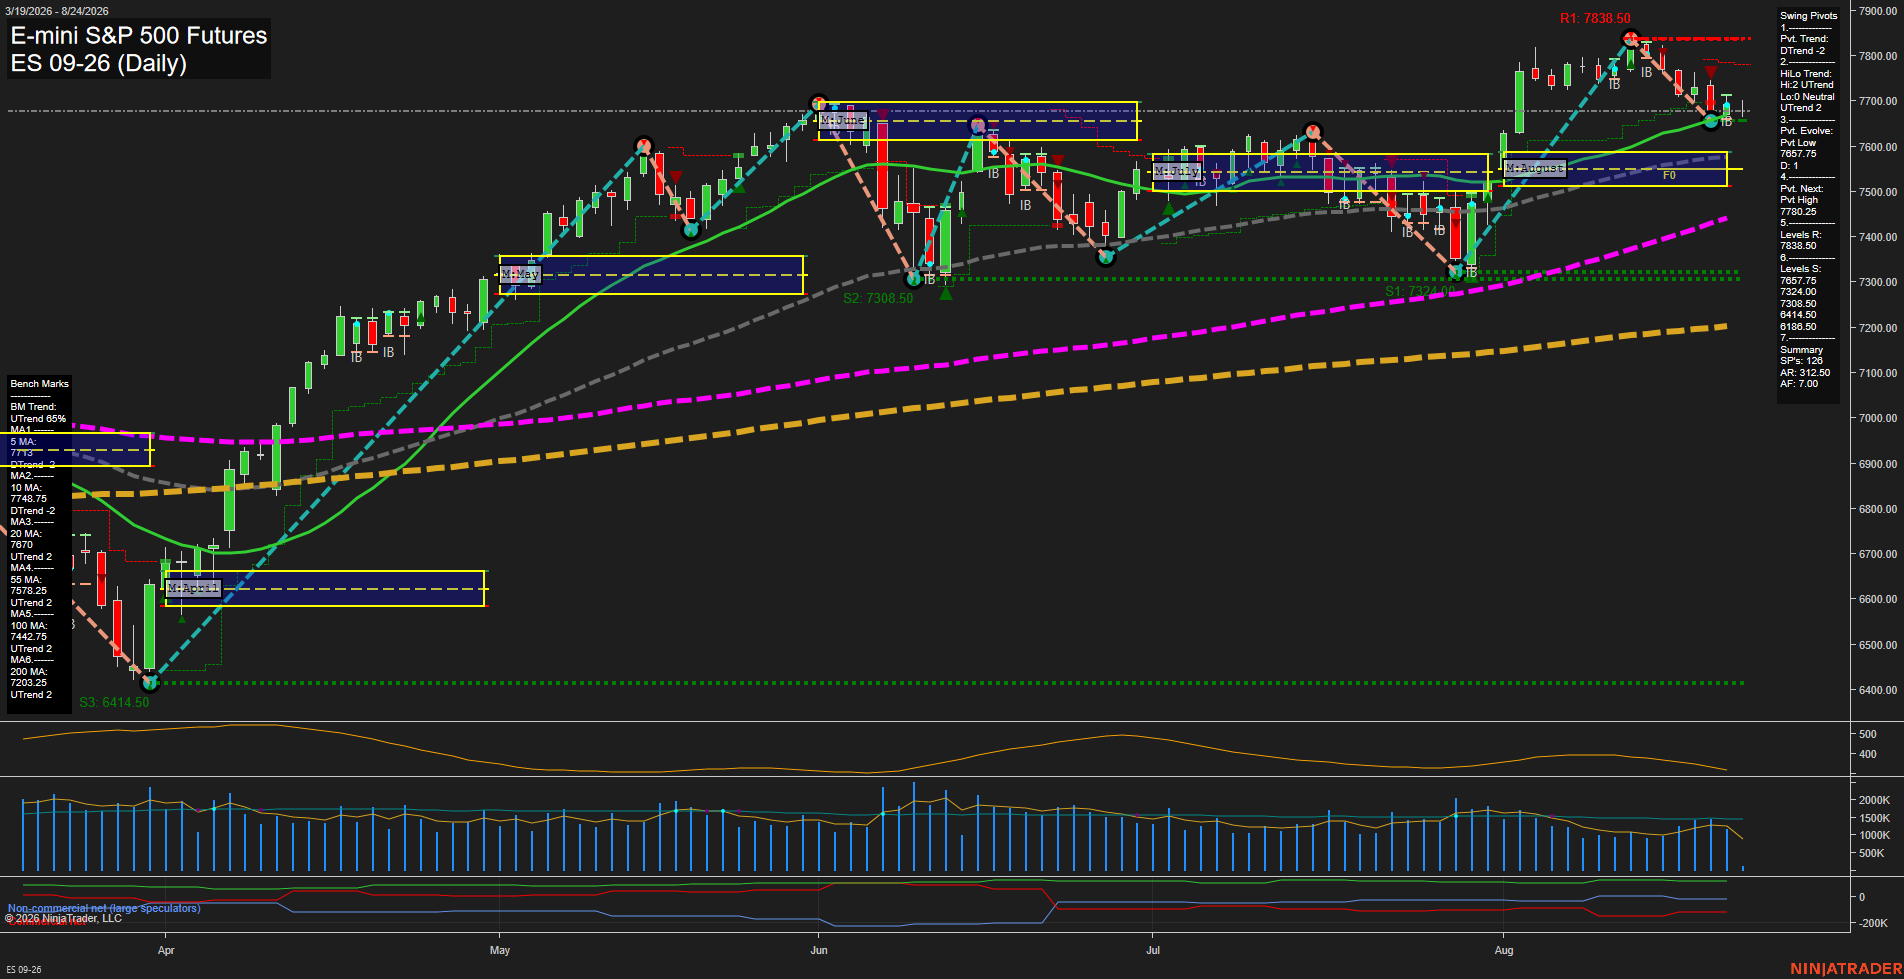
ES Daily View
Overall Rating
- Short-Term: Bearish
- Intermediate-Term: Bullish
- Long-Term: Bullish.
Key Insights Summary
The daily structure reflects a short-term pullback within a broader intermediate- and long-term uptrend. Price is below the weekly F0%/NTZ reference and beneath the declining 5-day average, while the pivot trend remains DTrend after rejection from the 7837.75 resistance area. The 7667.75 pivot-low area and 7657.75 support define the immediate downside test zone. Intermediate and long-term alignment remains constructive, with price above the rising 20-, 55-, 100-, and 200-day benchmarks and above the monthly and yearly fib-grid references. Recent small bars and slowing momentum indicate consolidation following the August volatility expansion rather than a broad trend reversal.
View charts on: AlphaWebTrader HTF Charts
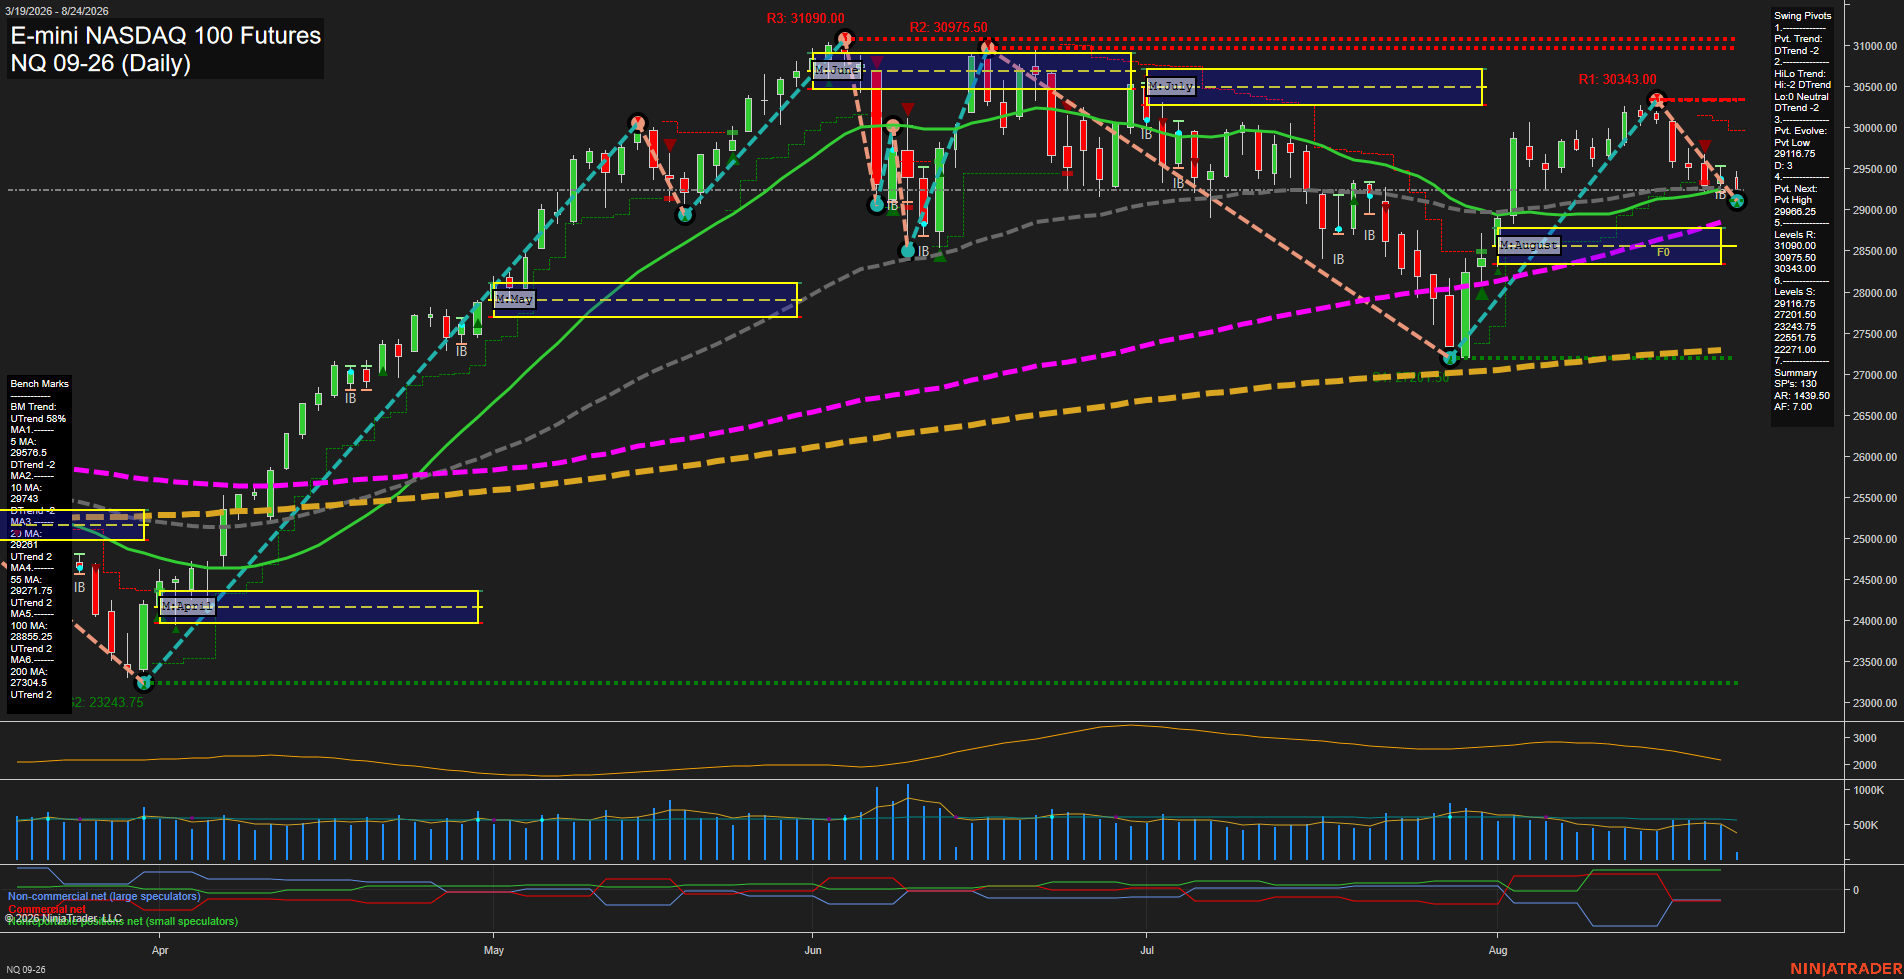
NQ Daily View
Overall Rating
- Short-Term: Bearish
- Intermediate-Term: Neutral
- Long-Term: Bullish.
Key Insights Summary
Price has retraced from the August swing high and is trading below the weekly F0% area, the short-term moving averages, and the 20/55-day benchmarks. The active pivot structure remains DTrend, with 29116.75 defining the nearby pivot-low support and 29986.25 the reversal threshold for a new pivot high. The August monthly grid and yearly grid remain positive, while the rising 100-day and 200-day averages preserve the broader bullish trend. This creates a short-term countertrend decline within a still constructive long-term structure, with compressed recent bar size and slower momentum indicating consolidation near support following the selloff.
View charts on: AlphaWebTrader HTF Charts
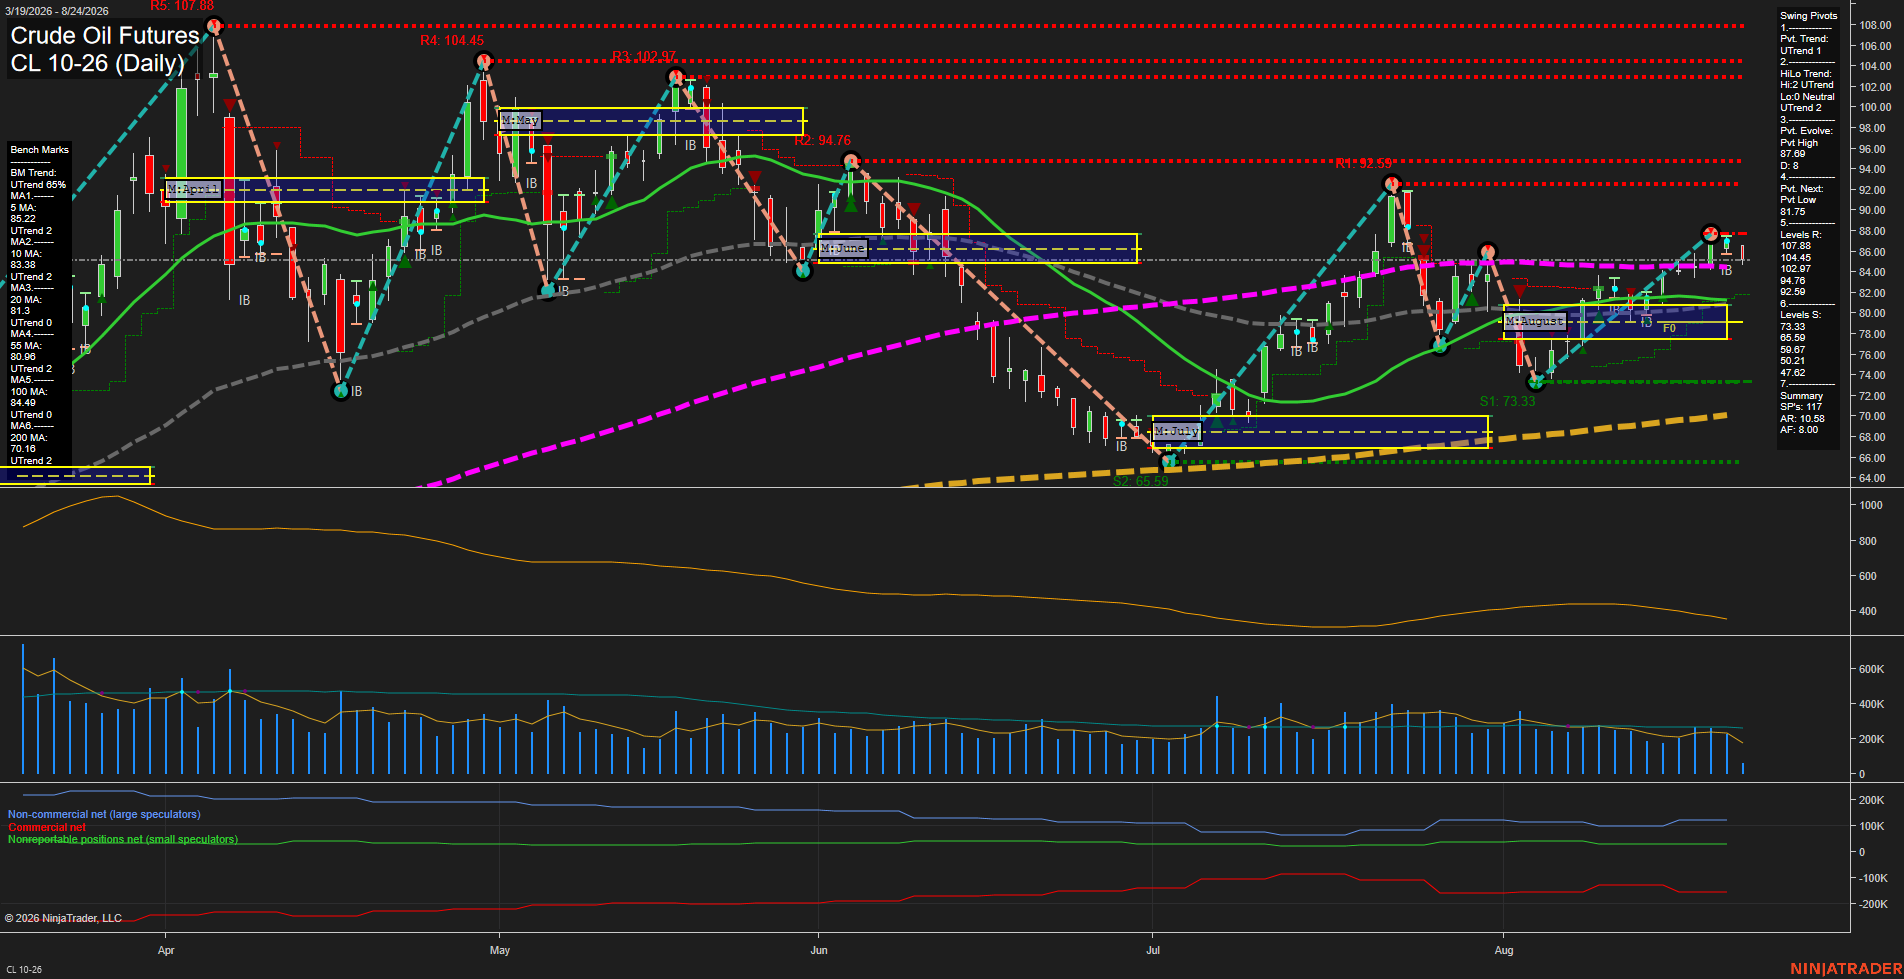
CL Daily View
Overall Rating
- Short-Term: Bullish
- Intermediate-Term: Bullish
- Long-Term: Bullish.
Key Insights Summary
Crude maintains a broader higher-low recovery structure from the July 65.59 pivot, with price holding above all major daily benchmarks and the monthly and yearly Fib-grid trends remaining positive. Short-term action is consolidating beneath the 87.69 pivot high and near the 92.59 resistance zone, while the weekly grid remains below its F0% level, reflecting a countertrend pullback within the larger advance. Small recent bars and slowing momentum show compression after the August rally; the 81.75 pivot-reversal level and clustered 20-, 55-, and 100-day averages define the key underlying support structure.
View charts on: AlphaWebTrader HTF Charts
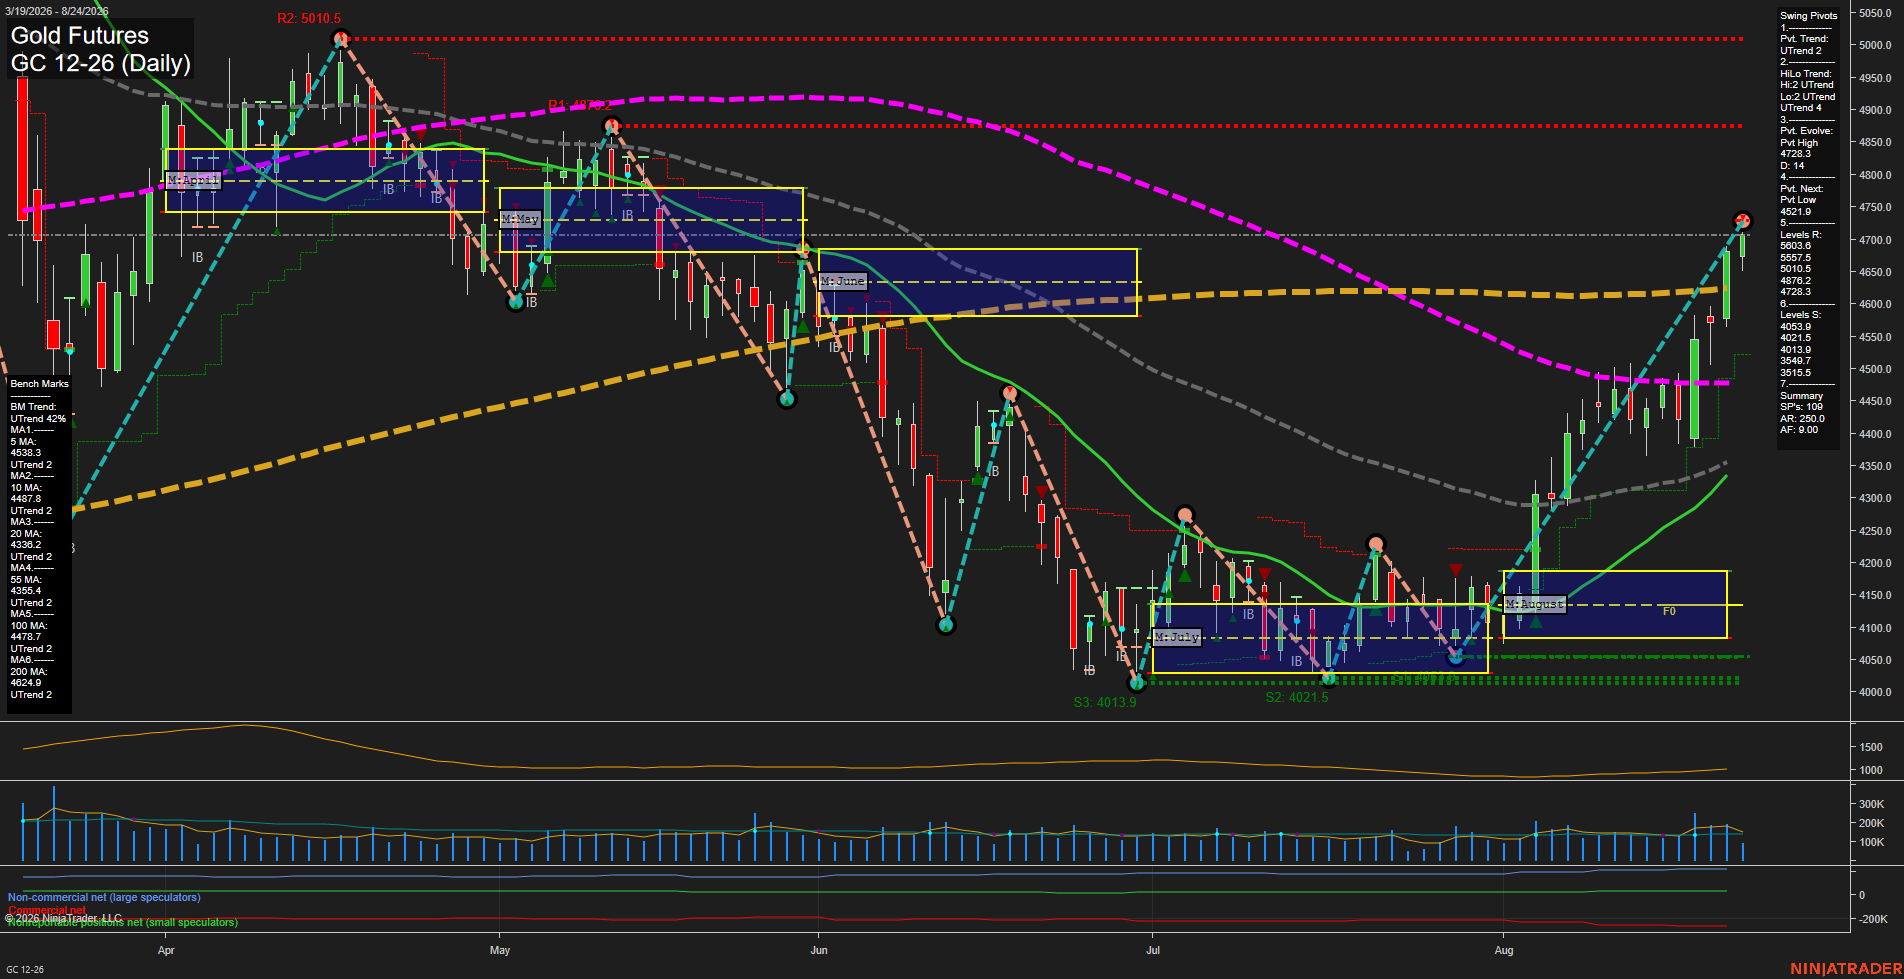
GC Daily View
Overall Rating
- Short-Term: Bullish
- Intermediate-Term: Bullish
- Long-Term: Bullish.
Key Insights Summary
Gold has transitioned from the July base near 4,000 into a fast August upside expansion, producing higher swing lows and a new evolving pivot high at 4,728.3. Price is above every daily benchmark, while the weekly and monthly fib grids remain positive, confirming broad multi-timeframe upside alignment. The current advance is extended above the monthly NTZ and is testing the 4,728.3 pivot-high area; 4,872.2 is the next visible swing-resistance reference. The yearly fib-grid reading remains below its F0% and down, representing the remaining longer-cycle countertrend condition despite bullish daily moving-average structure.
View charts on: AlphaWebTrader HTF Charts