NYSE pre-market tracks mixed ETF moves, rising Treasury yields, tech pressure, oil supply risks and futures pullbacks within broader bullish trends.
Fundamentals: Elevated long-term Treasury yields and a technology-led equity pullback set a cautious tone for the NYSE pre-market session. Semiconductor weakness and pressure on rate-sensitive sectors remain in focus, while oil is supported by Strait of Hormuz uncertainty and reduced Russian export flows. Markets are also monitoring crude inventories, Fed minutes, retailer earnings and China growth signals.
Technicals: Pre-market conditions show mixed ETF performance, with gains in AAPL, IBIT and TLT offset by declines in GLD, NVDA and META. Futures technical reviews for ES, NQ, YM, EMD, RTY and FDAX identify short-term bearish pullbacks following recent resistance tests, while intermediate- and long-term trends remain broadly bullish above key moving-average support levels.
Pre-Market Trading 360° view Market Radar of: holidays, earnings, eco-news, market-news summary, news sentiment, prior session major ETFs, MAG7, Higher Time Frame Analysis Indices Futures Summary, and E-mini S&P500, Nasdaq 100, NYMEX Crude, Gold Futures Daily Chart analysis.
As of: August 19, 2026 07:16 CT
EcoNews Radar U.S. Events
| Day | Time | Impact | Event |
|---|---|---|---|
| Wed | 10:30 | Low | Crude Oil Inventories |
| Wed | 14:00 | High | FOMC Meeting Minutes |
| Thu | 08:30 | Medium | Philly Fed Manufacturing Index |
| Thu | 08:30 | Medium | Unemployment Claims |
EcoNews Summary
Wednesday’s FOMC Meeting Minutes are the only qualifying high-impact EcoNews event listed. The release provides detail on Federal Reserve policy discussions and often concentrates index futures attention around the 14:00 release time.
Event Notes:
- Wednesday 14:00 FOMC Meeting Minutes: A detailed record of the Federal Reserve’s most recent policy meeting, covering views on inflation, employment, economic conditions, and interest-rate policy. Traders monitor the language for changes in the policy stance and risk assessment.
Conclusion:
The single most important event is Wednesday’s 14:00 FOMC Meeting Minutes. Market momentum and volume often slow ahead of major events such as FOMC, with increased volatility at release time. No qualifying medium-impact energy events are listed.
For full details visit: Forex Factory EcoNews
Market News Summary:
Global equity futures are muted after a technology-led selloff, while elevated long-term yields and energy-supply disruptions remain central market cross-currents.
Primary Drivers & Risks:
- Primary Driver: Global bond selloff and high yields
- Primary Risk: AI leverage under rising rates
Tone:
Cautious, with rate pressure weighing on risk assets.
Stock Market / ETFs / Indices:
Major U.S. indexes fell Tuesday as semiconductor weakness weighed on equities, and Japanese stocks dropped 2.7% in early trading amid the broader bond-market rout. Early U.S. futures were described as lower after Asian losses, then muted ahead of retail earnings and Fed minutes. Consumer Staples also recorded a sharp one-day reversal, while high-yield dividend stocks and REITs face greater competition from government-bond yields.
Geopolitical:
U.S.-China leader meetings remain focused on maintaining a trade truce, with low expectations for a substantive September outcome. Uncertainty surrounding shipping through the Strait of Hormuz remains a key energy-market concern.
Oil / Energy:
Oil extended gains for a fourth session on concerns over Hormuz exports and broader supply disruptions. Russian western-port exports ran 15% below the initial August loading plan following disruptions at Novorossiysk, while the U.S. Strategic Petroleum Reserve was reported at its lowest level since 1983. Natural-gas supply remains comfortable because of ample U.S. production.
Gold / Metals:
Gold recovered in Asian trading on easing rate-hike expectations and physical demand, though elevated Treasury yields remain a restraint. Commentary highlighted gold’s distinct supply-demand profile, diversification role, and resilience relative to other commodities; traders are focused on Fed minutes and key technical levels.
Fed / Financials:
Long-term Treasury yields reached multi-decade highs as investors demand greater compensation amid rising U.S. debt, projected deficits, and competition from overseas bonds. The global bond selloff has pressured equity valuations, though softer CPI and flat PPI readings have reduced implied cross-asset and interest-rate volatility. Markets await Fed meeting minutes for additional policy context.
Macro / Other:
China’s economic concerns were underscored by Moutai’s rare first-half profit decline. Separately, recent U.S.-Japanese yen intervention has shifted attention toward the Swiss franc as a carry-trade funding currency.
Conclusion:
Elevated global bond yields remain the principal market driver, pressuring equities and rate-sensitive sectors. Semiconductor weakness has added to index-level downside pressure.
Hormuz and Russian export disruptions support oil, while high yields create a counterweight for gold. Fed minutes, retailer earnings, China-related growth signals, and AI-sector leverage remain active cross-currents.
Market News Sentiment
Market News Articles: 36
- Negative: 44.44%
- Neutral: 36.11%
- Positive: 19.44%
Sentiment Summary: Market news sentiment is mixed but tilted negative, with 44% negative, 36% neutral, and 19% positive coverage across 36 articles.
Conclusion: Indices futures day traders are facing a predominantly cautious news backdrop, with negative coverage exceeding positive coverage.
GLD,Gold Articles: 12
- Positive: 41.67%
- Negative: 41.67%
- Neutral: 16.67%
Sentiment Summary: GLD/Gold coverage is evenly split, with 42% positive, 42% negative, and 17% neutral sentiment across 12 articles.
Conclusion: Gold-related news presents a balanced sentiment backdrop for indices futures day traders, with no directional consensus in coverage.
USO,Oil Articles: 7
- Negative: 57.14%
- Positive: 28.57%
- Neutral: 14.29%
Sentiment Summary: USO/Oil coverage is predominantly negative at 57%, with 29% positive and 14% neutral across 7 articles.
Conclusion: Oil-related news tone is negative overall, which may be relevant to energy-sensitive index futures sentiment.
Market Data Snapshot
ETF Snapshot of major stock market ETFs, Mag7, and others as of: August 19, 2026 07:16
Top Movers & Losers
- AAPL 310.03 Bullish 1.45% ▲
- IBIT 36.60 Bullish 0.49% ▲
- TLT 81.66 Bullish 0.38% ▲
- GLD 398.55 Bearish -1.71% ▼
- NVDA 219.74 Bearish -2.34% ▼
- META 543.67 Bearish -4.45% ▼
Major Index ETFs: SPY, QQQ, DIA, IWM, IJH
- DIA 532.91 Bearish -0.24% ▼
- SPY 767.45 Bearish -0.68% ▼
- IWM 300.23 Bearish -1.26% ▼
- IJH 77.24 Bearish -1.58% ▼
- QQQ 717.51 Bearish -1.69% ▼
Major index ETFs are Bearish across the group: QQQ is the most bearish mover at -1.69%, followed by IJH at -1.58% and IWM at -1.26%. SPY is down -0.68%, while DIA is the least negative mover at -0.24%.
Mag 7 Stocks: AAPL, MSFT, GOOG, AMZN, META, NVDA, TSLA
- AAPL 310.03 Bullish 1.45% ▲
- MSFT 481.63 Bullish 0.27% ▲
- GOOG 341.28 Bearish -0.05% ▼
- AMZN 259.45 Bearish -0.71% ▼
- TSLA 336.87 Bearish -0.72% ▼
- NVDA 219.74 Bearish -2.34% ▼
- META 543.67 Bearish -4.45% ▼
Mixed Mag7 snapshot: AAPL is the most bullish mover at +1.45%, followed by MSFT at +0.27%. GOOG is marginally Bearish at -0.05%. META is the most bearish mover at -4.45%, with NVDA -2.34%, TSLA -0.72%, and AMZN -0.71% also Bearish.
Cross-Market ETFs: TLT, GLD, USO, IBIT
- IBIT 36.60 Bullish 0.49% ▲
- TLT 81.66 Bullish 0.38% ▲
- USO 130.66 Bullish 0.28% ▲
- GLD 398.55 Bearish -1.71% ▼
Mixed cross-market context: IBIT is the most bullish mover at +0.49%, followed by TLT at +0.38% and USO at +0.28%. GLD is the most bearish mover, down -1.71%.
ETF, Mag7, and Cross-Market ETF Insights
Overall Tone
Bearish overall, with broad equity weakness led by growth and selective Bullish support from rates, oil, and bitcoin exposure.
Equity ETFs and Mag7:
Major Index ETFs were Bearish across the board: QQQ was the most bearish at -1.69%, followed by IJH at -1.58% and IWM at -1.26%, while DIA was the least negative mover at -0.24%. SPY fell -0.68%, indicating weakness beyond the largest industrial names. Mag7 performance was selective: AAPL was the most bullish mover at +1.45%, MSFT gained +0.27%, and GOOG was marginally lower at -0.05%; META was the most bearish mover at -4.45%, with NVDA down -2.34%, TSLA down -0.72%, and AMZN down -0.71%.
Cross-Market ETFs:
Cross-market ETFs were Mixed, diverging from the Bearish equity ETF tone. IBIT was the most bullish mover at +0.49%, while TLT rose +0.38% and USO gained +0.28%. GLD was the most bearish mover at -1.71%, showing weakness in gold despite gains in bonds, oil, and bitcoin exposure.
Futures Indices – Higher Time Frame Analysis
Summary of the current state of US Indices Futures based on higher time-frame (HTF) technical analysis as of: 2026-08-19: 07:16 CT.
US Indices Futures
- ES YSFG/MSFG above F0%, WSFG down; benchmarks rising, 7838.50 resistance, 7697.00 pivot support; short-term retracement within UTrend.
- NQ YSFG/MSFG above F0%, WSFG bearish; benchmarks rising, 30343 pivot resistance, 29339 pivot-next, 29189–29257 support; recovery remains countertrend.
- YM YSFG/MSFG above F0%, WSFG below F0%; benchmarks rising, 54884 resistance, 53381 support, 52430–52442 pivot support; short-term downswing.
- EMD YSFG/MSFG above F0%, WSFG below F0%; benchmarks rising, 3947.7 resistance, 3835.7 pivot-next, 3730.5–3724.0 support; short-term pullback.
- RTY YSFG/MSFG above F0%, WSFG below F0%; benchmarks rising, 3079.9 resistance, 3006.9 pivot-next, 3002.2 benchmark support; corrective momentum active.
- FDAX YSFG/MSFG above F0%, WSFG down; benchmarks rising, 26665 resistance, 26115 swing support, 25113 pivot reversal; DTrend short-term correction.
Overall State
- Short-Term: Bearish
- Intermediate-Term: Bullish
- Long-Term: Bullish
Conclusion
All six indices retain aligned intermediate- and long-term benchmark structures, with YSFG/MSFG context above F0% where specified. WSFG weakness, short signals, and rejection from recent pivot highs correlate with broad short-term pullbacks. Nearby pivot and benchmark supports define the current retracement structure beneath overhead swing resistance.
Note: Intra-day counter-trend pullbacks or retracements may occur, HTF is context for informational usage and market structure. Glossary: Session Fib Grids periods of YSFG:’Yearly’, MSFG:’Monthly’, WSFG:’Weekly’
For full details visit: AlphaWebTrader Technicals
ES Daily View
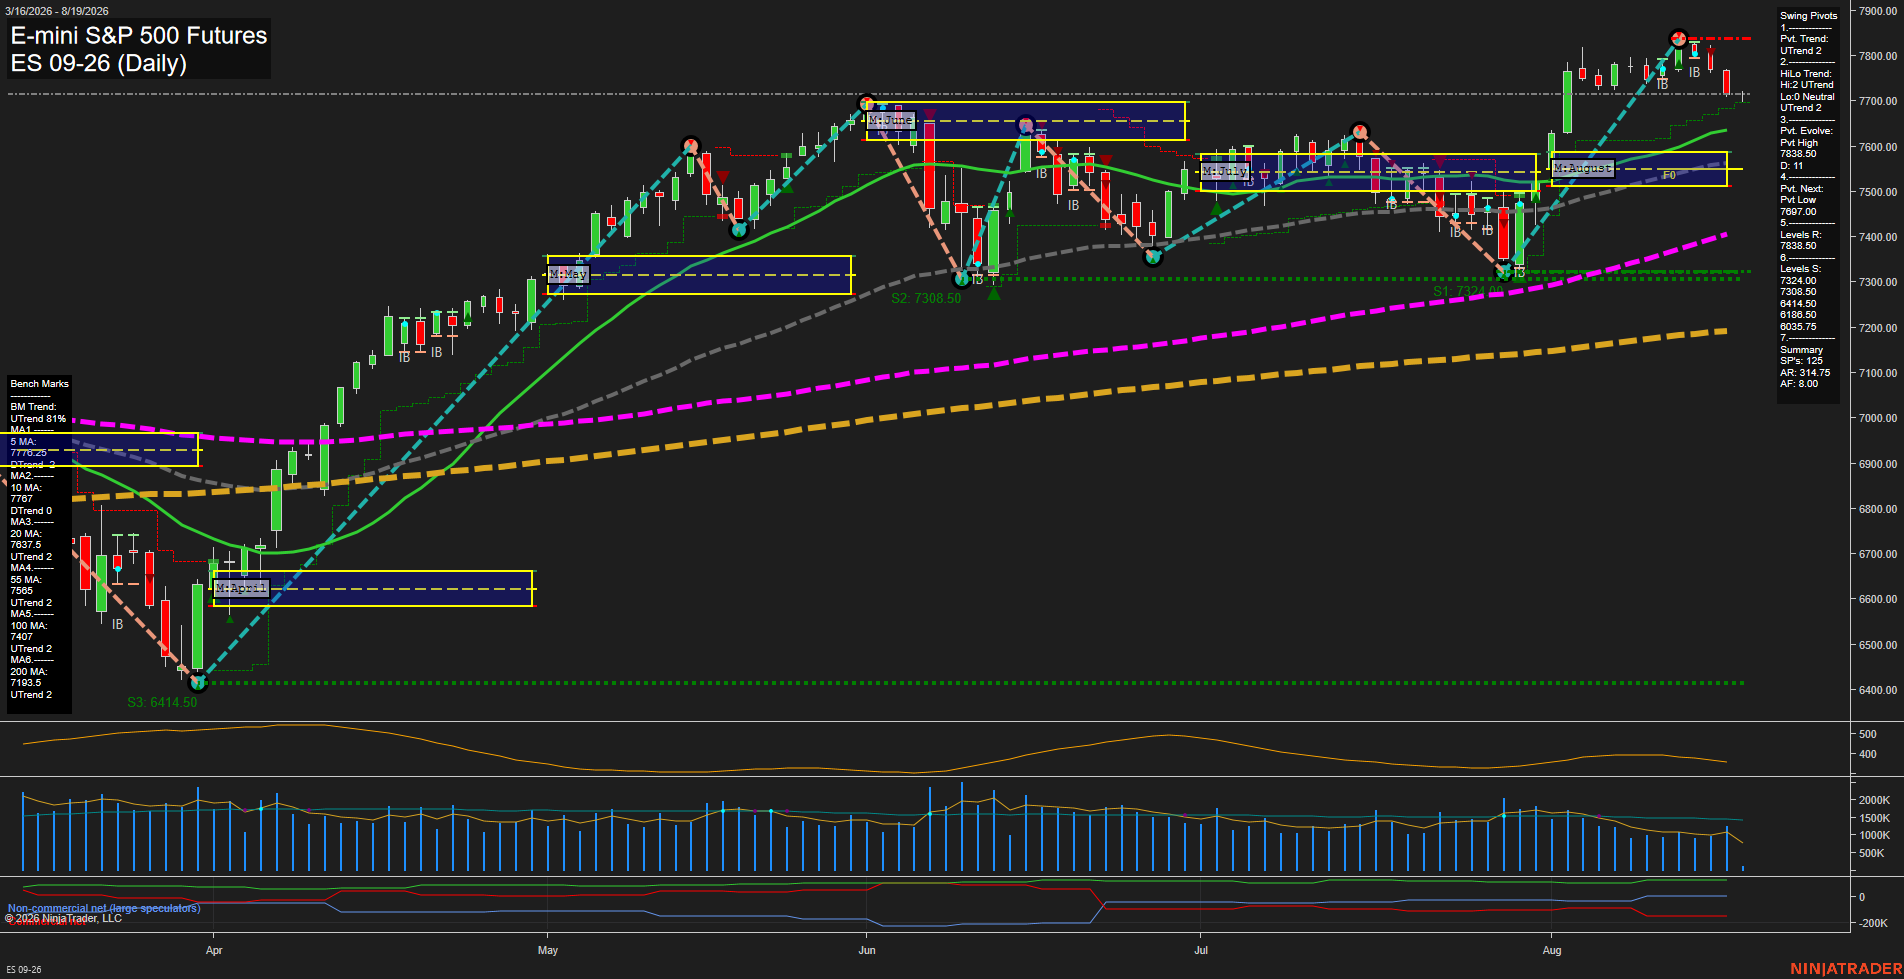
Overall Rating
- Short-Term: Bearish
- Intermediate-Term: Bullish
- Long-Term: Bullish.
Key Insights Summary
The daily structure remains bullish on the intermediate and long-term time frames, with price above the rising 20, 55, 100, and 200 day benchmarks and both pivot trend measures still in UTrend. Short-term action has shifted into a fast downside retracement from the 7838.50 pivot high, reflected by price trading below the 5 and 10 day averages, a weekly Fib Grid position below F0%, and concurrent short-term short signals. The 7697.00 pivot-next level defines the nearby reversal threshold, while 7838.50 remains the dominant overhead swing resistance. August price remains above the monthly F0% area, framing the current decline as a counter-trend pullback within the broader advance unless the intermediate support structure weakens materially.
View charts on: AlphaWebTrader HTF Charts
NQ Daily View
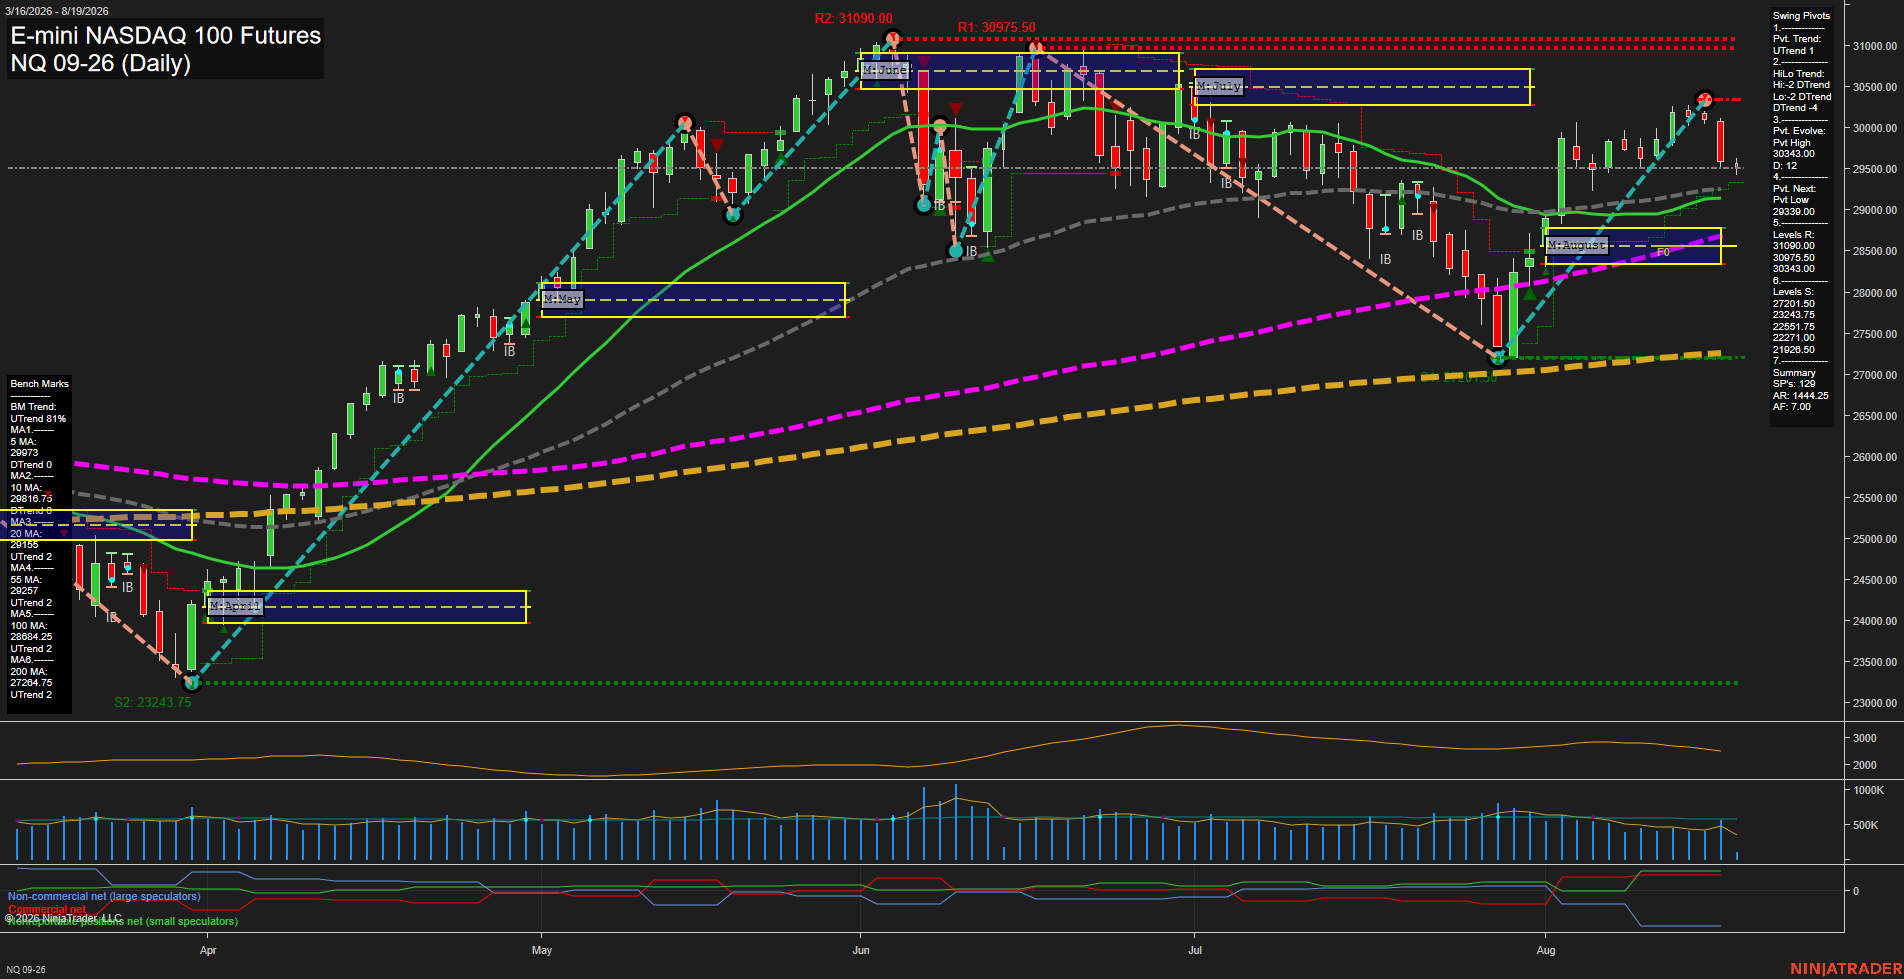
Overall Rating
- Short-Term: Bearish
- Intermediate-Term: Bullish
- Long-Term: Bullish.
Key Insights Summary
The daily structure reflects a sharp countertrend pullback from the 30103 pivot high, with price below the weekly F0% level, below the 5 and 10 day benchmarks, and a short-term downside signal active. The 29339 pivot-next level is the immediate structural reference after the large bearish bar. Intermediate and long-term structure remains constructive because price holds above the August monthly F0% region and the rising 20, 55, 100, and 200 day benchmarks. The market is operating as a volatile pullback within the broader 2026 advance, with 30343 as nearby overhead pivot resistance and the 29189 to 29257 moving-average area defining the closest intermediate-term support zone.
View charts on: AlphaWebTrader HTF Charts
CL Daily View
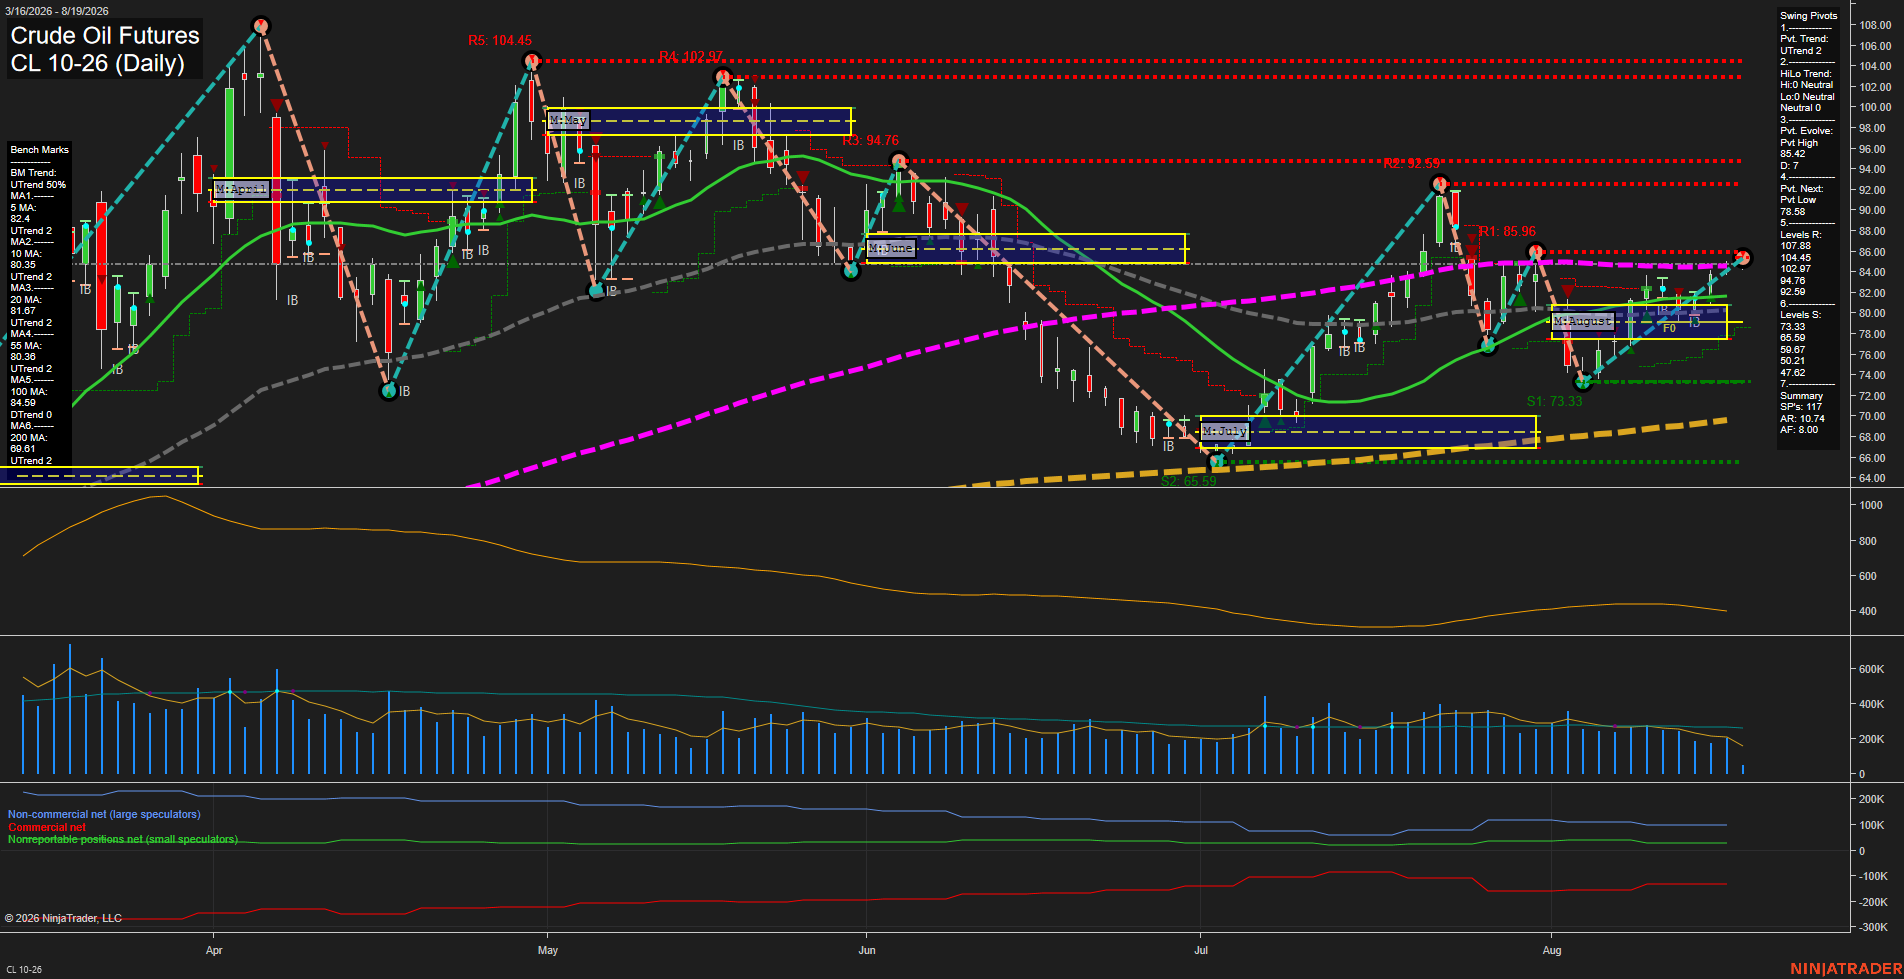
Overall Rating
- Short-Term: Bullish
- Intermediate-Term: Bullish
- Long-Term: Bullish.
Key Insights Summary
Price has recovered from the late-July selloff with higher lows from the 73.33 pivot low and has reclaimed the rising short-term benchmark cluster. The weekly and monthly Fib-grid readings remain above F0%, supporting an upward short-to-intermediate-term swing structure, while the 200-day benchmark remains firmly upward. Momentum has slowed as price approaches the 85.47 evolving pivot high and nearby 85.96 resistance; this creates a consolidation zone beneath the larger 92.59 and 94.76 resistance levels. The intermediate HiLo trend remains neutral because the broader structure is still rebuilding following the June-to-July decline, while the 100-day average remains slightly downward near price.
View charts on: AlphaWebTrader HTF Charts
GC Daily View
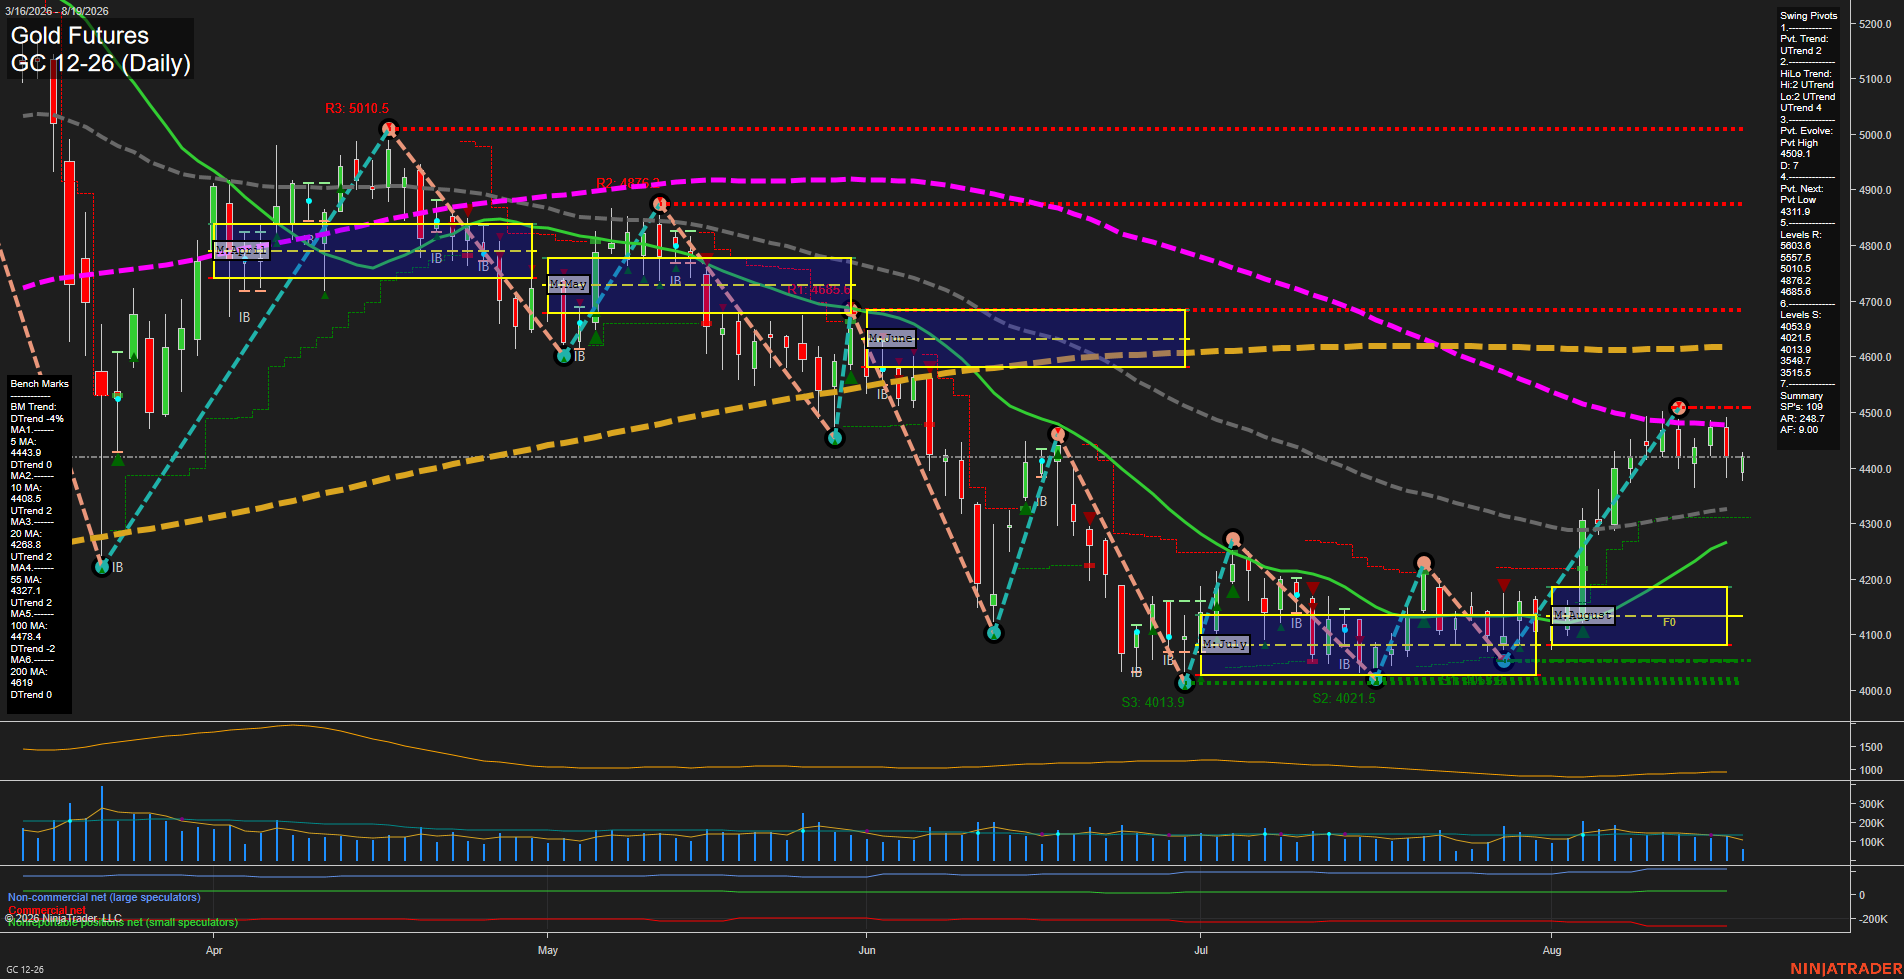
Overall Rating
- Short-Term: Bearish
- Intermediate-Term: Bullish
- Long-Term: Bearish.
Key Insights Summary
Gold is retracing lower after the August rally peaked at the 4509.1 pivot high, with price now below the declining 5-day average and slightly below the 10-day benchmark. The weekly grid is below F0% and short-term signal flow is bearish, while the active pivot structure and rising 20-day and 55-day averages retain an intermediate-term recovery profile. Price remains beneath falling 100-day and 200-day averages, defining the larger trend as bearish. The current structure reflects a medium-range pullback within an intermediate rebound, with 4311.9 as the next pivot reversal reference and 4509.1 as the nearest swing-high rejection area.
View charts on: AlphaWebTrader HTF Charts