NYSE premarket radar tracks ES, NQ, EMD and RTY strength, YM and FDAX consolidation, ETF movers, oil risks and Fed expectations ahead of the opening bell.
Fundamentals: U.S. index futures were mixed before the open, with Nasdaq 100 futures outperforming as AI-linked shares drew support from earnings and softer expectations for further Fed tightening. Oil held near $81 amid slower Strait of Hormuz shipping and stalled U.S.-Iran talks, while retail earnings, bond yields, weak consumer data and large AI infrastructure commitments remained in focus.
Technicals: U.S. equity futures enter the NYSE pre-market session with broad bullish alignment in ES, NQ, EMD and RTY across daily and weekly charts. YM and FDAX retain constructive intermediate- and long-term structures but show short-term consolidation near resistance. Prior-session ETF moves included gains in USO, TSLA and GLD, while IBIT, META and AMZN declined.
Pre-Market Trading 360° view Market Radar of: holidays, earnings, eco-news, market-news summary, news sentiment, prior session major ETFs, MAG7, Higher Time Frame Analysis Indices Futures Summary, and E-mini S&P500, Nasdaq 100, NYMEX Crude, Gold Futures Daily Chart analysis.
As of: August 17, 2026 07:16 CT
EcoNews Radar U.S. Events
| Day | Time | Impact | Event |
|---|---|---|---|
| Wed | 10:30 | Low | Crude Oil Inventories |
| Wed | 14:00 | High | FOMC Meeting Minutes |
| Thu | 08:30 | Medium | Philly Fed Manufacturing Index |
| Thu | 08:30 | Medium | Unemployment Claims |
EcoNews Summary
Wednesday features the week’s sole high-impact release: FOMC Meeting Minutes at 14:00. The minutes provide detail on Federal Reserve policy discussions, inflation assessments, labor-market conditions, and the balance of risks. Crude Oil Inventories at 10:30 provide petroleum-supply data relevant to energy prices and inflation-sensitive market sectors.
Event Notes:
- Wednesday 10:30 – USD Crude Oil Inventories: A report of changes in U.S. crude-oil stockpiles. Traders monitor inventory levels for indications of petroleum supply conditions and potential pressure on energy prices.
- Wednesday 14:00 – USD FOMC Meeting Minutes: A detailed record of the Federal Open Market Committee’s prior policy meeting. Traders monitor the language for insight into Federal Reserve policy deliberations, inflation concerns, and interest-rate conditions.
Conclusion:
The single most important event is Wednesday’s 14:00 FOMC Meeting Minutes. Market momentum and volume often slow ahead of major FOMC-related events, with increased volatility around the release. Crude inventory data adds an energy-price and petroleum-supply focus earlier on Wednesday; high oil prices directly affect markets through inflation and geopolitical concerns.
For full details visit: Forex Factory EcoNews
Market News Summary:
Index futures indicated a tech-led opening as easing Fed hike expectations supported risk appetite amid Middle East energy-supply concerns.
Primary Drivers & Risks:
- Primary Driver: Tech strength and softer Fed stance
- Primary Risk: Hormuz disruption lifts energy risk
Tone:
Cautiously constructive, with elevated geopolitical cross-currents.
Stock Market / ETFs / Indices:
Nasdaq 100 futures rose about 0.6%, S&P 500 futures added 0.1%, and Dow futures slipped about 0.1% before the open. AI-linked equities remained supported by earnings strength and investor focus on longer-term AI beneficiaries, while bullish index-options activity outweighed downside positioning. Retail earnings, elevated bond yields, and Big Tech’s substantial off-balance-sheet data-center and chip commitments remained focal points.
Geopolitical:
U.S.-Iran talks remained stalled and shipping through the Strait of Hormuz slowed. The conflict and potential yen strength added pressure to Japanese automaker earnings outlooks.
Oil / Energy:
WTI held near $81 as tanker attacks, constrained Hormuz traffic, an Iran blockade threat, and a Russian export outage sustained a supply premium. Prices traded mixed as weaker global-demand concerns offset disruption risk; China’s July crude throughput was down 15.8% from a year earlier despite a month-on-month rise.
Gold / Metals:
Gold and silver gained support from weak U.S. retail sales, softer labor and inflation data, reduced Fed hike expectations, central-bank buying, and investment inflows. Gold approached the cited $4,500 breakout area as the dollar weakened.
Fed / Financials:
July headline CPI eased to 3.4%, reinforcing a less hawkish rate narrative. Goldman Sachs stated that it sees the Fed holding rates in September absent dramatic data, while Asian currencies strengthened against the dollar as hike expectations declined.
Macro / Other:
Weak U.S. retail sales added to evidence of softer domestic demand. Japan’s weaker-than-expected second-quarter GDP supported a Nikkei gain and reinforced the case for a Bank of Japan hold. A 75-year-low U.S. cattle herd, linked to persistent drought, pressured beef supply and led Tyson Foods to close facilities.
Conclusion:
Technology and AI-linked strength supported index futures, led by Nasdaq futures. Softer inflation, labor, and retail data reduced perceived pressure for further Fed tightening.
Hormuz shipping disruption and stalled U.S.-Iran talks maintained oil-market risk and geopolitical uncertainty. Retail earnings, bond yields, and questions around the scale of AI spending remained key equity cross-currents.
Market News Sentiment
Market News Articles: 24
- Neutral: 62.50%
- Positive: 25.00%
- Negative: 12.50%
Sentiment Summary: Market news sentiment is predominantly neutral (63%), with positive coverage (25%) exceeding negative coverage (13%).
Conclusion: Indices futures headlines show a largely balanced tone, with limited directional bias in the news mix.
GLD,Gold Articles: 4
- Neutral: 50.00%
- Negative: 25.00%
- Positive: 25.00%
Sentiment Summary: GLD/Gold coverage is neutral overall, with 50% neutral, 25% negative, and 25% positive articles.
Conclusion: Gold-related news sentiment presents a balanced tone with equal positive and negative coverage.
USO,Oil Articles: 4
- Negative: 50.00%
- Neutral: 50.00%
Sentiment Summary: USO/Oil coverage is evenly split between negative and neutral sentiment, with 50% each across 4 articles.
Conclusion: Oil-related news presents a balanced tone with no positive sentiment reported, offering mixed context for indices futures day traders.
Market Data Snapshot
ETF Snapshot of major stock market ETFs, Mag7, and others as of: August 17, 2026 07:16
Top Movers & Losers
- USO 126.60 Bullish 1.26% ▲
- TSLA 342.27 Bullish 0.68% ▲
- GLD 401.48 Bullish 0.63% ▲
- IBIT 35.63 Bearish -0.70% ▼
- META 589.85 Bearish -0.86% ▼
- AMZN 262.65 Bearish -0.94% ▼
Major Index ETFs: SPY, QQQ, DIA, IWM, IJH
- IWM 305.09 Bullish 0.52% ▲
- IJH 78.67 Bullish 0.32% ▲
- QQQ 731.07 Bearish -0.14% ▼
- SPY 776.34 Bearish -0.20% ▼
- DIA 536.80 Bearish -0.21% ▼
Mixed index ETF snapshot: IWM is the most bullish mover at +0.52%, followed by IJH at +0.32%. DIA is the most bearish mover at -0.21%, with SPY at -0.20% and QQQ marginally Bearish at -0.14%.
Mag 7 Stocks: AAPL, MSFT, GOOG, AMZN, META, NVDA, TSLA
- TSLA 342.27 Bullish 0.68% ▲
- AAPL 305.93 Bullish 0.22% ▲
- NVDA 225.16 Bearish -0.06% ▼
- GOOG 343.54 Bearish -0.12% ▼
- MSFT 495.40 Bearish -0.30% ▼
- META 589.85 Bearish -0.86% ▼
- AMZN 262.65 Bearish -0.94% ▼
Mixed: TSLA is the most bullish mover at +0.68%, followed by AAPL at +0.22%. NVDA is marginally Bearish at -0.06% and GOOG is near-flat Bearish at -0.12%. MSFT is Bearish at -0.30%, while META is Bearish at -0.86%. AMZN is the most bearish mover at -0.94%.
Cross-Market ETFs: TLT, GLD, USO, IBIT
- USO 126.60 Bullish 1.26% ▲
- GLD 401.48 Bullish 0.63% ▲
- TLT 82.04 Bearish -0.67% ▼
- IBIT 35.63 Bearish -0.70% ▼
Mixed cross-market snapshot: USO is the most bullish mover at +1.26%, followed by GLD at +0.63%. IBIT is the most bearish mover at -0.70%, with TLT also Bearish at -0.67%.
ETF, Mag7, and Cross-Market ETF Insights
Overall Tone
Mixed: small-cap and mid-cap equity ETFs advanced while major large-cap ETFs and several Mag7 names were Bearish, alongside commodity strength and weakness in bonds and bitcoin.
Equity ETFs and Mag7:
Major Index ETFs were Mixed: IWM led at +0.52% and IJH gained +0.32%, while QQQ was marginally Bearish at -0.14%, SPY declined -0.20%, and DIA was the most Bearish index ETF at -0.21%. Mag7 performance was selective: TSLA was the most bullish equity mover at +0.68%, followed by AAPL at +0.22%, while NVDA -0.06% and GOOG -0.12% were near-flat; MSFT fell -0.30%, META -0.86%, and AMZN was the most bearish equity mover at -0.94%.
Cross-Market ETFs:
Cross-market ETFs were Mixed, led by USO as the most bullish mover at +1.26%, with GLD also Bullish at +0.63%. TLT was Bearish at -0.67%, while IBIT was the most bearish cross-market mover at -0.70%, diverging from oil and gold strength.
Futures Indices – Higher Time Frame Analysis
Summary of the current state of US Indices Futures based on higher time-frame (HTF) technical analysis as of: 2026-08-17: 07:16 CT.
US Indices Futures
- ES Bullish YSFG/MSFG/WSFG, above rising benchmarks, testing 7838.50 resistance; pivots 7838.50/7670.50, support 7454.00.
- NQ Bullish YSFG/MSFG/WSFG, above rising benchmarks; 30343 pivot high, 30975.50–31090.00 resistance, 29164.50 pivot support.
- YM WSFG short below F0%; MSFG/YSFG and benchmarks bullish, 54884 resistance, 53680/52546 pivots, 53145 benchmark support.
- EMD WSFG below F0%, MSFG/YSFG bullish; above rising benchmarks, 3947 resistance, 3725.3 pivot reversal, 3604.7 support.
- RTY WSFG below F0%, MSFG/YSFG bullish; rising benchmarks, 3078.7–3079.9 resistance, 2969.9 pivot, 2902.3 support.
- FDAX WSFG below F0%, MSFG/YSFG bullish; above benchmarks, 26665–26685 resistance, 26119 pivot, 25841–25490 support.
Overall State
- Short-Term: Bullish
- Intermediate-Term: Bullish
- Long-Term: Bullish
Conclusion
ES, NQ, RTY, and EMD maintain aligned higher-high structures above rising benchmarks, near pivot-high resistance. YM and FDAX are consolidating beneath resistance. WSFG countertrend conditions in YM, EMD, RTY, and FDAX contrast with bullish MSFG/YSFG structures; intermediate and long-term directional correlation remains upward.
Note: Intra-day counter-trend pullbacks or retracements may occur, HTF is context for informational usage and market structure. Glossary: Session Fib Grids periods of YSFG:’Yearly’, MSFG:’Monthly’, WSFG:’Weekly’
For full details visit: AlphaWebTrader Technicals
ES Daily View
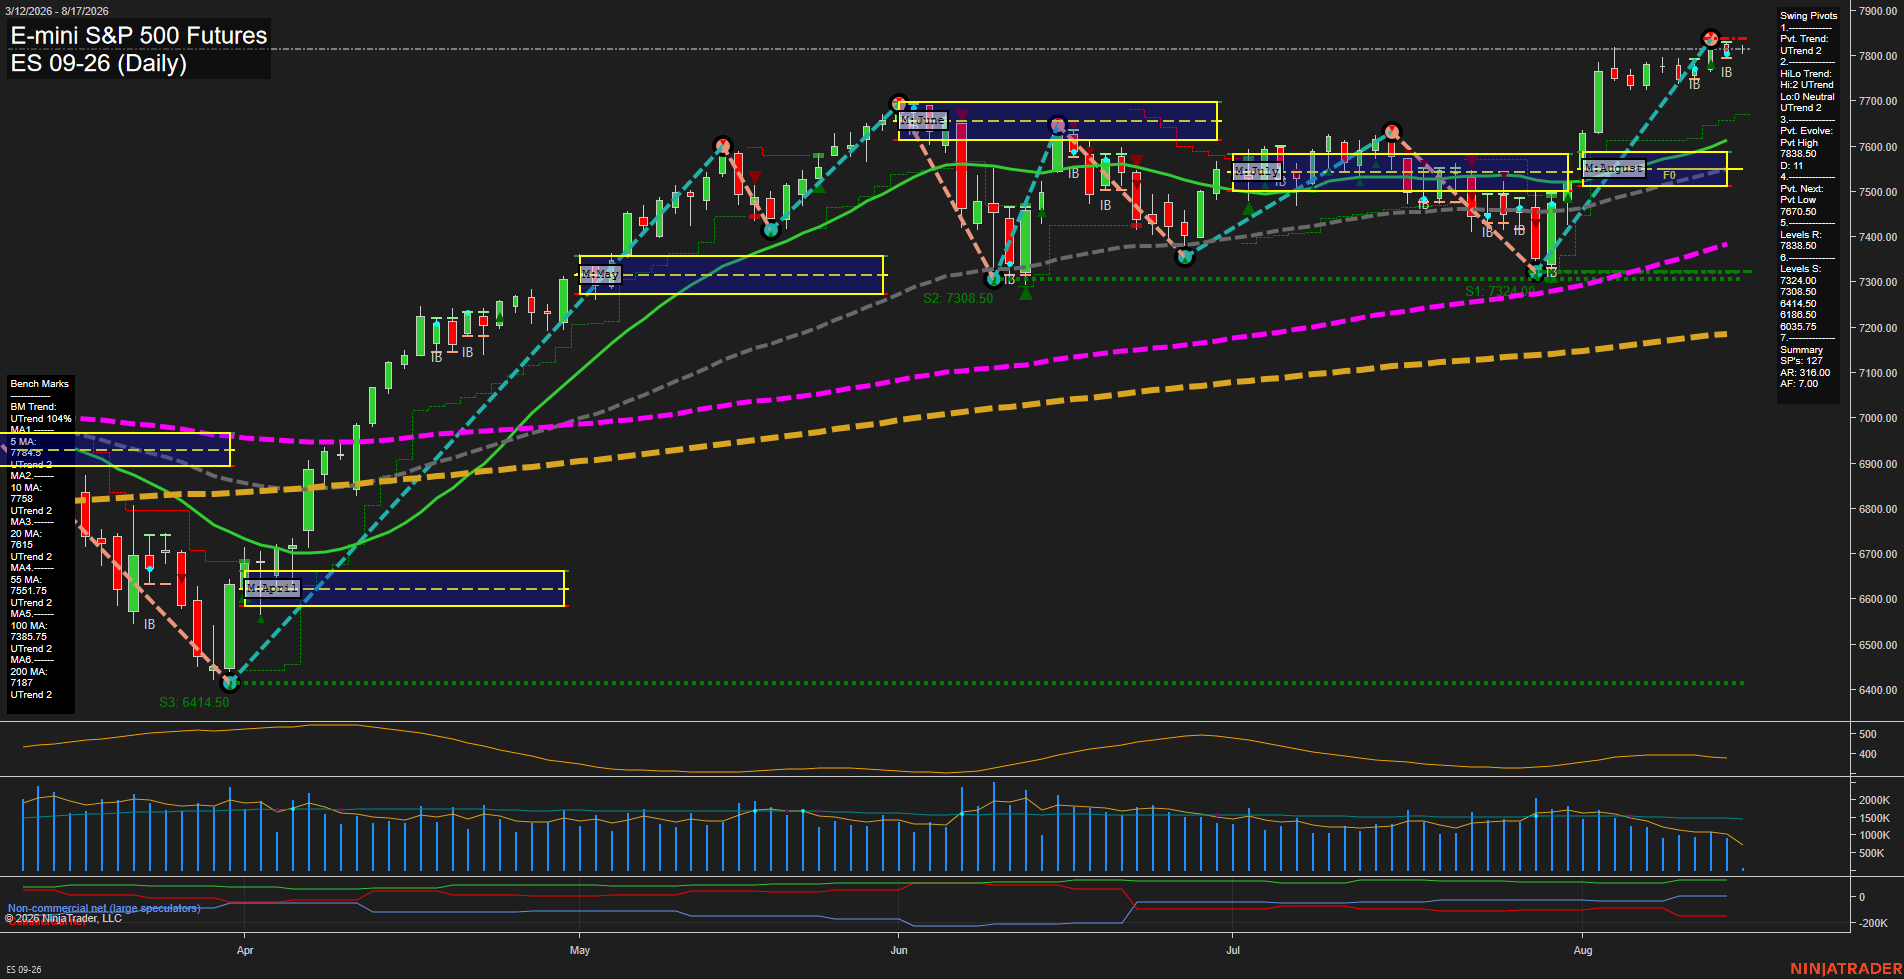
Overall Rating
- Short-Term: Bullish
- Intermediate-Term: Bullish
- Long-Term: Bullish.
Key Insights Summary
Price action completed a sharp August recovery from the 7308.50 pivot-support area and expanded to a new 7838.50 pivot high. Short-term momentum is fast, while small bars near the high show the rally is consolidating after an impulsive advance. Price is above the weekly, monthly, and yearly Fib-grid reference zones and all six rising benchmark averages, confirming broad multi-timeframe trend alignment. The 7838.50 pivot is the immediate breakout reference, while 7670.50 defines the next short-term pivot-reversal threshold; deeper structural support remains clustered near 7348.50 and 7308.50.
View charts on: AlphaWebTrader HTF Charts
NQ Daily View
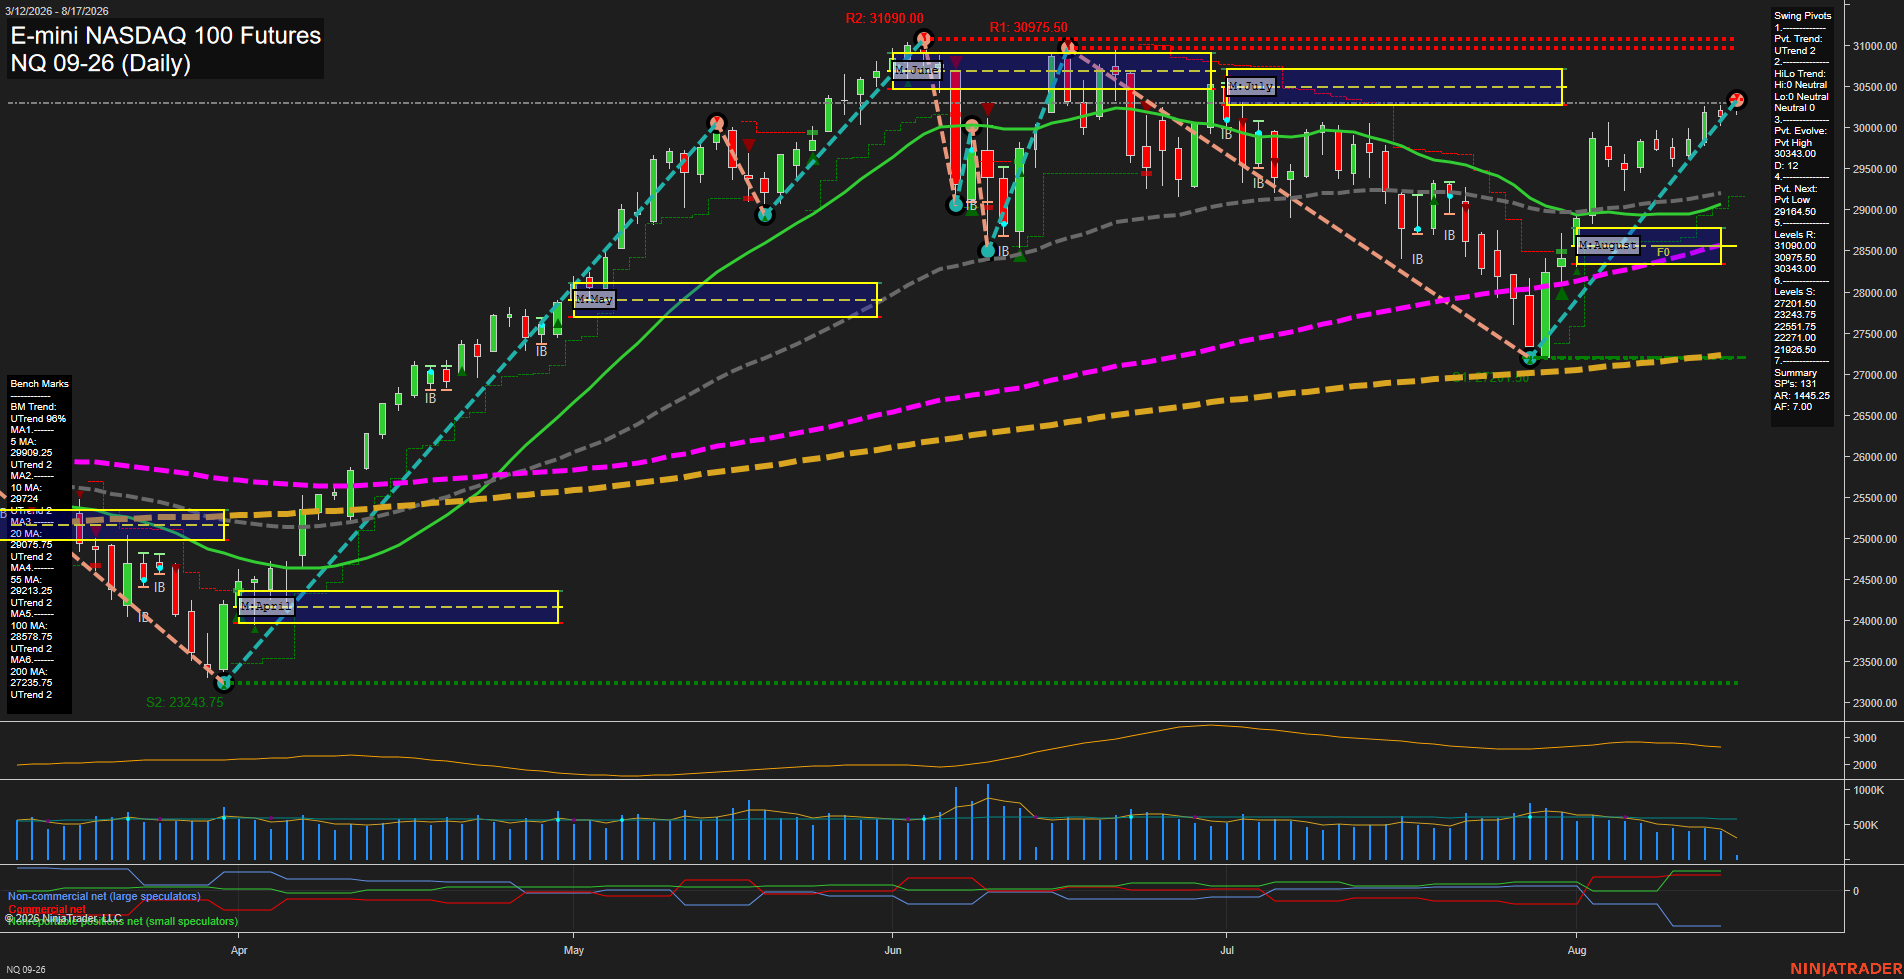
Overall Rating
- Short-Term: Bullish
- Intermediate-Term: Bullish
- Long-Term: Bullish.
Key Insights Summary
NQ has completed a sharp V-style recovery from the late-July/early-August selloff and is pressing into a new short-term pivot high near 30343. Price is above all rising daily benchmarks, while the weekly, monthly, and yearly Fib-grid readings remain positive. The immediate structure is bullish, although the 30975.50 to 31090.00 pivot-resistance band defines the prior high area overhead. The 29164.50 next-pivot level remains the key short-term structural reference beneath the rally.
View charts on: AlphaWebTrader HTF Charts
CL Daily View
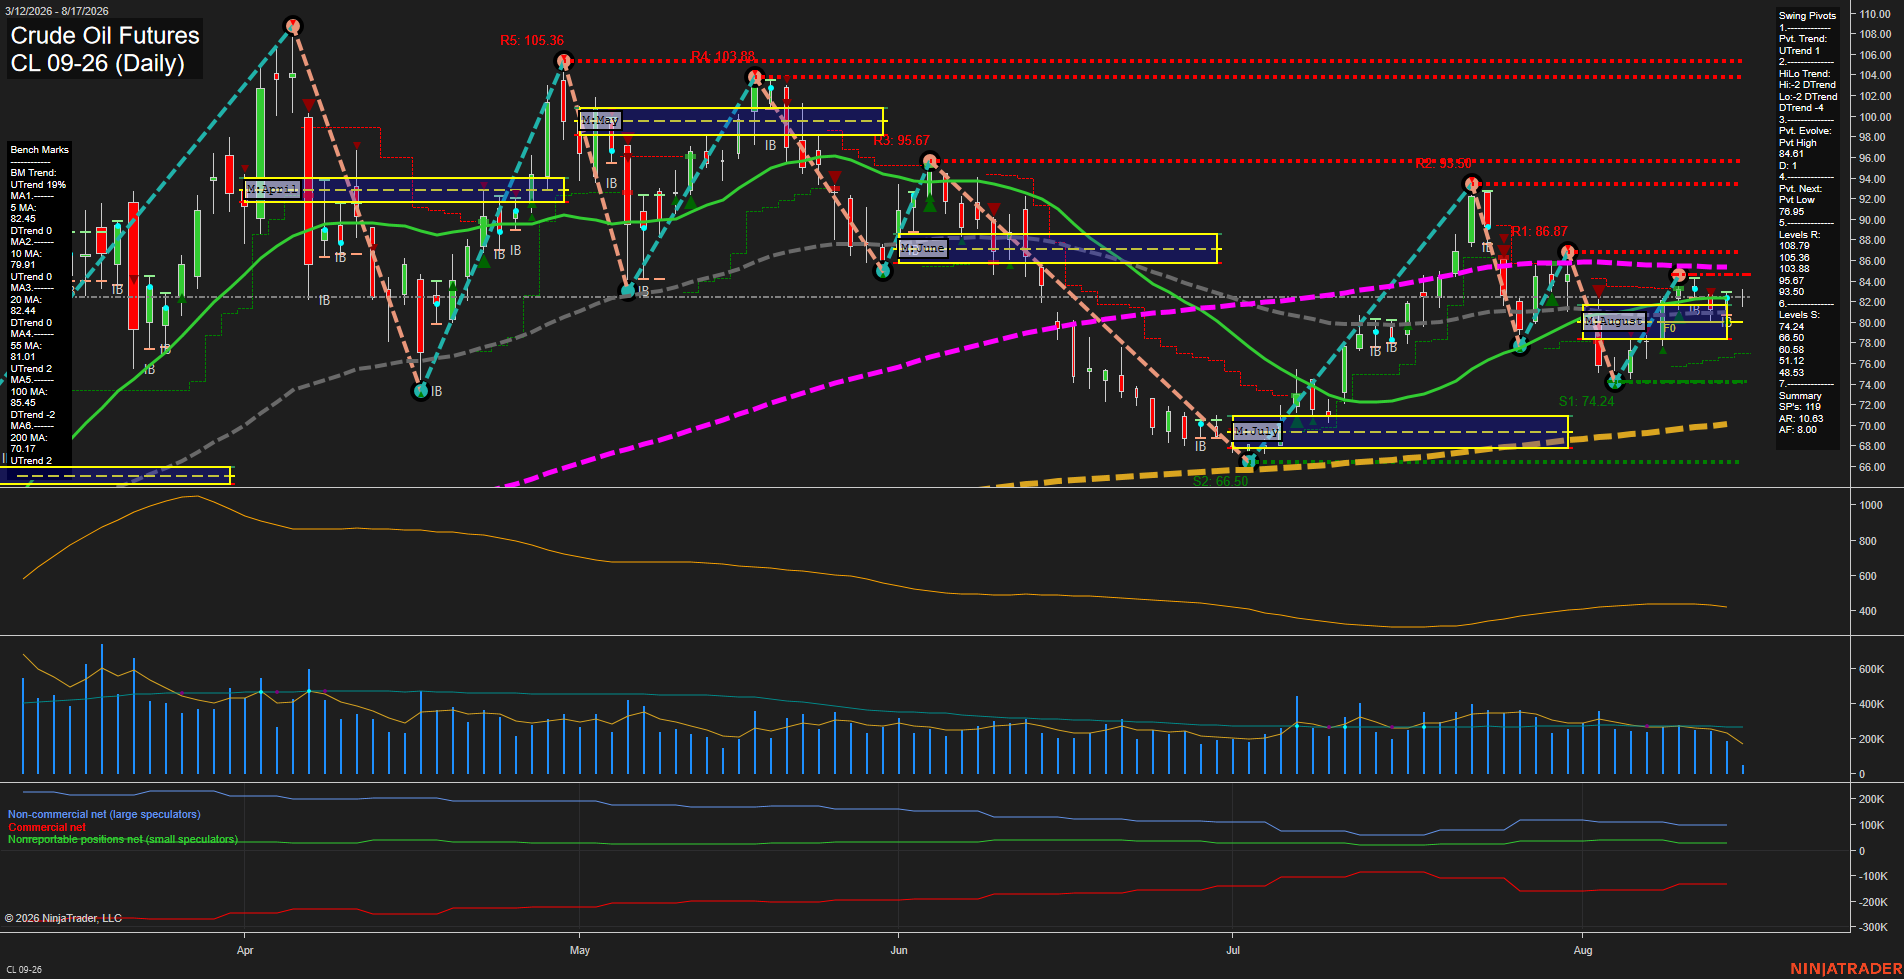
Overall Rating
- Short-Term: Bullish
- Intermediate-Term: Neutral
- Long-Term: Bullish.
Key Insights Summary
CL is consolidating near 83.67 following a sharp July-to-August recovery. Short-term structure remains constructive through higher lows, positive 5-day and 10-day benchmark trends, and an active UTrend pivot condition, although price remains marginally below the weekly F0% area. Intermediate structure is mixed: the monthly grid remains positive and price is above the 55-day average, while the 20-day average is declining and the broader HiLo pivot trend remains down. Long-term conditions retain a bullish foundation above the rising 200-day average and positive yearly grid, but the declining 100-day average near 85.45 remains an overhead trend reference. Recent small daily bars and subdued momentum reflect compression beneath the 84.61 pivot-evolve level, with 93.50 as the nearest larger pivot resistance and 74.24 as major confirmed swing support.
View charts on: AlphaWebTrader HTF Charts
GC Daily View
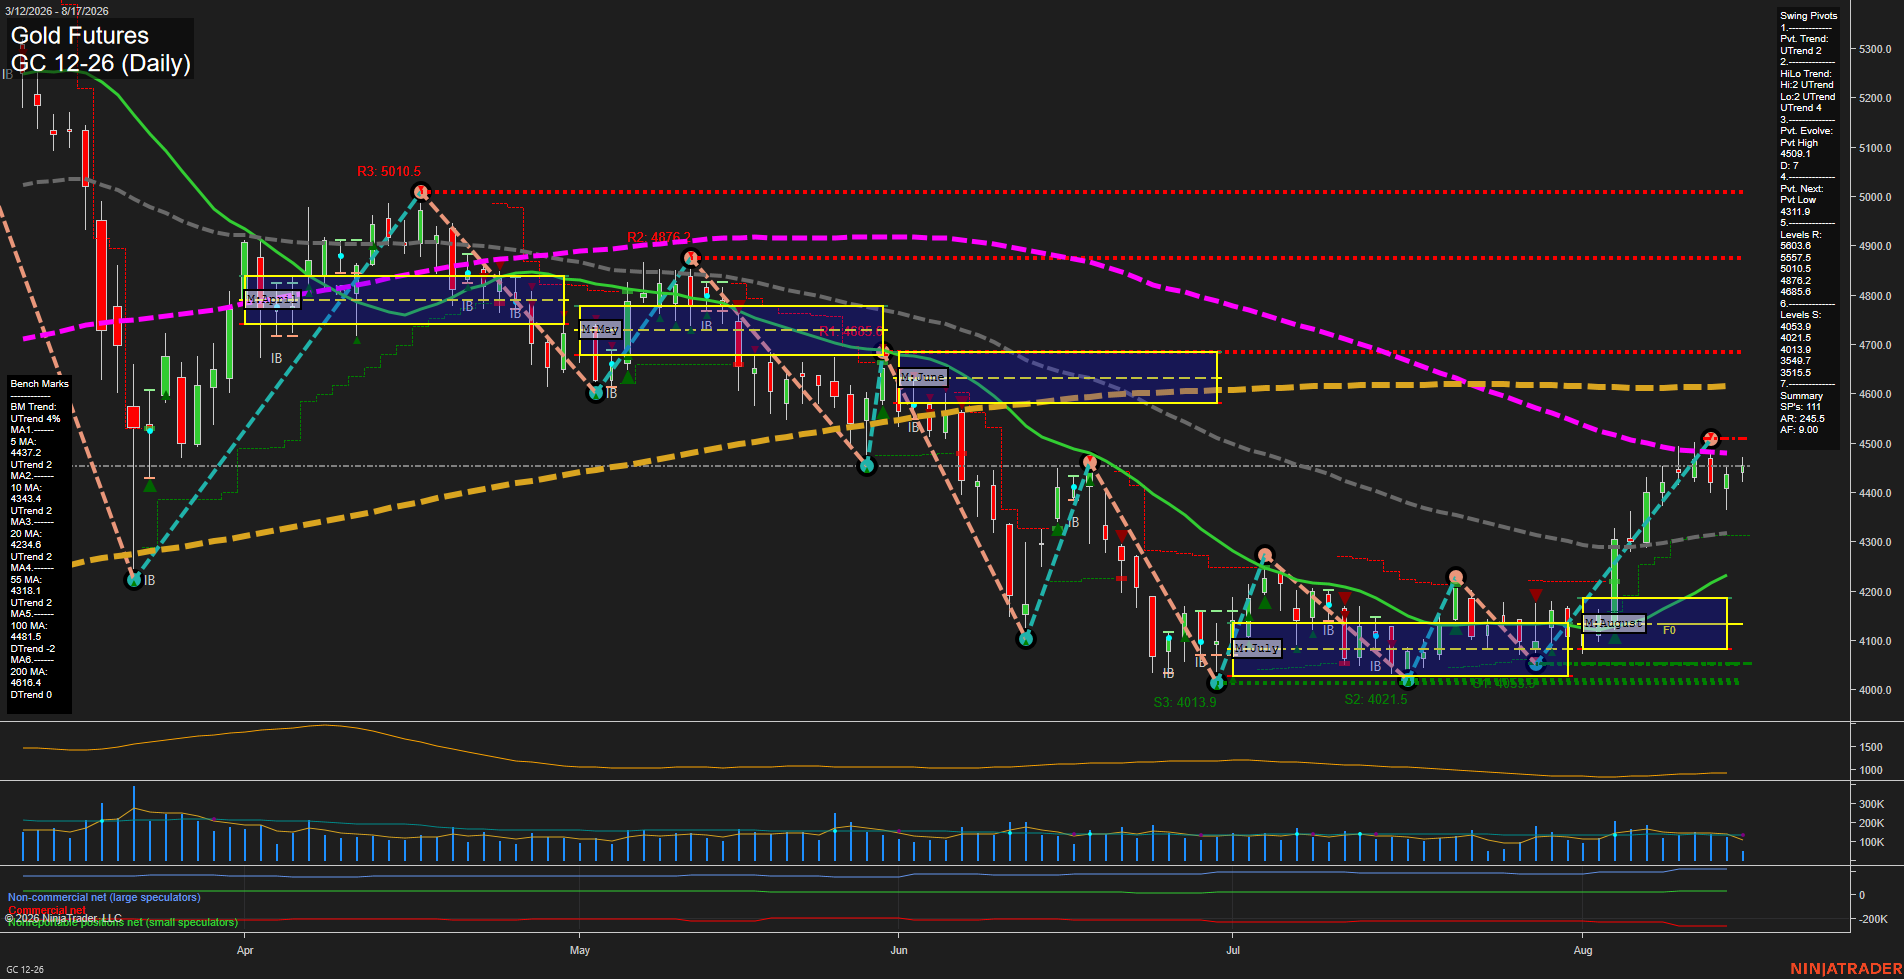
Overall Rating
- Short-Term: Bullish
- Intermediate-Term: Bullish
- Long-Term: Bearish.
Key Insights Summary
Gold has produced a sharp August recovery from the 4,000 support area, establishing a short-term UTrend and reclaiming the 5-, 10-, 20-, and 55-day benchmarks. The advance is consolidating below the active 4509.1 pivot high and the declining 100-day benchmark at 4481.5, creating a nearby resistance and test zone. Weekly and monthly fib-grid positioning remains above F0%, supporting the short- and intermediate-term recovery structure, while the yearly grid and declining 100- and 200-day averages retain a broader long-term downtrend backdrop. Price action is currently narrow and momentum has slowed following the fast rally, indicating consolidation beneath resistance rather than an expanded breakout phase.
View charts on: AlphaWebTrader HTF Charts