NYSE pre-market futures show broad strength in ES, NQ, RTY, EMD and FDAX as traders await retail sales and sentiment data after an S&P 500 record close.
Fundamentals: Markets enter the session after softer U.S. inflation and technology strength pushed the S&P 500 to a record close. Retail sales and consumer sentiment data are due as investors assess elevated Treasury yields, concentrated AI leadership and low volatility. Oil remains supported by Iran-related supply concerns, while gold and mining shares face renewed pressure.
Technicals: U.S. index futures entered the NYSE pre-market session with broadly bullish multi-timeframe structures across ES, NQ, RTY, EMD and FDAX. ES is consolidating near 7838.50 resistance, NQ is testing 30272.75, and RTY is near 3073.9. YM remains bullish over longer time frames but shows neutral-to-bearish short-term momentum below 54884.
Pre-Market Trading 360° view Market Radar of: holidays, earnings, eco-news, market-news summary, news sentiment, prior session major ETFs, MAG7, Higher Time Frame Analysis Indices Futures Summary, and E-mini S&P500, Nasdaq 100, NYMEX Crude, Gold Futures Daily Chart analysis.
As of: August 14, 2026 07:16 CT
EcoNews Radar U.S. Events
| Day | Time | Impact | Event |
|---|---|---|---|
| Fri | 08:30 | Medium | Core Retail Sales m/m |
| Fri | 08:30 | Medium | Retail Sales m/m |
| Fri | 10:00 | Medium | Prelim UoM Consumer Sentiment |
| Fri | 10:00 | Medium | Prelim UoM Inflation Expectations |
EcoNews Summary
No qualifying high-impact EcoNews events are listed. The listed medium-impact releases are not directly related to oil, crude inventories, energy prices, or petroleum supply and are excluded under the stated criteria.
Event Notes:
- No qualifying events listed.
Conclusion:
No single most important qualifying event is identified for the week because no high-impact events or eligible energy-related medium-impact events are listed.
For full details visit: Forex Factory EcoNews
Market News Summary:
Softer U.S. inflation data and renewed technology leadership lifted the S&P 500 to a record, while bond-yield, energy-supply, and geopolitical risks remained active.
Primary Drivers & Risks:
- Primary Driver: Soft inflation and tech strength
- Primary Risk: Rising yields and Iran blockade
Tone:
Constructive equities tone with notable cross-currents.
Stock Market / ETFs / Indices:
The S&P 500 reached a record high as softer producer inflation improved sentiment and technology, cyclicals, rate-sensitive shares, and healthcare supported broader participation. Friday U.S. futures were lower to near flat after the prior session’s advance, while low volatility readings and concentration in the AI trade drew caution.
Geopolitical:
The United States threatened an indefinite naval blockade of Iran alongside expanded economic measures, intensifying Middle East supply-security concerns. The White House also reported $19 billion to $26 billion in annual lost tariff revenue from goods, largely from China, routed through third countries.
Oil / Energy:
Oil moved higher and headed for weekly gains after the Iran blockade threat revived concerns over Middle East crude disruptions. Weak global-demand signals, rising inventories, and tight refinery-feedstock and LNG flows remained offsetting factors; India’s Russian crude imports reached a record share in July.
Gold / Metals:
Gold fell despite softer U.S. PPI and remained below the $4,500 level cited as a key rally threshold; silver also faced resistance near $72. Mining shares declined as gold and copper momentum stalled, although softer inflation, central-bank buying, and geopolitical tensions supported the broader metals backdrop.
Fed / Financials:
Subdued core inflation eased pressure for a Federal Reserve rate increase at the next meeting, supporting the risk-on equity response. Treasury yields remained elevated despite decent demand at 10- and 30-year auctions, and long-duration Treasury ETFs remained under pressure amid debt and yield concerns.
Macro / Other:
Heat and drought in France threatened to cut the maize crop sharply and deepen EU harvest losses. China’s automakers continued expanding overseas, increasing pressure on established global manufacturers.
Conclusion:
Soft inflation data and strong technology earnings drove the record S&P 500 close and improved investor sentiment. Market breadth also extended into cyclicals, rate-sensitive sectors, and healthcare.
Higher Treasury yields, subdued volatility, and AI-trade concentration remained financial-market cross-currents. Iran-related supply risks supported oil, while weaker demand signals and agricultural drought added macro uncertainty.
Market News Sentiment
Market News Articles: 52
- Neutral: 40.38%
- Positive: 40.38%
- Negative: 19.23%
Sentiment Summary: Of 52 market news articles, 40% were neutral, 40% positive, and 19% negative, indicating balanced coverage with limited negative tone.
Conclusion: Indices futures day traders are facing an evenly split neutral-to-positive news environment, with negative sentiment representing a smaller share.
GLD,Gold Articles: 14
- Negative: 50.00%
- Positive: 42.86%
- Neutral: 7.14%
Sentiment Summary: GLD/Gold coverage is mixed, with 50% negative, 43% positive, and 7% neutral sentiment across 14 articles.
Conclusion: Gold-related news tone is slightly negative overall, indicating a modest risk-sensitive backdrop for indices futures day traders.
USO,Oil Articles: 11
- Neutral: 36.36%
- Negative: 36.36%
- Positive: 27.27%
Sentiment Summary: USO/oil coverage is mixed, with 36% neutral, 36% negative, and 27% positive articles across 11 items.
Conclusion: Oil-related news tone is balanced between neutral and negative coverage, with positive sentiment less prevalent.
Market Data Snapshot
ETF Snapshot of major stock market ETFs, Mag7, and others as of: August 14, 2026 07:16
Top Movers & Losers
- TSLA 339.96 Bullish 3.80% ▲
- META 594.97 Bullish 2.78% ▲
- QQQ 732.07 Bullish 1.16% ▲
- AMZN 265.13 Bearish -0.80% ▼
- GLD 398.96 Bearish -1.47% ▼
- USO 125.03 Bearish -1.78% ▼
Major Index ETFs: SPY, QQQ, DIA, IWM, IJH
- QQQ 732.07 Bullish 1.16% ▲
- SPY 777.88 Bullish 0.70% ▲
- IJH 78.42 Bullish 0.46% ▲
- IWM 303.50 Bullish 0.26% ▲
- DIA 537.91 Bullish 0.14% ▲
Major index ETFs are Bullish across the group: QQQ leads with +1.16%, followed by SPY at +0.70%. IJH gains +0.46% and IWM adds +0.26%, while DIA is the least positive mover at a marginal +0.14%.
Mag 7 Stocks: AAPL, MSFT, GOOG, AMZN, META, NVDA, TSLA
- TSLA 339.96 Bullish 3.80% ▲
- META 594.97 Bullish 2.78% ▲
- AAPL 305.26 Bullish 1.00% ▲
- MSFT 496.88 Bullish 0.90% ▲
- NVDA 225.30 Bullish 0.54% ▲
- GOOG 343.94 Bullish 0.46% ▲
- AMZN 265.13 Bearish -0.80% ▼
Mixed Mag7 snapshot: TSLA is the most bullish mover at +3.80%, followed by META at +2.78%. AAPL +1.00%, MSFT +0.90%, NVDA +0.54%, and GOOG +0.46% are Bullish, while AMZN is the most bearish mover at -0.80%.
Cross-Market ETFs: TLT, GLD, USO, IBIT
- TLT 82.59 Bullish 0.58% ▲
- IBIT 35.88 Bearish -0.03% ▼
- GLD 398.96 Bearish -1.47% ▼
- USO 125.03 Bearish -1.78% ▼
Mixed cross-market snapshot: TLT is the most bullish mover at +0.58%. USO is the most bearish mover at -1.78%, followed by GLD at -1.47%. IBIT is marginally Bearish at -0.03%.
ETF, Mag7, and Cross-Market ETF Insights
Overall Tone
Mixed: equity ETFs were broadly Bullish, led by growth and large-cap strength, while commodities and IBIT were Bearish.
Equity ETFs and Mag7:
Major Index ETFs were aligned Bullish, with QQQ at +1.16% leading SPY at +0.70%, IJH at +0.46%, IWM at +0.26%, and DIA at a marginal +0.14%. Mag7 participation was selective but strongly Bullish overall: TSLA was the most bullish mover at +3.80%, followed by META at +2.78%, while AMZN was the most bearish mover at -0.80%. AAPL, MSFT, NVDA, and GOOG were Bullish, ranging from +0.46% to +1.00%.
Cross-Market ETFs:
Cross-market ETFs were Mixed versus Bullish equities, with TLT Bullish at +0.58% while GLD, USO, and IBIT were Bearish. USO was the most bearish mover at -1.78%, followed by GLD at -1.47%; IBIT was near-flat Bearish at -0.03%. TLT was the most bullish mover at +0.58%, contrasting with commodity weakness.
Futures Indices – Higher Time Frame Analysis
Summary of the current state of US Indices Futures based on higher time-frame (HTF) technical analysis as of: 2026-08-14: 07:16 CT.
US Indices Futures
- ES: YSFG/MSFG/WSFG up above F0%/NTZ, above rising benchmarks, UTrend pivots; 7838.50 resistance, 7638.00 and 7443.00 support references.
- NQ: YSFG/MSFG/WSFG up above F0%, above rising benchmarks; 30272.75, 30975.50 and 31090 resistance; 29017.25 pivot-reversal support.
- YM: YSFG/MSFG up, WSFG down; above rising benchmarks, intermediate/long pivots UTrend; 54884 resistance, 53800 and 52396 structural supports.
- EMD: YSFG/MSFG/WSFG up above F0%, above rising benchmarks, UTrend pivots; 3939.8 resistance, 3903.8, 3828.4 and 3708.2 support references.
- RTY: YSFG/MSFG/WSFG up above F0%, above rising benchmarks; 3076.3/3073.9 resistance, 2987.7 pivot reversal, 2902.3 established support.
- FDAX: YSFG above F0%, MSFG/WSFG aligned upward; above rising benchmarks, UTrend pivots; 26685 resistance, 26091 and 25055 support references.
Overall State
- Short-Term: Bullish
- Intermediate-Term: Bullish
- Long-Term: Bullish
Conclusion
ES, NQ, EMD, RTY, and FDAX retain synchronized bullish HTF structure: Fib grids are upward, price is above benchmark averages, and pivot sequences maintain higher-high/higher-low conditions. These contracts are pressing or exceeding swing-high references. YM is the short-term divergence, with WSFG down and consolidation below 54884, while its MSFG, YSFG, benchmark alignment, and intermediate-to-long-term pivot structure remain upward. Key directional correlation remains broad-based across the index complex, with YM lagging the short-term advance.
Note: Intra-day counter-trend pullbacks or retracements may occur, HTF is context for informational usage and market structure. Glossary: Session Fib Grids periods of YSFG:’Yearly’, MSFG:’Monthly’, WSFG:’Weekly’
For full details visit: AlphaWebTrader Technicals
ES Daily View
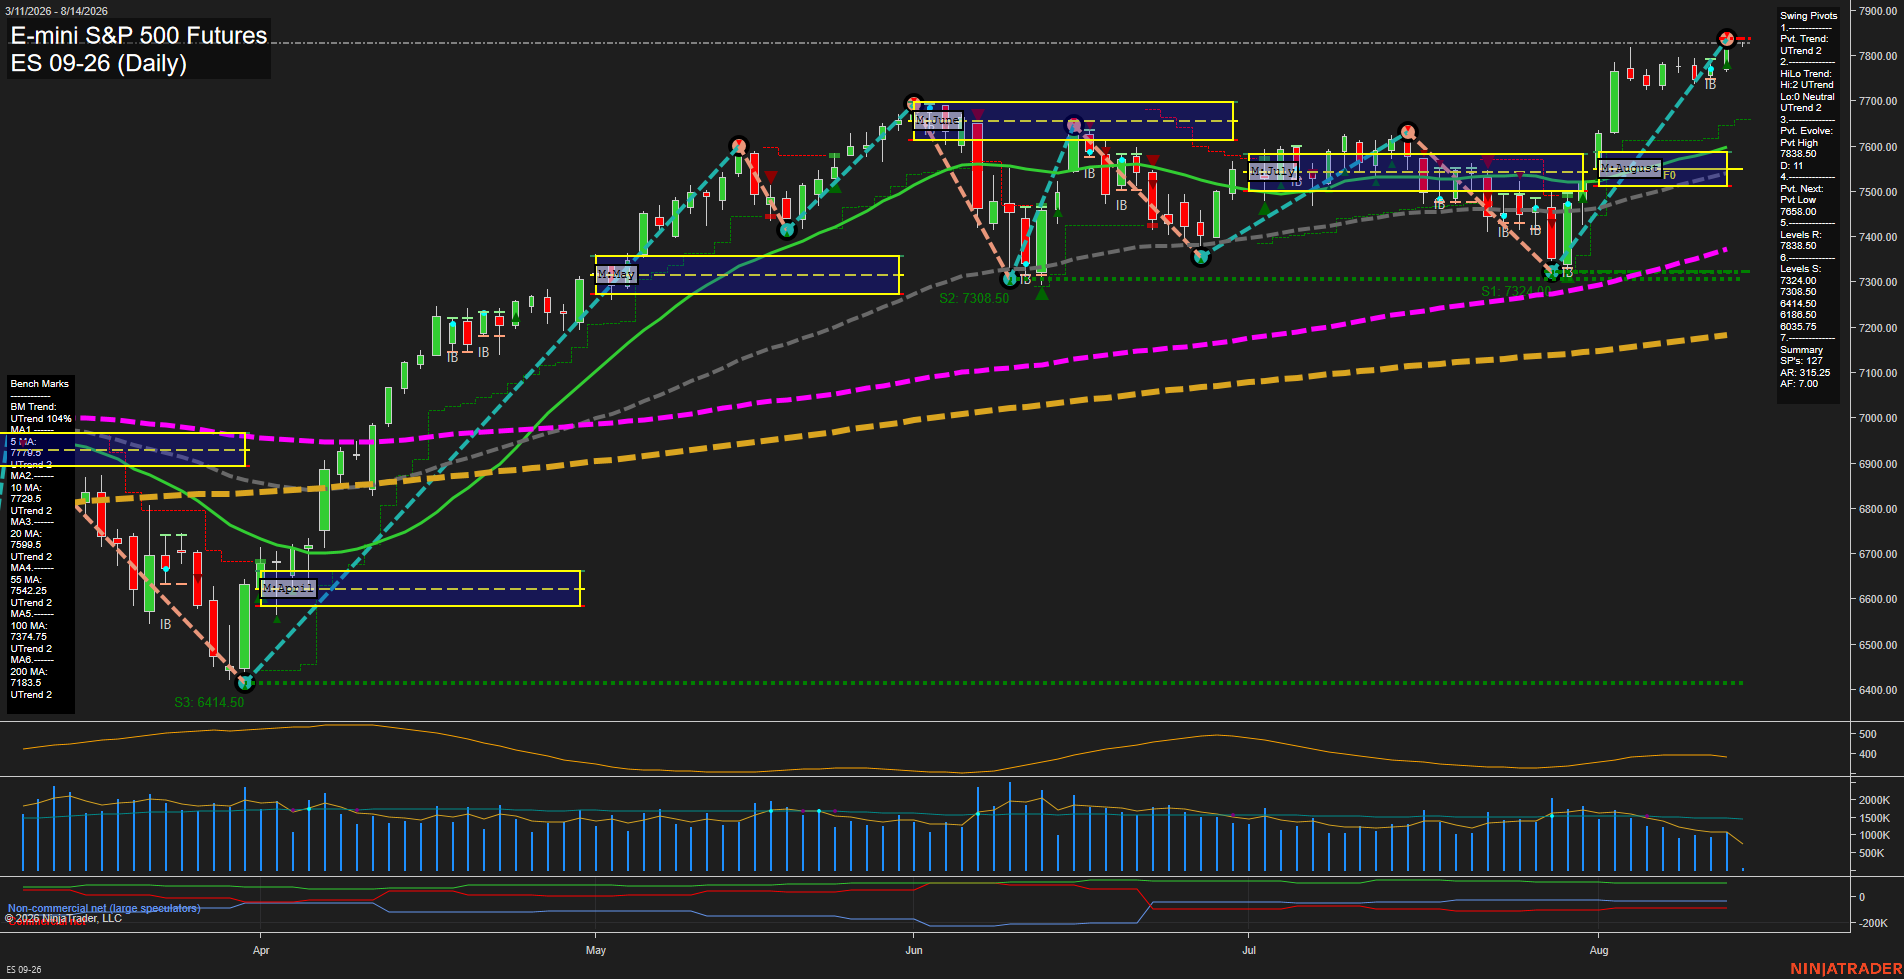
Overall Rating
- Short-Term: Bullish
- Intermediate-Term: Bullish
- Long-Term: Bullish.
Key Insights Summary
Price is holding above every benchmark moving average while both pivot structures remain in UTrend. The August advance has produced a fast, near-vertical recovery from the 7308.50 pivot-support area into the 7838.50 swing-high resistance, leaving small daily bars near the high that reflect consolidation after a strong impulse. Weekly, monthly, and yearly fib-grid readings remain above their F0%/NTZ references and maintain aligned upward trends. The 7638.00 pivot-next level defines the nearest meaningful short-term structural retracement threshold, while 7838.50 is the immediate overhead swing reference.
View charts on: AlphaWebTrader HTF Charts
NQ Daily View
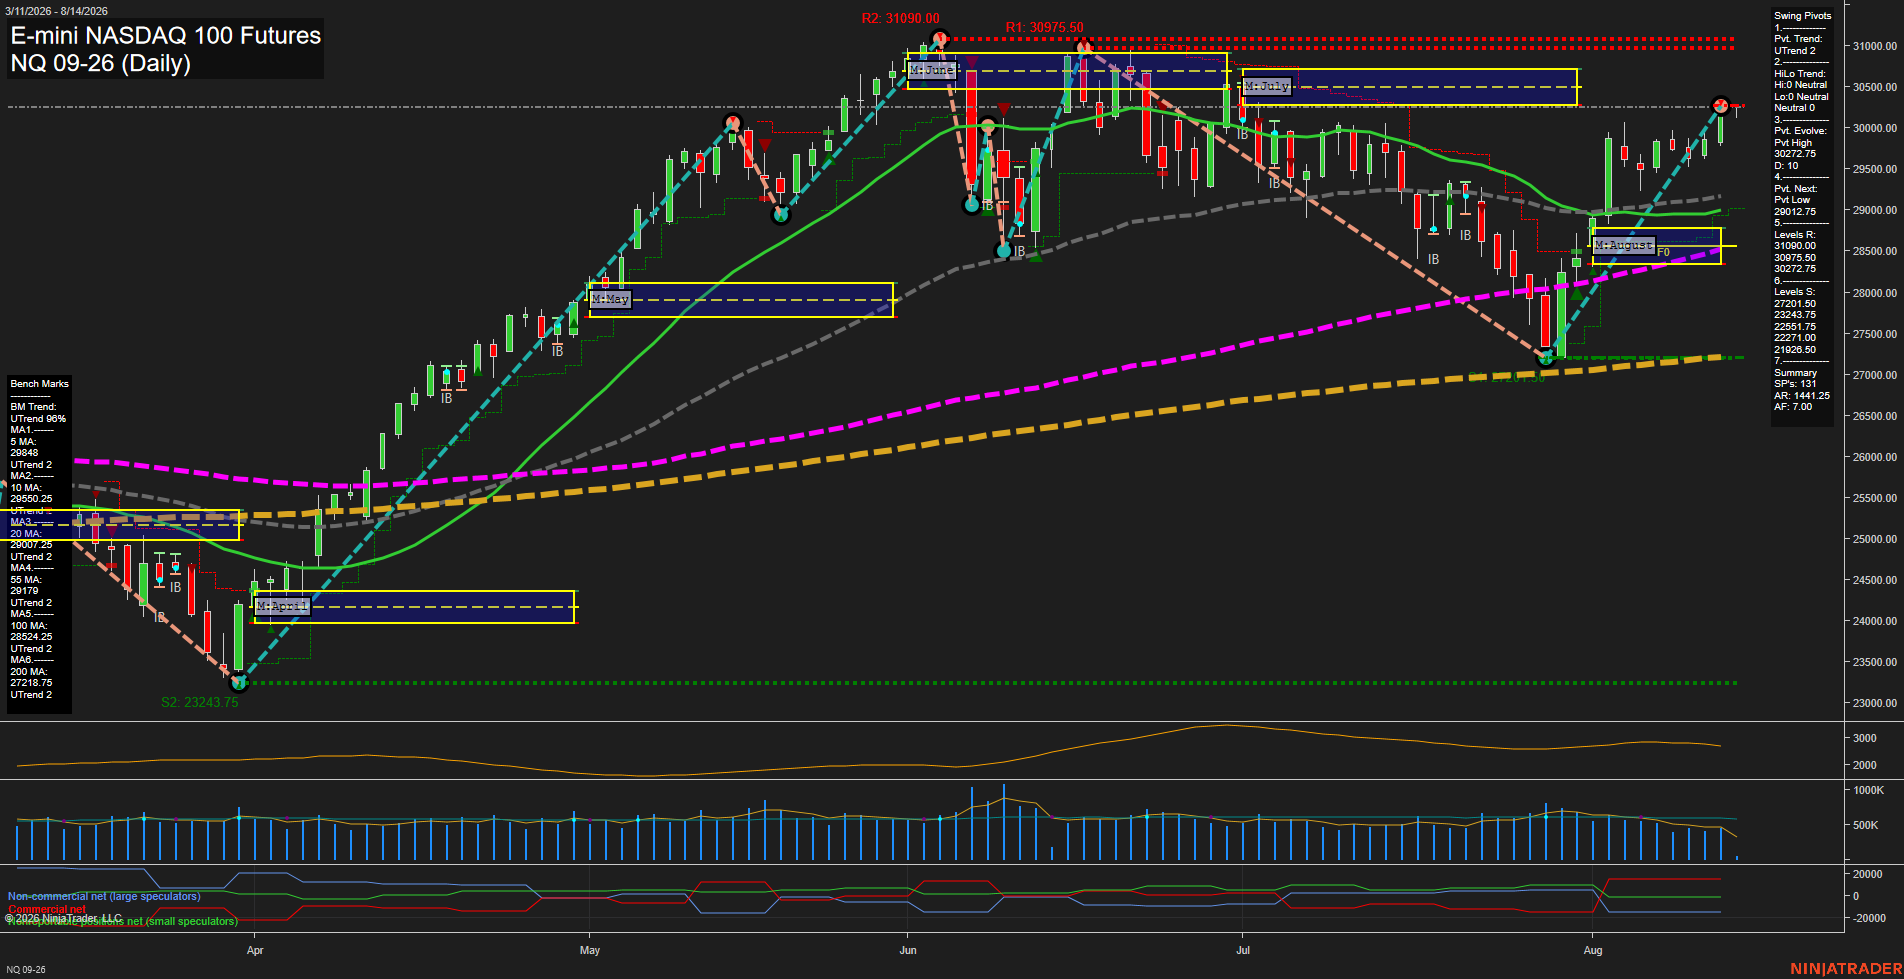
Overall Rating
- Short-Term: Bullish
- Intermediate-Term: Bullish
- Long-Term: Bullish.
Key Insights Summary
NQ has produced a strong V-recovery from the late-July pivot low and is pressing into the 30272.75 pivot-high area. Price is above all benchmark averages, while the weekly, monthly, and yearly fib-grid structures remain upward. The short-term pivot trend is up, though the neutral HiLo structure shows the broader swing pattern is still rebuilding after the prior correction. Overhead pivot resistance is concentrated at 30272.75, 30975.50, and 31090, while 29017.25 is the next pivot-reversal reference and the 20-to-55 day average zone forms the nearest intermediate support area. Momentum is fast, with medium-range daily bars and elevated ATR reflecting an active, volatile continuation phase.
View charts on: AlphaWebTrader HTF Charts
CL Daily View
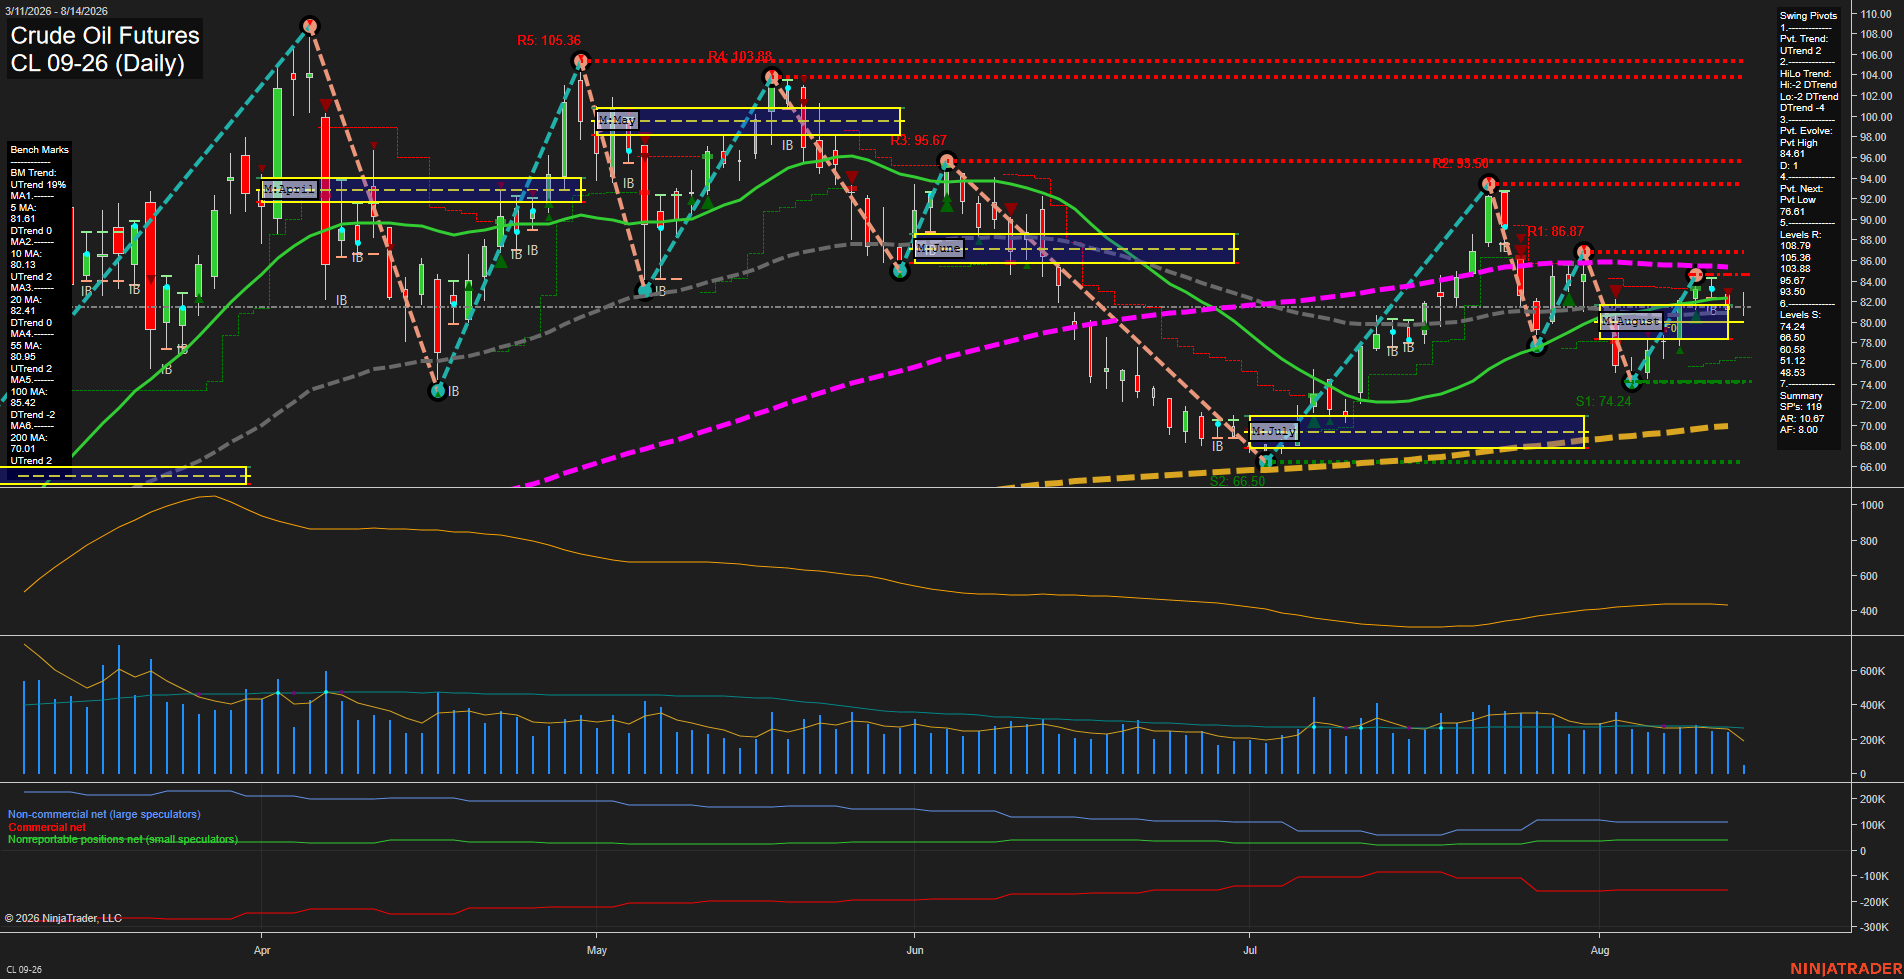
Overall Rating
- Short-Term: Neutral
- Intermediate-Term: Neutral
- Long-Term: Bullish.
Key Insights Summary
CL is consolidating after its rebound from the 74.24 swing-low support zone. Short-term pivots remain in an UTrend, but the intermediate HiLo structure remains a DTrend and price is compressing around the 5, 10, 20, and 55-day benchmarks. The 81.69 close is marginally below the declining 20-day average and beneath the 85.42 100-day average, while holding above the rising 10-day, 55-day, and 200-day benchmarks. The near-term structure is range-bound between support near 76.80 and resistance at 86.87, with small bars and softer momentum reflecting consolidation rather than a directional expansion. Long-term structure remains constructive above the rising 200-day benchmark and yearly grid support.
View charts on: AlphaWebTrader HTF Charts
GC Daily View
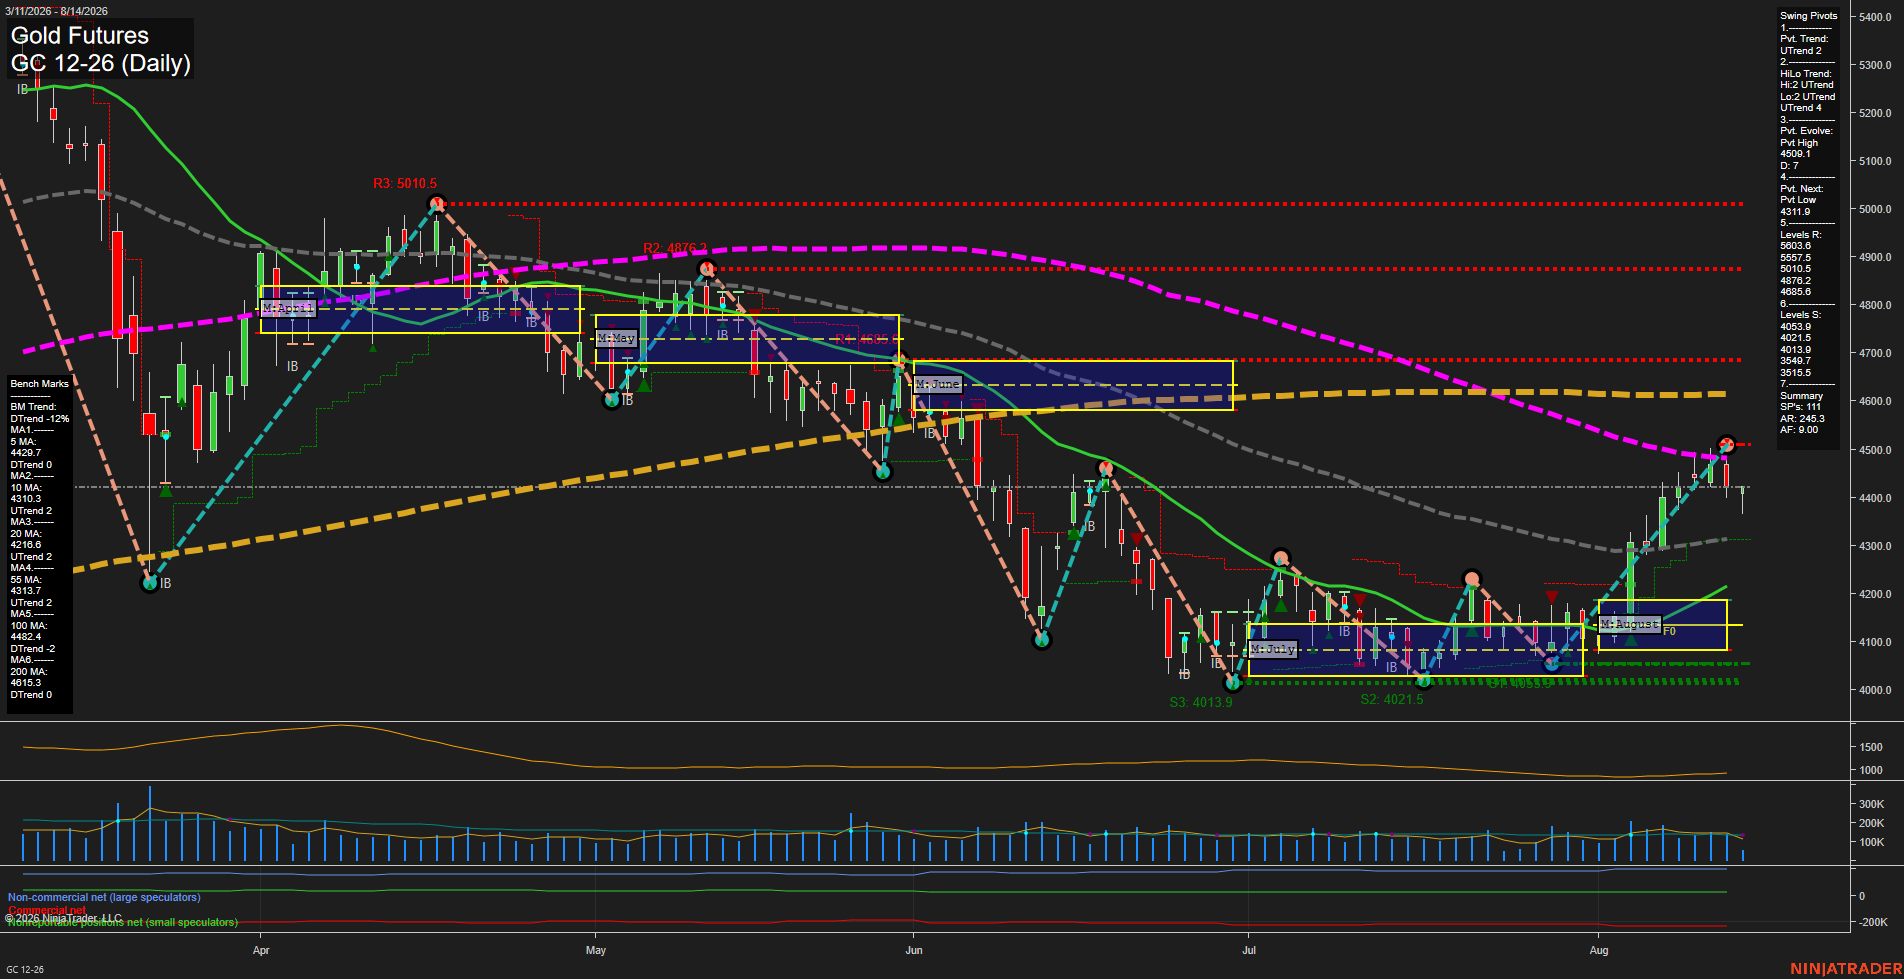
Overall Rating
- Short-Term: Bullish
- Intermediate-Term: Bullish
- Long-Term: Bearish.
Key Insights Summary
Gold has produced a fast recovery from the July/August 4014-4054 support cluster, establishing a sequence of higher swing lows and lifting price above the rising 10-day, 20-day, and 55-day benchmarks. The short-term pivot structure remains in an uptrend, although the 4509.1 pivot high and price below the declining 5-day average reflect a near-term pullback following the sharp rally. The monthly and weekly Fib grids remain positive, while the broader yearly grid and declining 100-day and 200-day averages retain a bearish long-term backdrop. Current action is a countertrend rally within the larger declining moving-average structure, with 4311.9 defining the next pivot-reversal level and 4509.1 marking the immediate swing-high reference.
View charts on: AlphaWebTrader HTF Charts