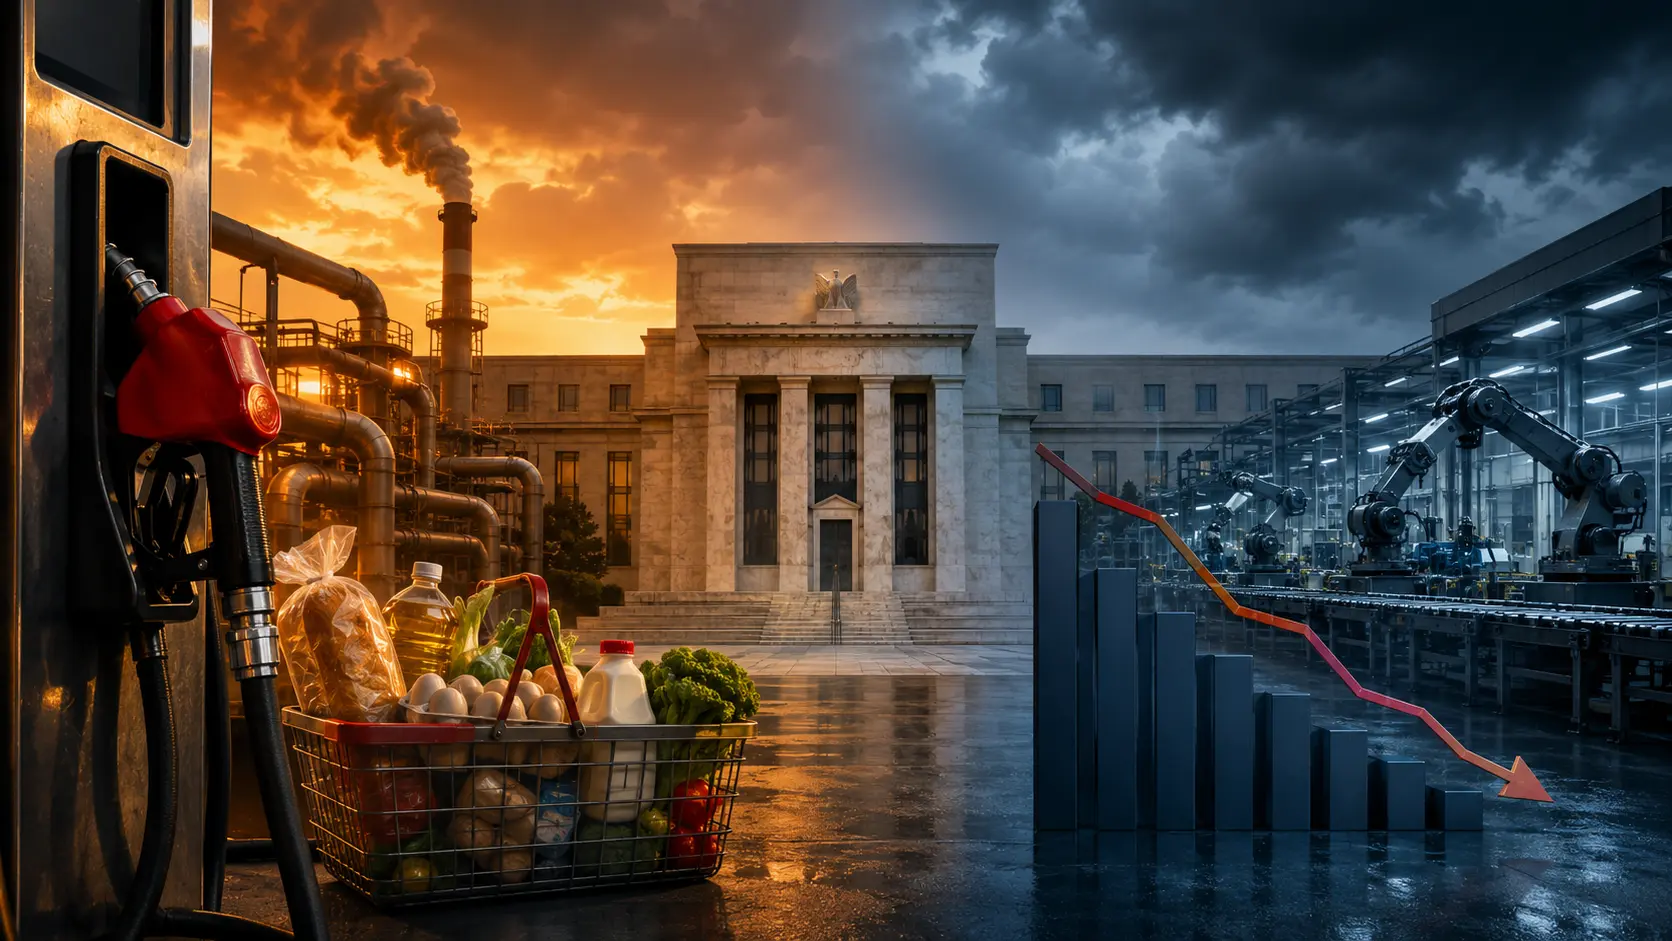
Stagflation is the uncomfortable combination of persistent inflation, weak or stagnant economic growth and a deteriorating labor market. Prices remain under pressure even though the economy is losing momentum. That makes stagflation especially difficult for households, companies, investors and central banks.
Stagflation in One Minute
The word combines stagnation and inflation. In a conventional slowdown, weaker demand usually helps inflation fall and gives the central bank room to reduce interest rates. In stagflation, inflation stays high while growth and employment weaken.
There is no single official numerical threshold that automatically declares stagflation. Economists diagnose it by examining the persistence and breadth of three conditions:
- Inflation: consumer, producer or economy-wide prices continue rising faster than the central bank considers consistent with price stability.
- Stagnation: real economic growth is unusually weak, flat or contracting.
- Labor-market weakness: hiring, hours worked or labor-force participation deteriorate, often followed by higher unemployment.
One weak payroll report or one high CPI reading does not establish stagflation. The diagnosis requires a pattern across inflation, output, employment, income and business activity.
Why Is Stagflation So Damaging?
Inflation reduces the purchasing power of wages and savings. Stagnation limits wage growth, investment, sales and employment. When both occur together, households pay more while their real income and economic security weaken.
Companies face a similar squeeze. Energy, materials, transport and labor costs may rise while customer demand slows. Businesses with strong pricing power can pass on part of the increase, but weaker companies may suffer falling margins, hiring freezes, reduced investment or insolvency.
Governments can also be constrained. Fiscal support may cushion household income and demand, but broad stimulus can add to inflation or borrowing requirements. Austerity can reduce demand further. Stagflation therefore narrows the range of painless policy choices.
What Causes Stagflation?
1. A Negative Supply Shock
A sharp rise in oil, gas, food, shipping or other essential input costs can reduce the economy’s ability to produce while raising prices. Companies either absorb the cost through lower profit margins or pass it to customers. Consumers then have less income available for other purchases.
This is why energy disruptions are a classic stagflation risk: energy is both a household expense and an input into manufacturing, agriculture, transport and services.
2. Trade Barriers and Supply-Chain Fragmentation
Tariffs, sanctions, export controls and disrupted trade routes can make imported goods and intermediate inputs more expensive. If businesses cannot quickly replace those inputs with efficient domestic production, the economy may experience higher costs and weaker output at the same time.
The result depends on scale, duration, exchange rates, exemptions, corporate margins and the ability of supply chains to adapt. A one-time price-level increase is not automatically persistent inflation, but repeated or broad shocks can become embedded in expectations and wage or pricing decisions.
3. Excess Demand Followed by Restrictive Policy
Inflation may begin when demand runs ahead of productive capacity. If policymakers wait too long to respond, inflation expectations can become more persistent. The later interest-rate increases required to restrain demand may then weaken housing, investment, credit and employment before inflation has fully returned to target.
4. Weak Productivity or Reduced Productive Capacity
An economy can stagnate when labor supply, capital formation, infrastructure or productivity growth weakens. If nominal spending continues growing faster than the economy’s capacity to supply goods and services, prices may rise despite poor real growth.
5. Inflation Expectations Become Unanchored
If households and businesses expect inflation to remain high, workers may demand larger nominal wage increases and companies may change prices more frequently. This does not mean wages alone cause inflation. It means expectations can help an original energy, demand or policy shock become more persistent.
The 1970s: The Classic Stagflation Example
The United States and other advanced economies experienced severe stagflation during the 1970s. Oil shocks sharply increased energy costs, productivity growth slowed and inflation expectations became entrenched. High inflation coexisted with unemployment and weak real activity—an outcome that challenged the once-popular assumption that inflation and unemployment would always move in opposite directions.
The eventual disinflation required very restrictive monetary policy under Federal Reserve Chair Paul Volcker. Inflation fell, but only after interest rates rose sharply and the economy experienced painful recessions. The lesson was not that every supply shock requires the same response. It was that allowing persistent inflation to become embedded can make the final adjustment more economically expensive.
Why Stagflation Creates a Federal Reserve Policy Trap
Congress has directed the Federal Reserve to pursue maximum employment and stable prices—its dual mandate. In a normal cycle, these goals are often complementary. During stagflation, they can pull policy in opposing directions.
- Raise interest rates: this can restrain demand and inflation expectations, but may further weaken investment, employment, housing and credit quality.
- Cut interest rates: this can support demand and financial conditions, but may prolong inflation, weaken the currency or damage policy credibility.
- Hold rates steady: this allows existing restraint and supply adjustments time to work, but risks falling behind whichever problem—growth or inflation—is worsening faster.
Monetary policy influences demand and financial conditions; it cannot directly produce oil, repair a shipping route, build a semiconductor plant or raise productivity. Supply-side problems may require energy, trade, infrastructure, competition or fiscal measures, while the central bank concentrates on preventing temporary price shocks from becoming persistent inflation.
How Does Stagflation Affect Financial Markets?
Stagflation can be difficult for a conventional stock-and-bond portfolio because weak growth pressures corporate earnings while persistent inflation pressures bond prices and interest-rate expectations. The market effect still depends on valuations, positioning, policy credibility and the source of the inflation shock.
Stocks
Slower real growth can reduce sales volumes, while higher input and financing costs squeeze profit margins. Higher required returns can also compress equity valuations. Companies with strong balance sheets, essential products and durable pricing power may be relatively resilient, but no sector is automatically protected.
Government and Corporate Bonds
Persistent inflation reduces the real value of fixed nominal payments and may push yields higher. Longer-duration bonds are especially sensitive to changes in yields. At the same time, a severe growth shock can create demand for government bonds, so nominal yields may become volatile rather than move in one direction. Credit spreads can widen if investors expect weaker profits and more defaults.
For a deeper explanation of the transmission mechanism, see Bond Yields Explained: What Yields Mean for the Economy and Financial Markets.
Inflation-Protected Bonds
Treasury Inflation-Protected Securities adjust principal with CPI and can provide direct inflation linkage. Their market price can nevertheless fall when real yields rise, and their performance depends on the inflation already priced into the market.
Commodities and Energy
Commodities may benefit when the stagflation shock originates in supply scarcity, particularly in energy or food. However, they are volatile and can reverse when demand destruction, new supply or geopolitical de-escalation changes the balance. BlackRock notes that commodities have historically performed well during high-inflation periods, but historical relationships are not guarantees.
Gold
Gold may benefit from inflation concern, geopolitical stress or declining confidence in policy. It can also struggle when real interest rates or the US dollar rise sharply. The important variables are not inflation alone, but real yields, currency moves, liquidity and risk perception.
The US Dollar
The dollar’s response is two-sided. Higher expected US rates can support it, while deteriorating growth, fiscal concern or reduced policy credibility can weaken it. During global stress, demand for dollar liquidity may temporarily dominate domestic fundamentals.
Stagflation vs Inflation, Recession and a Soft Landing
| Economic regime | Growth | Inflation | Typical policy problem |
|---|---|---|---|
| Inflationary expansion | Strong | High or rising | Cool demand without causing recession |
| Conventional recession | Contracting | Usually falling | Support demand and employment |
| Stagflation | Weak or contracting | Persistently high | Choose between inflation and growth risks |
| Soft landing | Positive but moderate | Falling toward target | Remove restraint without reigniting inflation |
Is the US Economy in Stagflation in 2026?
The latest data show stagflation pressure, but they do not yet provide an unambiguous stagflation diagnosis.
The Bureau of Labor Statistics reported that consumer prices rose 3.4% over the year to July 2026. In a separate release, nonfarm payroll employment changed little, declining by 23,000 in July, while unemployment was 4.1%.
The Bureau of Economic Analysis estimated that real GDP increased at a 1.5% annual rate in the second quarter, down from 2.1% in the first quarter. Its gross domestic purchases price index rose at a 5.7% annual rate. However, real final sales to private domestic purchasers increased 3.9%, showing that underlying private demand was stronger than the headline growth rate alone suggested.
These series use different concepts and time periods: the CPI figure is a twelve-month consumer-price change, whereas quarterly GDP and price-index figures are annualized changes from the preceding quarter. They should not be compared as though they were identical measures.
The balanced interpretation is therefore:
- Inflation remains above the Federal Reserve’s 2% longer-run objective;
- headline real growth has slowed;
- payroll momentum has weakened;
- but real output remains positive, unemployment has not surged and private domestic demand remains firm.
Reuters reported renewed market concern about stagflation as oil and trade costs threatened inflation while economic momentum weakened. Concern is justified; certainty is not. The next question is whether inflation proves persistent as employment, real income and private demand continue to lose momentum.
The Stagflation Dashboard: What Traders Should Watch
- Inflation breadth and persistence: headline and core CPI, core PCE, producer prices, import prices, rents, services and short-run annualized momentum.
- Real economic activity: real GDP, real final sales to private domestic purchasers, industrial production, retail volumes, housing and business investment.
- Employment quality: payrolls, revisions, unemployment, participation, weekly hours, temporary employment and initial and continuing claims.
- Real purchasing power: nominal wages and weekly earnings after adjusting for inflation, plus aggregate labor income.
- Business pipeline: new orders, inventories, delivery times and the prices-paid components of manufacturing and services surveys.
- Inflation expectations: household and professional surveys, Treasury breakeven inflation and inflation swaps.
- Supply shocks: oil, natural gas, food, metals, freight rates, port activity, inventories, tariffs and critical trade routes.
- Financial conditions: the policy rate, Treasury yields, real yields, credit spreads, the dollar, bank lending standards and mortgage rates.
- Corporate confirmation: profit margins, earnings guidance, pricing power, layoffs, capital expenditure and default rates.
The old “misery index”—the unemployment rate plus the annual inflation rate—is a useful shorthand for household pressure, but it is not a complete stagflation indicator. It omits GDP, participation, hours, real wages, productivity and the composition of inflation.
For a complete monitoring framework, see How to Read the Macro Economy: The Market Dashboard Every Trader Should Understand.
The Bottom Line
Stagflation is not simply “bad inflation” and it is not merely a slow quarter. It is a persistent collision between rising prices and weakening real activity, often accompanied by a deteriorating labor market.
For traders, the key is to identify whether growth and inflation are moving in opposite, unfavorable directions—and whether bond yields, commodities, credit, currencies and company guidance confirm the change. The label matters less than the regime: weak real growth, persistent price pressure and limited room for policymakers to respond.