U.S. stocks closed mixed to lower as 30-year Treasury yields hit 5.31% and Iran-driven oil gains lifted energy while pressuring equity valuations.
Fundamentals: U.S. equities ended mixed to lower as rising long-term Treasury yields and Iran-related oil strength pressured risk assets. The 30-year yield reached 5.31%, its highest level since 2007, while TLT fell to a 20-year low. Higher crude supported energy shares, and gold and other precious metals gained amid geopolitical concerns, inflation worries, and Treasury supply pressures.
Technicals: USO, IBIT and GLD led the listed ETF movers, while Tesla, Microsoft and Meta declined. Futures technical structures remained broadly bullish across ES, NQ, EMD and RTY, with prices testing or consolidating near pivot resistance. YM and FDAX showed more restrained short-term conditions despite constructive intermediate- and long-term trends.
After Market Close daily snapshot: market news summary and sentiment, major ETFs, Magnificent 7 analysis, Indices Futures Higher Time Frame Analysis, and E-mini S&P500, Nasdaq 100, NYMEX Crude, Gold Futures Daily Chart analysis.
As of: August 17, 2026 05:00 CT
Market News Summary:
Equities ended mixed to lower as Iran-related oil strength and a sharp rise in long Treasury yields pressured risk assets.
Primary Drivers & Risks:
- Primary Driver: Rising long-term Treasury yields
- Primary Risk: Iran conflict and oil shock
Tone:
Cautious, with cross-currents between equity resilience and rate pressure.
Stock Market / ETFs / Indices:
Stocks fluctuated after a strong multi-week S&P 500 advance, with the index retreating from record highs as yields and oil rose. Energy shares benefited from higher crude, while rate-sensitive equity valuations faced pressure. Commentary also highlighted elevated investor leverage, AI-bubble concerns, and increased dispersion among S&P 500 stocks.
Geopolitical:
Escalating U.S.-Iran tensions remained a central market catalyst. Statements indicating no urgency for an Iran agreement, alongside threats involving Oman, intensified concerns over broader Middle East conflict.
Oil / Energy:
WTI and Brent crude rose as Iran tensions increased supply-disruption concerns. The oil move supported the energy sector while adding to inflation and bond-market pressure; refiner stocks were also described as having had an unusually strong run.
Gold / Metals:
Gold, silver, and platinum gained, supported by a weaker dollar and reduced expectations of a near-term Fed rate increase. Higher oil prices and elevated Treasury yields coincided with demand for precious metals amid equity pressure.
Fed / Financials:
The 30-year Treasury yield rose to 5.31%, its highest level since 2007, while TLT reached a 20-year low. Treasury supply, the $40 trillion U.S. debt level, inflation concerns, stronger Empire Manufacturing data, and higher oil prices were cited as drivers of the bond sell-off. General Atlantic also revived its IPO effort with JPMorgan selected to lead the process.
Macro / Other:
Fiscal deficits and continued federal borrowing remained a macro concern, with commentary linking debt supply and inflation to bond-market volatility. Some equity outlooks remained constructive despite the rate and geopolitical backdrop.
Conclusion:
Long-dated Treasury yields and Iran-related oil gains were the dominant intraday forces. These developments weighed on broad equities while supporting energy and precious metals.
High Treasury supply, inflation concerns, and U.S. debt levels reinforced the bond sell-off. Equity-market leverage, AI financing concerns, and elevated stock dispersion added risk-sensitive cross-currents.
Market News Sentiment
Market News Articles: 40
- Neutral: 52.50%
- Positive: 25.00%
- Negative: 22.50%
Sentiment Summary: Market news sentiment is predominantly neutral at 53%, with positive articles at 25% and negative articles at 23%.
Conclusion: Indices futures coverage reflects a largely balanced news tone, with positive and negative sentiment relatively close.
GLD,Gold Articles: 13
- Positive: 61.54%
- Neutral: 38.46%
Sentiment Summary: Gold-related coverage is moderately positive, with 62% positive and 38% neutral articles across 13 items.
Conclusion: The news tone for GLD/Gold is positive overall, with no negative articles reported.
USO,Oil Articles: 8
- Neutral: 50.00%
- Negative: 37.50%
- Positive: 12.50%
Sentiment Summary: USO and oil coverage is neutral overall, with 50% neutral, 38% negative, and 13% positive articles.
Conclusion: Oil-related news tone is balanced but tilted negative, which may be relevant to energy-sensitive index futures sectors.
Market Data Snapshot
ETF Snapshot of major stock market ETFs, Mag7, and others as of: August 17, 2026 05:00
Top Movers & Losers
- USO 130.29 Bullish 2.91% ▲
- IBIT 36.42 Bullish 2.22% ▲
- GLD 405.49 Bullish 1.00% ▲
- TSLA 339.30 Bearish -0.87% ▼
- MSFT 480.35 Bearish -3.04% ▼
- META 568.97 Bearish -3.54% ▼
Major Index ETFs: SPY, QQQ, DIA, IWM, IJH
- QQQ 729.87 Bearish -0.16% ▼
- IJH 78.48 Bearish -0.24% ▼
- IWM 304.06 Bearish -0.34% ▼
- SPY 772.67 Bearish -0.47% ▼
- DIA 534.19 Bearish -0.49% ▼
Major index ETFs were Bearish across the group: DIA led the declines at -0.49%, followed by SPY at -0.47%, IWM at -0.34%, and IJH at -0.24%. QQQ was the least negative mover at -0.16%.
Mag 7 Stocks: AAPL, MSFT, GOOG, AMZN, META, NVDA, TSLA
- NVDA 225.01 Bearish -0.07% ▼
- AAPL 305.59 Bearish -0.11% ▼
- AMZN 261.31 Bearish -0.51% ▼
- GOOG 341.45 Bearish -0.61% ▼
- TSLA 339.30 Bearish -0.87% ▼
- MSFT 480.35 Bearish -3.04% ▼
- META 568.97 Bearish -3.54% ▼
Mag7 is Bearish throughout: META leads losses at -3.54%, followed by MSFT at -3.04%. TSLA -0.87%, GOOG -0.61%, and AMZN -0.51% are also Bearish, while NVDA is the least negative mover at a marginal -0.07%; AAPL is near-flat Bearish at -0.11%.
Cross-Market ETFs: TLT, GLD, USO, IBIT
- USO 130.29 Bullish 2.91% ▲
- IBIT 36.42 Bullish 2.22% ▲
- GLD 405.49 Bullish 1.00% ▲
- TLT 81.35 Bearish -0.84% ▼
Other ETFs are Mixed: USO is the most bullish mover at +2.91%, followed by IBIT at +2.22% and GLD at +1.00%. TLT is the most bearish mover at -0.84%.
ETF, Mag7, and Cross-Market ETF Insights
Overall Tone
Mixed, with Bearish equity ETFs and Mag7 shares alongside Bullish commodities, gold, and bitcoin exposure; USO led all instruments at +2.91%, while META was the most Bearish at -3.54%.
Equity ETFs and Mag7:
Major Index ETFs were uniformly Bearish: QQQ was the least negative at -0.16%, while DIA was the most Bearish index ETF at -0.49%; SPY fell -0.47%, IWM -0.34%, and IJH -0.24%. Mag7 performance was also Bearish and more selective, with near-flat NVDA at -0.07% and AAPL at -0.11% versus larger losses in MSFT at -3.04% and META at -3.54%, the group’s most Bearish mover.
Cross-Market ETFs:
Cross-market ETFs were Mixed, with Bullish USO at +2.91%, IBIT at +2.22%, and GLD at +1.00% diverging from Bearish equities. USO was the most Bullish cross-market mover, while TLT was the most Bearish at -0.84%.
Futures Indices – Higher Time Frame Analysis
Summary of the current state of US Indices Futures based on higher time-frame (HTF) technical analysis as of: 2026-08-17: 17:00 CT.
US Indices Futures
- ES: YSFG/MSFG/WSFG above F0%, rising benchmarks, UTrend, testing 7838.50 resistance; 7670.50 and 7454.00 pivots support.
- NQ: YSFG/MSFG/WSFG above F0%, rising benchmarks, advancing pivots; 30343 current pivot, 30975.50–31090.00 resistance, 29164.50 support.
- YM: YSFG/MSFG constructive, WSFG below F0% and short; rising benchmarks, 54884 resistance, 53680 and 52546 pivot supports.
- EMD: YSFG/MSFG bullish, WSFG below F0%; rising benchmarks and higher pivots; 3947 resistance, 3725.3 reversal pivot, 3604.7 support.
- RTY: YSFG/MSFG bullish, WSFG below F0%; rising benchmarks and UTrend pivots; 3079.9 resistance, 2969.9 pivot, 2902.3 support.
- FDAX: YSFG/MSFG bullish, WSFG below F0%; benchmarks rising, 26665–26685 resistance, 26119 pivot, 25841–25490 support.
Overall State
- Short-Term: Bullish
- Intermediate-Term: Bullish
- Long-Term: Bullish
Conclusion
US index futures retain aligned intermediate- and long-term higher-high, higher-low structures, supported by rising benchmark averages and constructive YSFG/MSFG conditions. ES and NQ lead near pivot-high resistance, while RTY and EMD also press upper pivots. YM and FDAX show short-term consolidation, and WSFG readings are below F0% in YM, EMD, RTY, and FDAX. Current resistance levels define active upside pivot tests; listed next-pivots and benchmark zones define lower structural references.
Note: Intra-day counter-trend pullbacks or retracements may occur, HTF is context for informational usage and market structure. Glossary: Session Fib Grids periods of YSFG:’Yearly’, MSFG:’Monthly’, WSFG:’Weekly’
For full details visit: AlphaWebTrader Technicals
ES Daily View
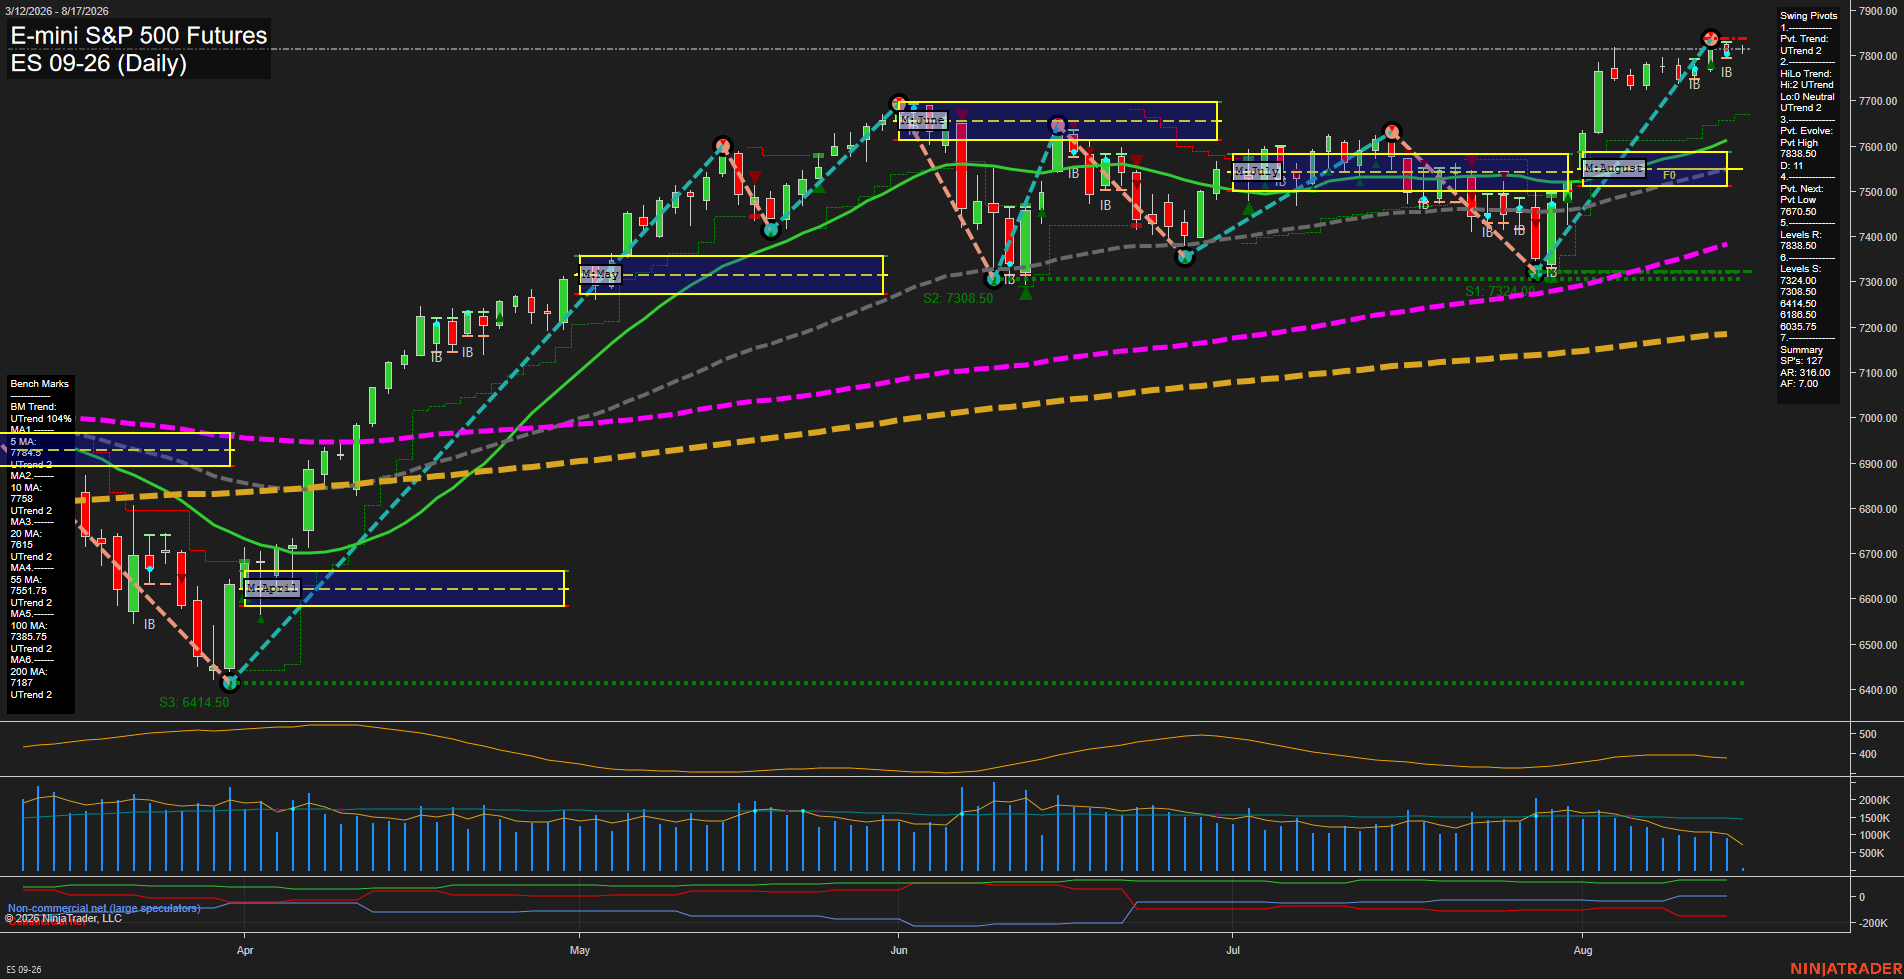
Overall Rating
- Short-Term: Bullish
- Intermediate-Term: Bullish
- Long-Term: Bullish.
Key Insights Summary
Price action completed a sharp August recovery from the 7308.50 pivot-support area and expanded to a new 7838.50 pivot high. Short-term momentum is fast, while small bars near the high show the rally is consolidating after an impulsive advance. Price is above the weekly, monthly, and yearly Fib-grid reference zones and all six rising benchmark averages, confirming broad multi-timeframe trend alignment. The 7838.50 pivot is the immediate breakout reference, while 7670.50 defines the next short-term pivot-reversal threshold; deeper structural support remains clustered near 7348.50 and 7308.50.
View charts on: AlphaWebTrader HTF Charts
NQ Daily View
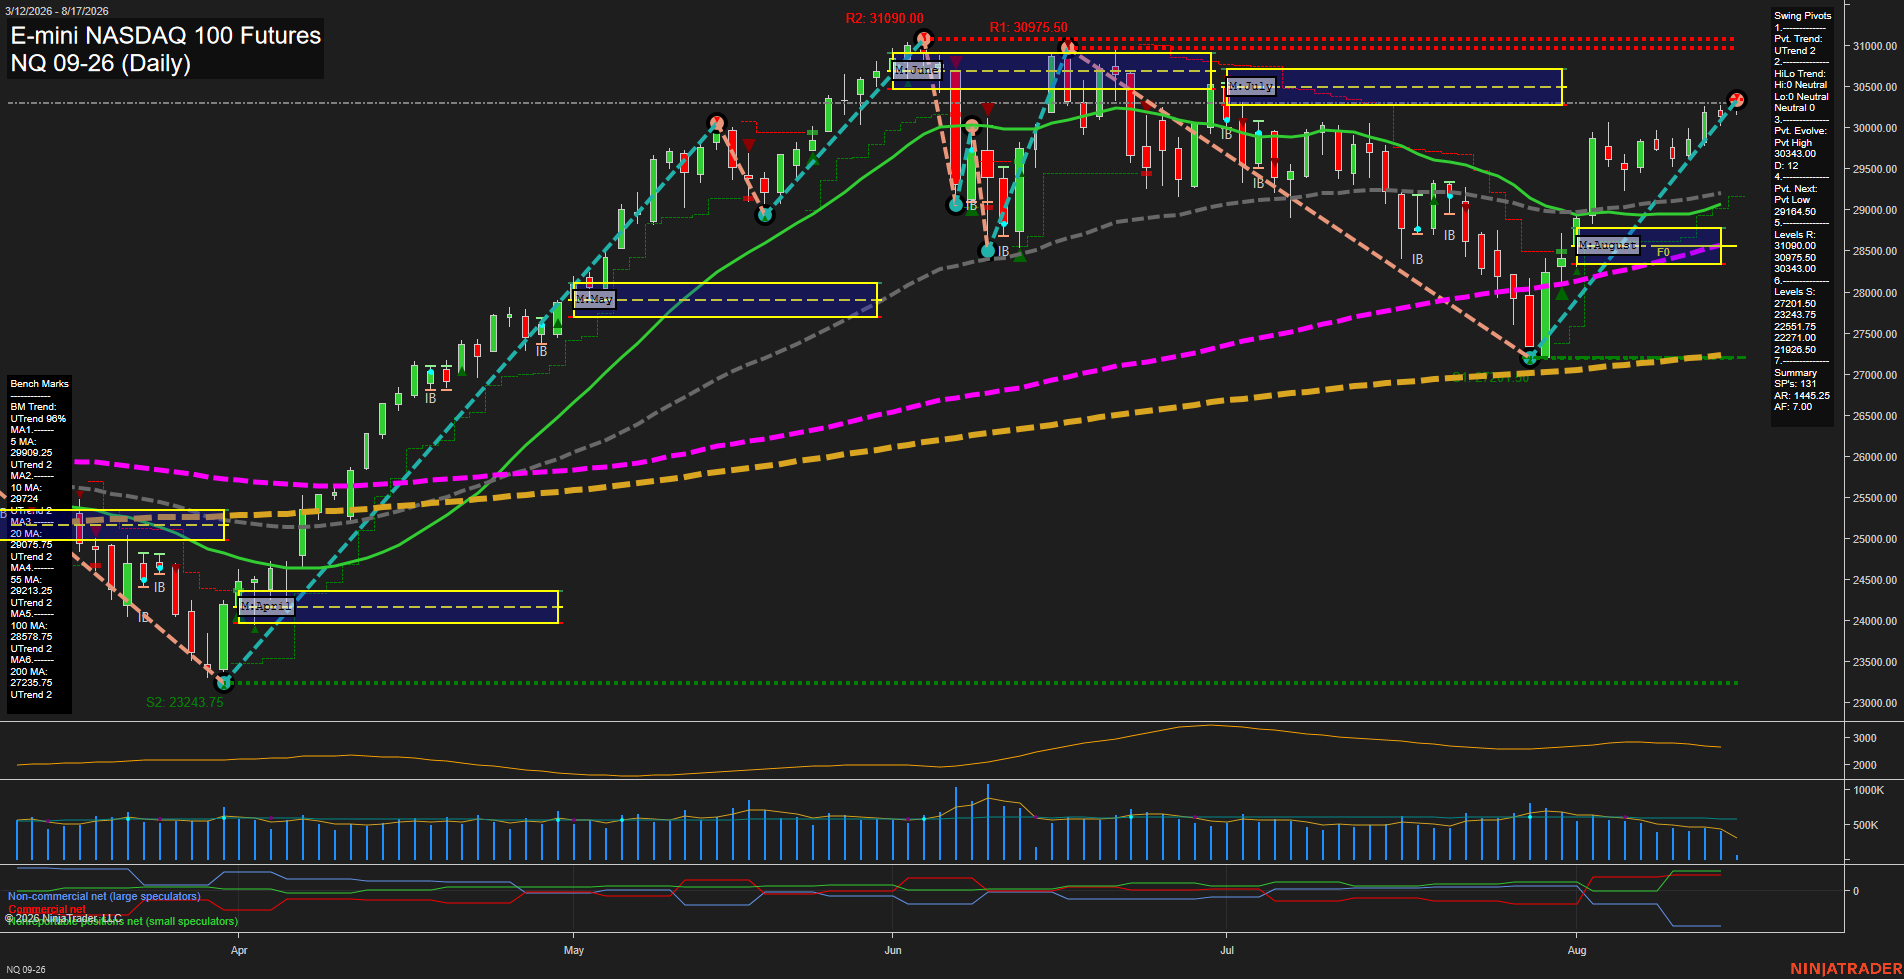
Overall Rating
- Short-Term: Bullish
- Intermediate-Term: Bullish
- Long-Term: Bullish.
Key Insights Summary
NQ has completed a sharp V-style recovery from the late-July/early-August selloff and is pressing into a new short-term pivot high near 30343. Price is above all rising daily benchmarks, while the weekly, monthly, and yearly Fib-grid readings remain positive. The immediate structure is bullish, although the 30975.50 to 31090.00 pivot-resistance band defines the prior high area overhead. The 29164.50 next-pivot level remains the key short-term structural reference beneath the rally.
View charts on: AlphaWebTrader HTF Charts
CL Daily View
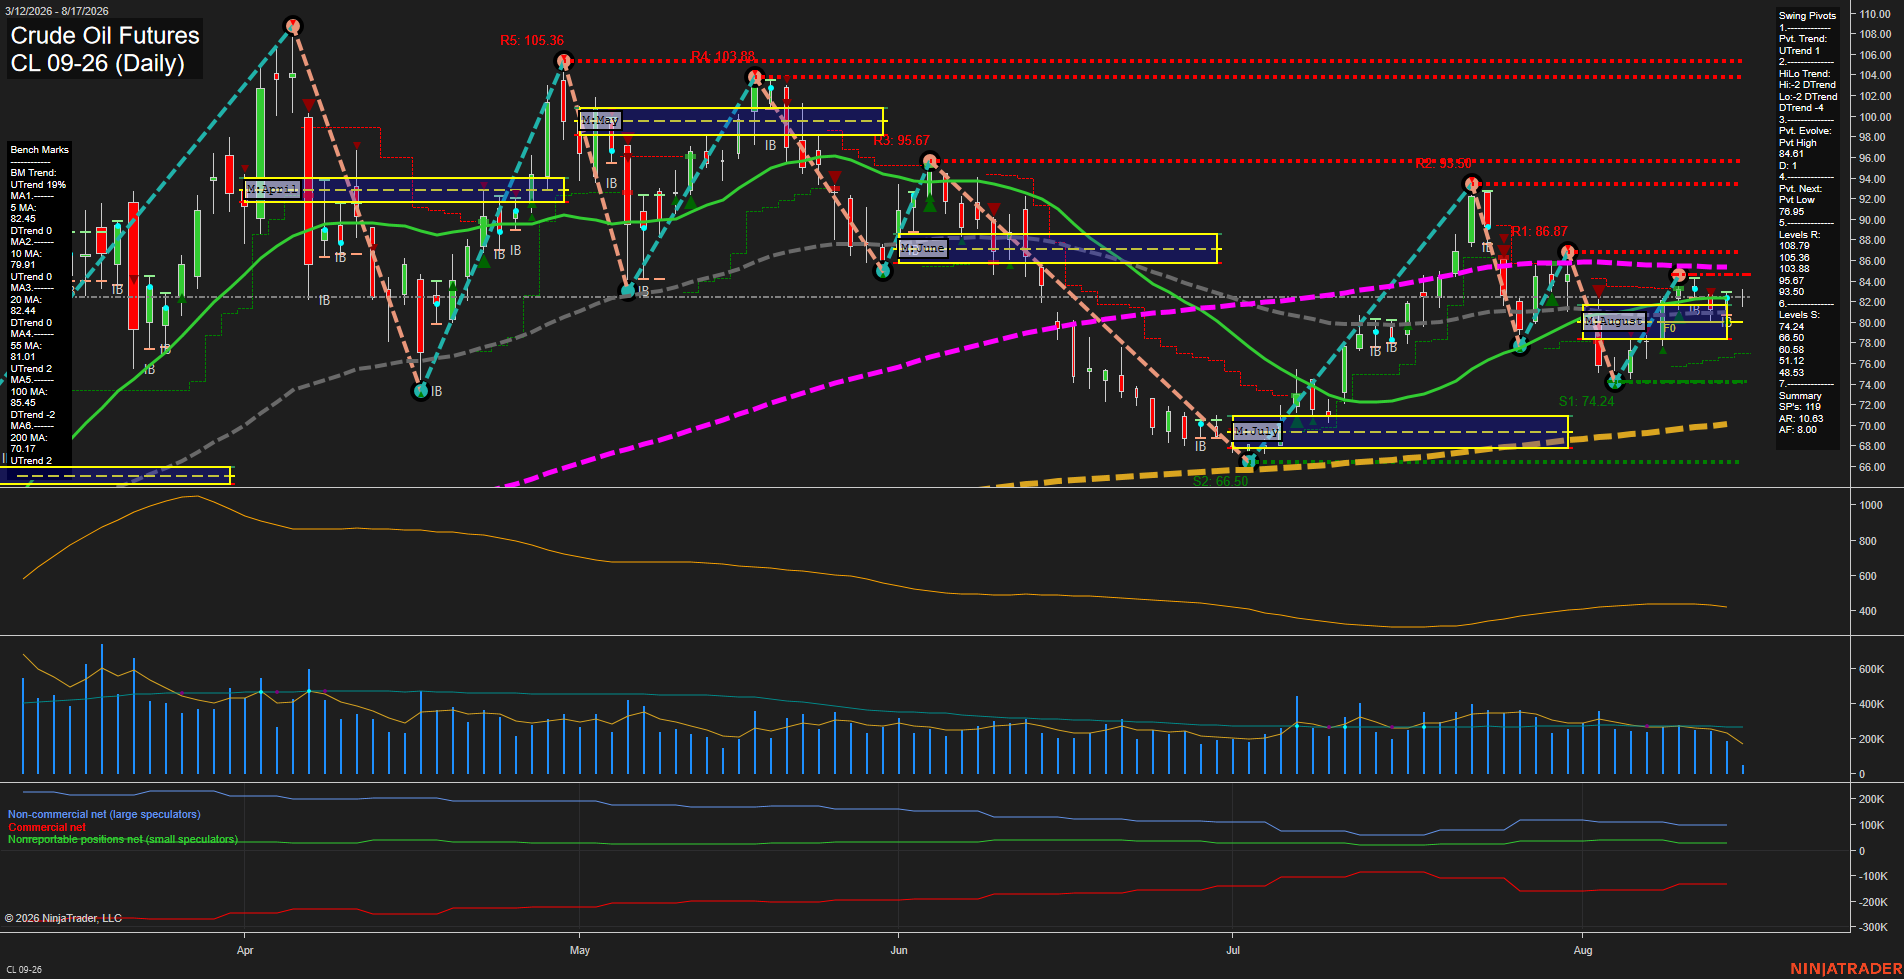
Overall Rating
- Short-Term: Bullish
- Intermediate-Term: Neutral
- Long-Term: Bullish.
Key Insights Summary
CL is consolidating near 83.67 following a sharp July-to-August recovery. Short-term structure remains constructive through higher lows, positive 5-day and 10-day benchmark trends, and an active UTrend pivot condition, although price remains marginally below the weekly F0% area. Intermediate structure is mixed: the monthly grid remains positive and price is above the 55-day average, while the 20-day average is declining and the broader HiLo pivot trend remains down. Long-term conditions retain a bullish foundation above the rising 200-day average and positive yearly grid, but the declining 100-day average near 85.45 remains an overhead trend reference. Recent small daily bars and subdued momentum reflect compression beneath the 84.61 pivot-evolve level, with 93.50 as the nearest larger pivot resistance and 74.24 as major confirmed swing support.
View charts on: AlphaWebTrader HTF Charts
GC Daily View
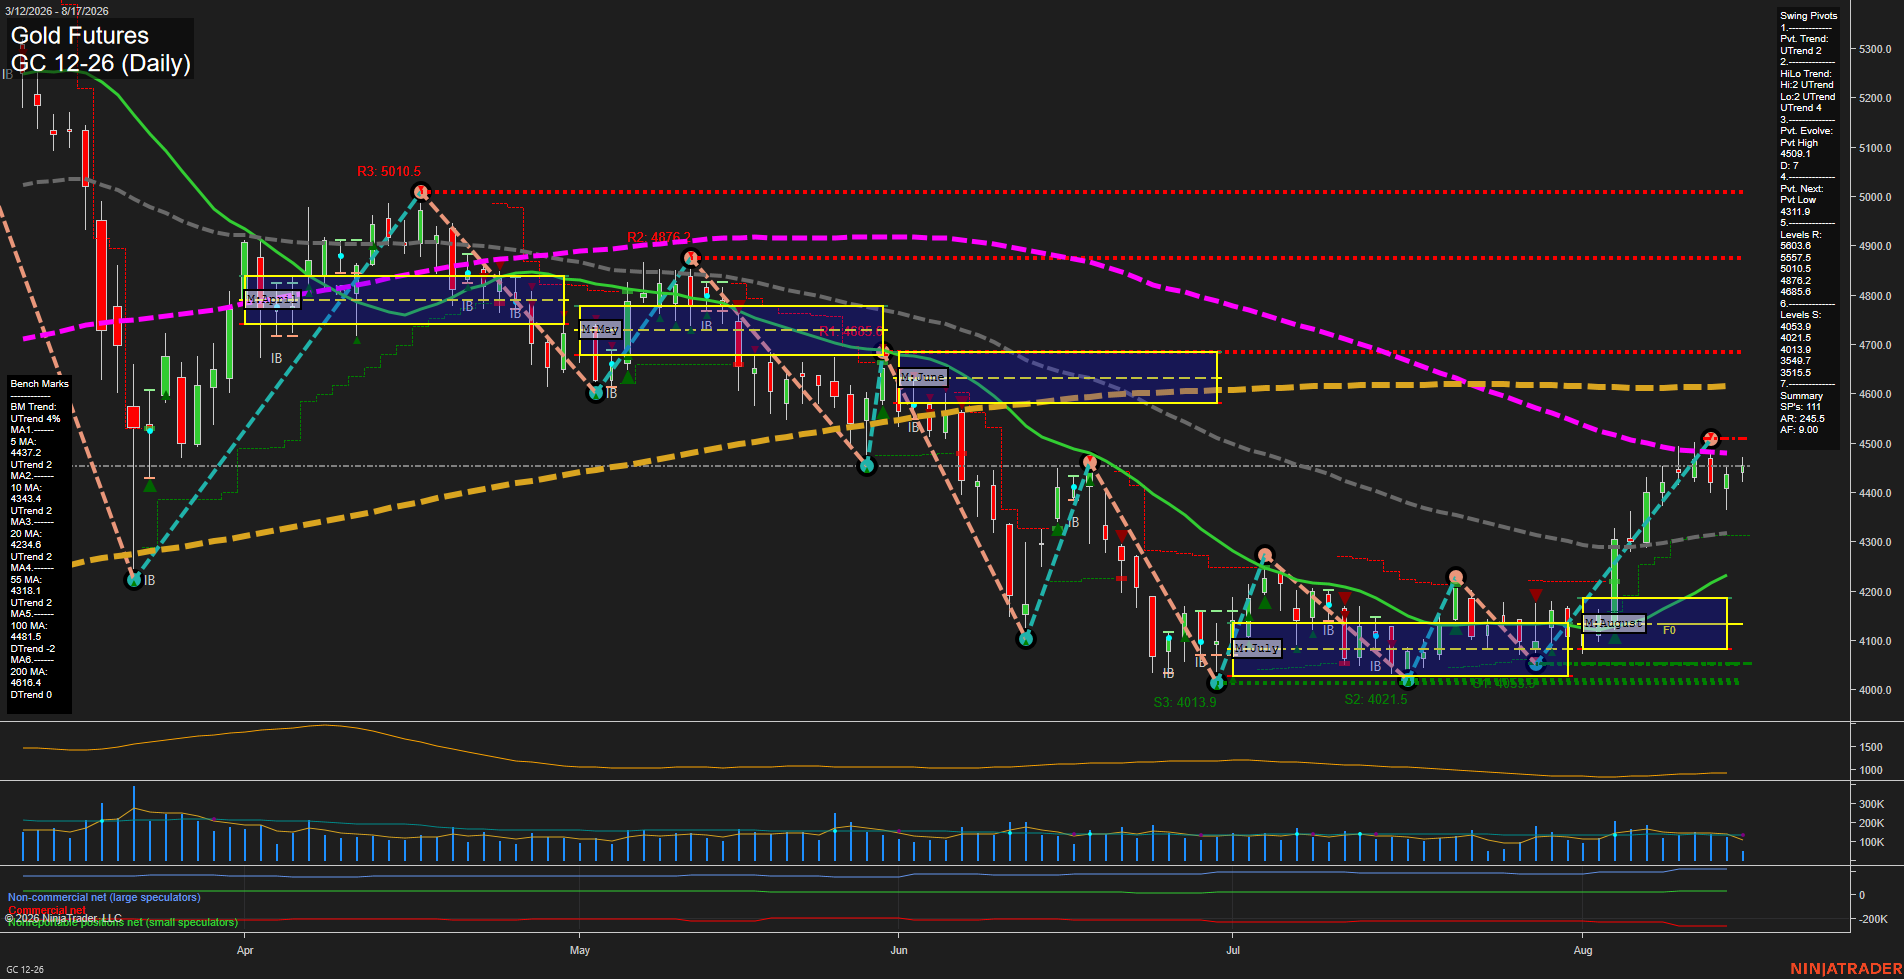
Overall Rating
- Short-Term: Bullish
- Intermediate-Term: Bullish
- Long-Term: Bearish.
Key Insights Summary
Gold has produced a sharp August recovery from the 4,000 support area, establishing a short-term UTrend and reclaiming the 5-, 10-, 20-, and 55-day benchmarks. The advance is consolidating below the active 4509.1 pivot high and the declining 100-day benchmark at 4481.5, creating a nearby resistance and test zone. Weekly and monthly fib-grid positioning remains above F0%, supporting the short- and intermediate-term recovery structure, while the yearly grid and declining 100- and 200-day averages retain a broader long-term downtrend backdrop. Price action is currently narrow and momentum has slowed following the fast rally, indicating consolidation beneath resistance rather than an expanded breakout phase.
View charts on: AlphaWebTrader HTF Charts