NYSE pre-market radar tracks ETF movers, futures trends, oil above $90, rising Treasury yields and cautious equities amid Middle East tensions.
Fundamentals: U.S. equity futures enter a cautious session as Middle East tensions raise concerns over Strait of Hormuz shipping and push Brent crude above $90 a barrel. The S&P 500 ended lower, while Asia traded mixed. A Treasury selloff lifted the 30-year yield to a 19-year high, adding pressure to extended equity valuations as gold gained on safe-haven demand.
Technicals: Pre-market market data showed gains in USO, IBIT and GLD, while Tesla, Microsoft and Meta declined in the prior session. Futures analysis indicated bullish intermediate- and long-term structures across major U.S. and European contracts, though several markets faced short-term pullbacks or consolidation near pivot resistance after strong August advances.
Pre-Market Trading 360° view Market Radar of: holidays, earnings, eco-news, market-news summary, news sentiment, prior session major ETFs, MAG7, Higher Time Frame Analysis Indices Futures Summary, and E-mini S&P500, Nasdaq 100, NYMEX Crude, Gold Futures Daily Chart analysis.
As of: August 18, 2026 07:16 CT
EcoNews Radar U.S. Events
| Day | Time | Impact | Event |
|---|---|---|---|
| Wed | 10:30 | Low | Crude Oil Inventories |
| Wed | 14:00 | High | FOMC Meeting Minutes |
| Thu | 08:30 | Medium | Philly Fed Manufacturing Index |
| Thu | 08:30 | Medium | Unemployment Claims |
EcoNews Summary
Wednesday contains the week’s primary listed market-moving event: the release of FOMC Meeting Minutes at 14:00. The same day’s crude oil inventory report provides petroleum-supply and energy-price context. Thursday’s medium-impact manufacturing and unemployment reports are excluded because they are not energy-related.
Event Notes:
- Wednesday 10:30 — USD Crude Oil Inventories: A weekly measure of changes in U.S. commercial crude stockpiles. Index futures traders monitor the report for petroleum supply conditions, energy-price pressure, and related inflation context.
- Wednesday 14:00 — USD FOMC Meeting Minutes: A detailed record of the Federal Reserve’s policy discussion, including views on inflation, economic conditions, and interest rates. Traders monitor the minutes for context on monetary-policy communication and broader equity-index sensitivity to rates.
Conclusion:
The single most important event is Wednesday at 14:00, the USD FOMC Meeting Minutes. Market momentum and volume often slow ahead of major events such as FOMC releases, with increased volatility at release time. Wednesday’s crude inventory data adds energy-supply context earlier in the session.
For full details visit: Forex Factory EcoNews
Market News Summary:
Indices futures face a cross-current session shaped by Middle East escalation, higher oil, and a Treasury-market selloff against still-elevated equity positioning.
Primary Drivers & Risks:
- Primary Driver: Middle East supply disruption fears
- Primary Risk: Surging long-term Treasury yields
Tone:
Cautious and volatility-sensitive.
Stock Market / ETFs / Indices:
The S&P 500 closed at 7,745.06, down 0.52% and about 0.7% below its August 13 record close. All three major U.S. indexes lost ground in a quiet session, while Japan’s Nikkei fell 0.7% following Wall Street’s decline. South Korea’s KOSPI rose more than 3% after reopening from a holiday, lifting the broader Asia-Pacific index outside Japan.
Geopolitical:
U.S.-Iran negotiations over reopening the Strait of Hormuz showed no progress. The U.S.-Iran ceasefire expired, Iran adopted a more offensive posture, and Trump threatened Oman, increasing concerns around the Middle East conflict and shipping routes.
Oil / Energy:
Oil rose as fading U.S.-Iran peace hopes and Hormuz shipping risks increased energy-supply concerns. Brent crude moved above $90 a barrel for the first time since July 30. Natural gas faced separate pressure from record U.S. production and ample storage.
Gold / Metals:
Gold gained as reduced Fed-hike expectations weighed on the dollar, while Iran tensions supported safe-haven demand. Gold and silver also reflected broader support from fiscal stress, dollar weakness, Chinese demand, and constrained resource supply.
Fed / Financials:
The 30-year Treasury yield reached a 19-year high, with government debt concerns and heavy AI-related capital spending cited in the bond selloff. Rising long-term yields remain a central equity-market pressure point, even as stocks have so far absorbed the move. Fed minutes and the rate outlook remain in focus.
Macro / Other:
Equity breadth remains strong but extended: S&P 500 new highs have exceeded new lows for 38 consecutive sessions, and the index has repeatedly traded more than two standard deviations above its 50-day moving average. Fund managers reported unusually bullish stock allocations despite concerns around rates, growth, political instability, and AI spending. Market outlooks remain divided between bullish S&P 500 targets and warnings of an AI-bubble reversal.
Conclusion:
Middle East developments and the resulting oil-price advance are the immediate catalysts for risk-sensitive futures trading. The long-end Treasury selloff adds a second major macro input.
Elevated equity positioning and extended technical conditions leave markets sensitive to adverse headlines. Gold strength and Asia’s mixed performance underscore the uneven response across asset classes.
Market News Sentiment
Market News Articles: 38
- Neutral: 52.63%
- Positive: 23.68%
- Negative: 23.68%
Sentiment Summary: Market news sentiment is predominantly neutral (53%), with positive and negative coverage evenly balanced at 24% each across 38 articles.
Conclusion: Indices futures-related news flow shows a neutral overall tone without a directional imbalance in positive versus negative coverage.
GLD,Gold Articles: 13
- Positive: 69.23%
- Neutral: 23.08%
- Negative: 7.69%
Sentiment Summary: GLD/Gold coverage is predominantly positive at 69%, with 23% neutral and 8% negative articles.
Conclusion: Gold-related news tone is positive overall, indicating favorable sentiment in the snapshot.
USO,Oil Articles: 10
- Positive: 40.00%
- Negative: 30.00%
- Neutral: 30.00%
Sentiment Summary: USO/Oil coverage is mixed, with 40% positive, 30% negative, and 30% neutral articles.
Conclusion: Oil-related news tone is slightly positive overall, while negative and neutral coverage remain substantial.
Market Data Snapshot
ETF Snapshot of major stock market ETFs, Mag7, and others as of: August 18, 2026 07:16
Top Movers & Losers
- USO 130.29 Bullish 2.91% ▲
- IBIT 36.42 Bullish 2.22% ▲
- GLD 405.49 Bullish 1.00% ▲
- TSLA 339.30 Bearish -0.87% ▼
- MSFT 480.35 Bearish -3.04% ▼
- META 568.97 Bearish -3.54% ▼
Major Index ETFs: SPY, QQQ, DIA, IWM, IJH
- QQQ 729.87 Bearish -0.16% ▼
- IJH 78.48 Bearish -0.24% ▼
- IWM 304.06 Bearish -0.34% ▼
- SPY 772.67 Bearish -0.47% ▼
- DIA 534.19 Bearish -0.49% ▼
Major index ETFs are Bearish across the group: DIA is the most bearish mover at -0.49%, followed by SPY at -0.47%. IWM declined -0.34% and IJH fell -0.24%, while QQQ is the least negative mover at -0.16%.
Mag 7 Stocks: AAPL, MSFT, GOOG, AMZN, META, NVDA, TSLA
- NVDA 225.01 Bearish -0.07% ▼
- AAPL 305.59 Bearish -0.11% ▼
- AMZN 261.31 Bearish -0.51% ▼
- GOOG 341.45 Bearish -0.61% ▼
- TSLA 339.30 Bearish -0.87% ▼
- MSFT 480.35 Bearish -3.04% ▼
- META 568.97 Bearish -3.54% ▼
Cross-Market ETFs: TLT, GLD, USO, IBIT
- USO 130.29 Bullish 2.91% ▲
- IBIT 36.42 Bullish 2.22% ▲
- GLD 405.49 Bullish 1.00% ▲
- TLT 81.35 Bearish -0.84% ▼
Other ETFs are Mixed: USO is the most bullish mover at +2.91%, followed by IBIT at +2.22% and GLD at +1.00%. TLT is the most bearish mover at -0.84%.
ETF, Mag7, and Cross-Market ETF Insights
Overall Tone
Mixed, with broad Bearish equity ETF and Mag7 action alongside Bullish strength in energy, bitcoin, and gold ETFs.
Equity ETFs and Mag7:
Major Index ETFs: SPY -0.47%, QQQ -0.16%, IWM -0.34%, IJH -0.24%, and DIA -0.49% were broadly Bearish; QQQ was the least negative mover, while DIA led the downside among index ETFs.
Mag7: The group was uniformly Bearish, led lower by META -3.54% and MSFT -3.04%; TSLA -0.87%, GOOG -0.61%, and AMZN -0.51% also declined. NVDA -0.07% and AAPL -0.11% were marginal to near-flat, with NVDA the least negative mover; META was the most bearish mover across equities.
Cross-Market ETFs:
USO +2.91% was the most bullish mover in the full snapshot, with IBIT +2.22% and GLD +1.00% also Bullish, diverging from Bearish equities. TLT -0.84% was the most bearish cross-market ETF, indicating bond ETF weakness alongside commodity, bitcoin, and gold strength.
Futures Indices – Higher Time Frame Analysis
Summary of the current state of US Indices Futures based on higher time-frame (HTF) technical analysis as of: 2026-08-18: 07:16 CT.
US Indices Futures
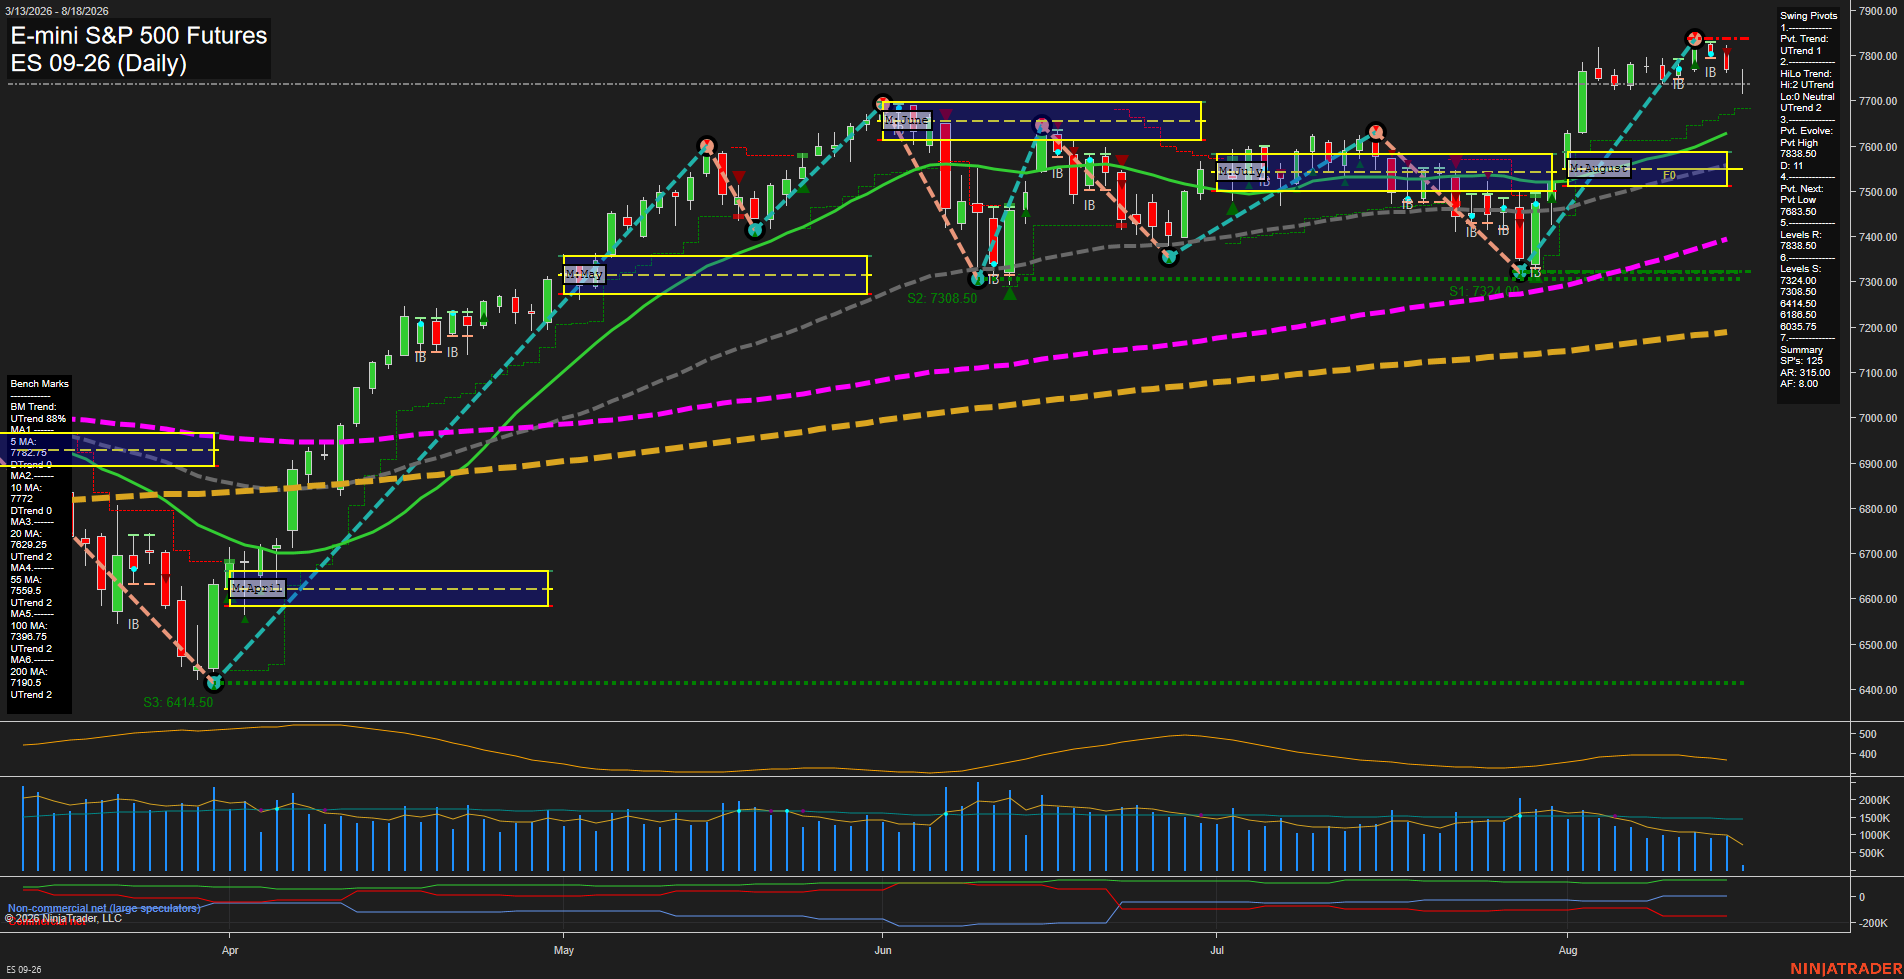
- ES: YSFG/MSFG up, WSFG down; above rising benchmarks; 7838.50 resistance, 7683.50 and 7450.50 swing support; short-term pullback within bullish pivots.
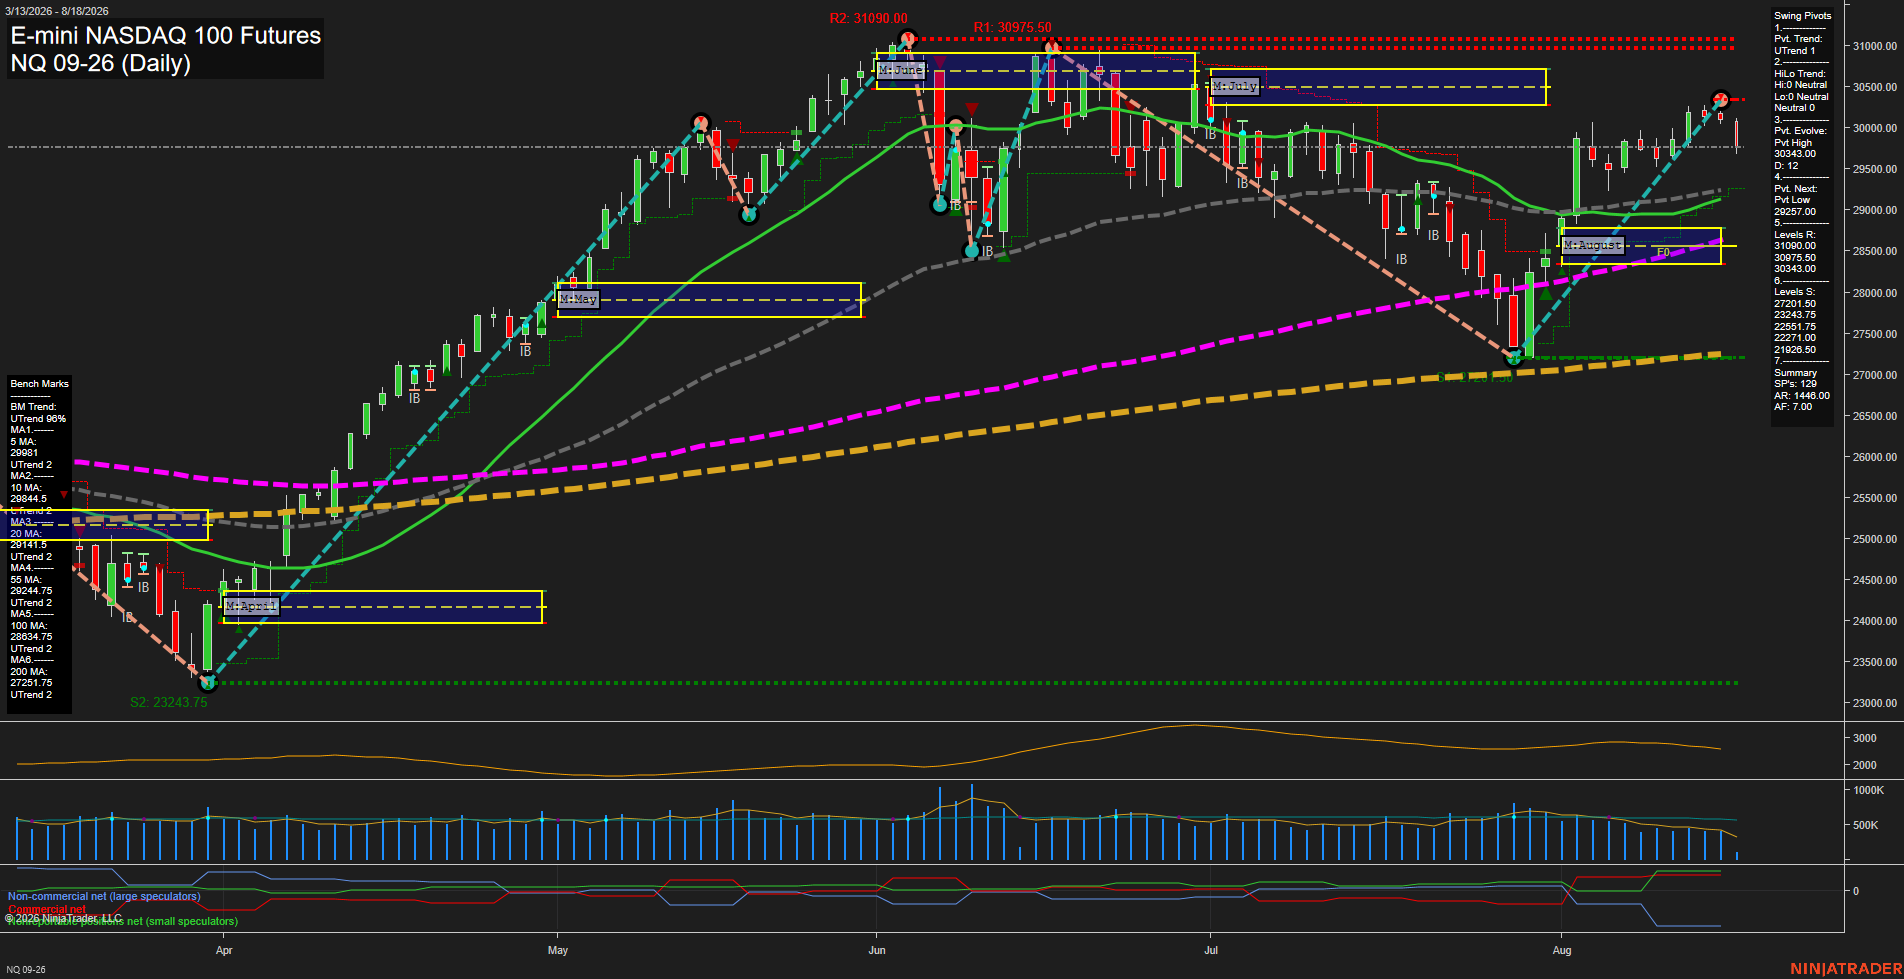
- NQ: YSFG/MSFG up, WSFG down; above benchmarks; 30343 resistance, 30975.50-31090 overhead, 29257 pivot support; short-term rotation, bullish higher structure.
- YM: YSFG/MSFG above F0%, WSFG down; above 20-200 benchmarks but below 5/10; 54884 resistance, 53380 support, 52444 reversal threshold.
- EMD: YSFG/MSFG up, WSFG below F0%; above benchmarks; 3941.7 resistance, 3930.5 support, 3849.7 reversal level; pivot trends remain up.
- RTY: YSFG/MSFG up, WSFG below F0%; above benchmarks; 3071.8-3079.9 resistance, 2879.5 pivot support; short-term conditions mixed within uptrend.
- FDAX: YSFG/MSFG above F0%, WSFG down; above major benchmarks, below 5-day; 26865 resistance, 26141 reversal level, 25155 weekly threshold.
Overall State
- Short-Term: Bearish
- Intermediate-Term: Bullish
- Long-Term: Bullish
Conclusion
Intermediate- and long-term correlations remain bullish across all indices, supported by rising major benchmarks, upward pivot structures, and YSFG/MSFG alignment. WSFG readings are down or below F0% across most contracts, while ES, NQ, RTY, EMD, and FDAX test or consolidate near swing-high resistance. YM and FDAX show the weakest short-term benchmark alignment. Resistance references are 7838.50 ES, 30343 NQ, 54884 YM, 3941.7 EMD, 3079.9 RTY, and 26865 FDAX; listed pivot levels define the nearby support and reversal structure.
Note: Intra-day counter-trend pullbacks or retracements may occur, HTF is context for informational usage and market structure. Glossary: Session Fib Grids periods of YSFG:’Yearly’, MSFG:’Monthly’, WSFG:’Weekly’
For full details visit: AlphaWebTrader Technicals
ES Daily View
Overall Rating
- Short-Term: Bullish
- Intermediate-Term: Bullish
- Long-Term: Bullish.
Key Insights Summary
Price is consolidating near the 7838.50 pivot high after a sharp August advance, with small daily bars and slowing momentum indicating a mature, relatively compressed upswing. The weekly fib-grid remains countertrend down while price holds above the rising 5-, 10-, 20-, 55-, 100-, and 200-day benchmarks. Intermediate- and long-term structure remains constructive through higher pivot lows and aligned rising averages; 7838.50 is the immediate swing-high reference, while 7683.50 defines the next pivot-reversal level.
View charts on: AlphaWebTrader HTF Charts
NQ Daily View
Overall Rating
- Short-Term: Neutral
- Intermediate-Term: Bullish
- Long-Term: Bullish.
Key Insights Summary
NQ completed a rapid V-shaped recovery from the late-July 27201.50 swing low and reached a new short-term pivot high at 30343.00. The current medium red bar reflects a pullback from that pivot high, while the weekly fib grid remains down and the two current short-term signal readings are short. Price remains above the rising 5-, 10-, 20-, 55-, 100-, and 200-day benchmarks, preserving constructive intermediate- and long-term structure. The 29257.00 pivot-next level and the clustered 20/55-day averages near 29142-29245 define the principal retracement structure beneath current price, while 30343.00, 30975.50, and 31090.00 remain the overhead pivot-resistance sequence.
View charts on: AlphaWebTrader HTF Charts
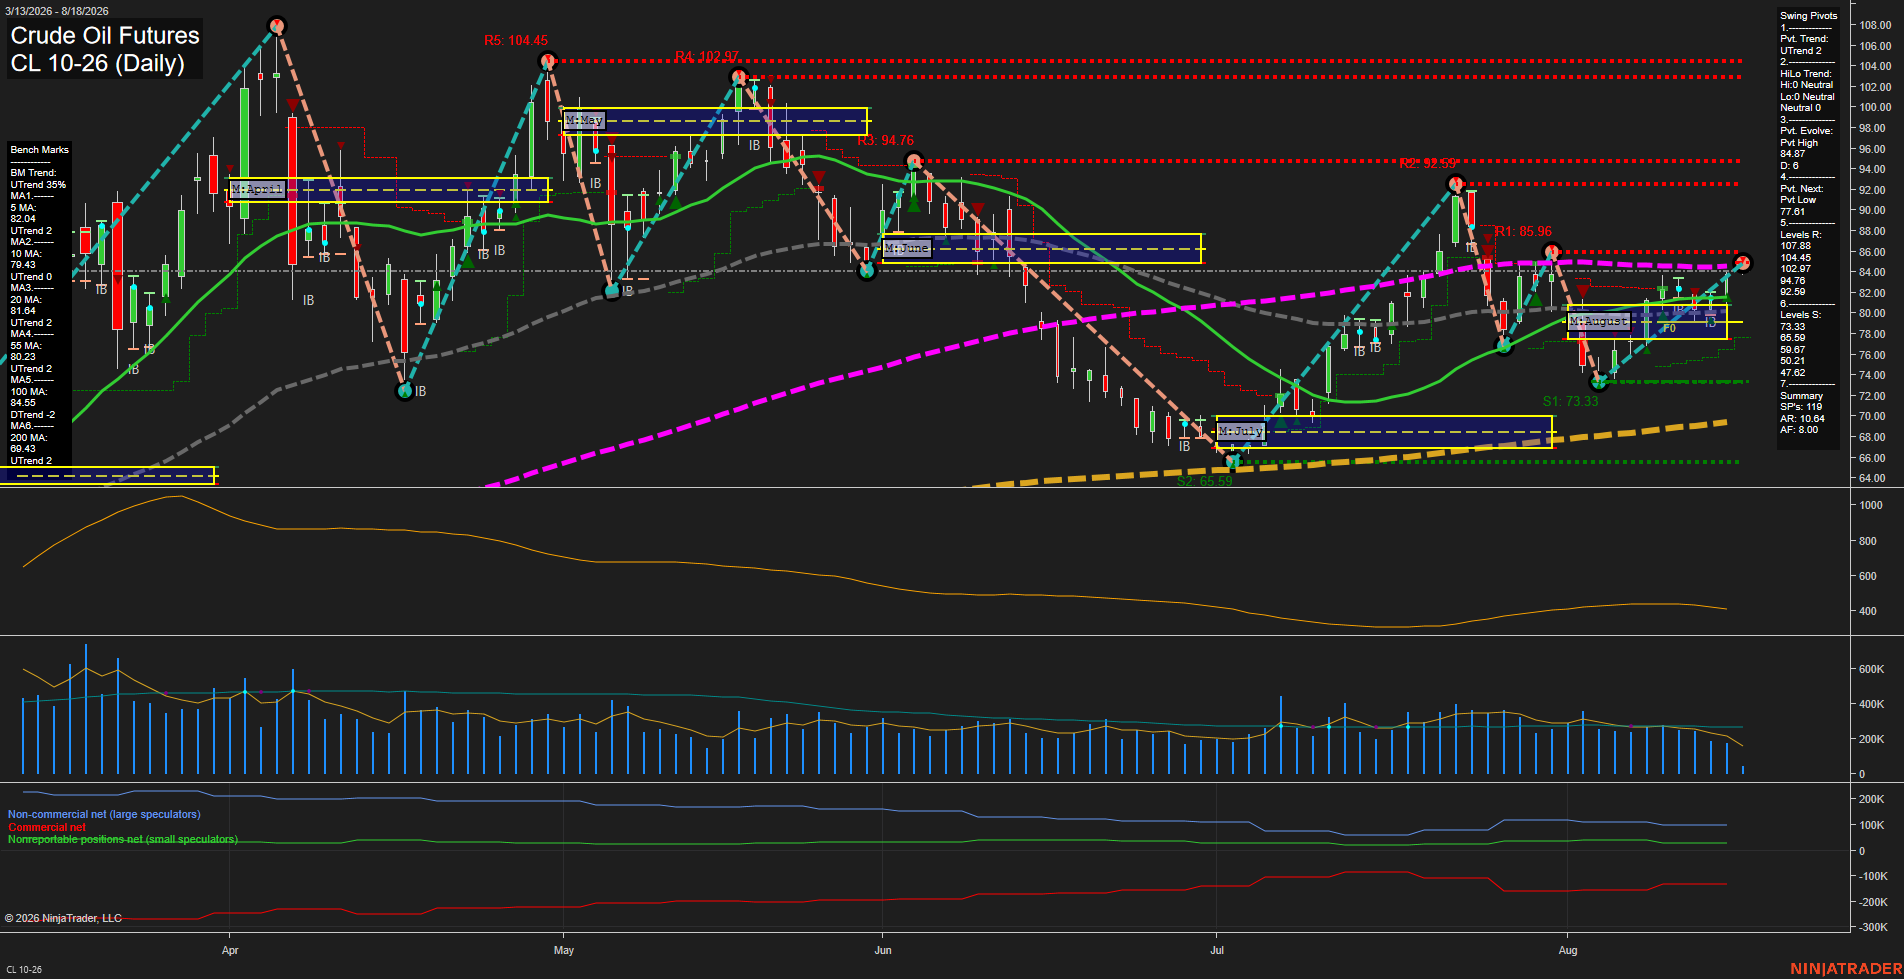
CL Daily View
Overall Rating
- Short-Term: Bullish
- Intermediate-Term: Bullish
- Long-Term: Bullish.
Key Insights Summary
Price has recovered strongly from the early-August 73.33 pivot low, establishing higher lows and reclaiming the rising 5, 10, 20, and 55-day benchmarks. The weekly and monthly fib-grid structures remain upward, while price is pressing beneath nearby 85.96 pivot resistance and the declining 100-day average near 84.55. The swing-pivot structure is in an uptrend, but the current evolving pivot high shows a potentially consolidative area beneath the 85.96 to 92.59 resistance band. Volume is below its stated VOLMA, indicating the advance has occurred with moderate participation rather than broad expansion.
View charts on: AlphaWebTrader HTF Charts
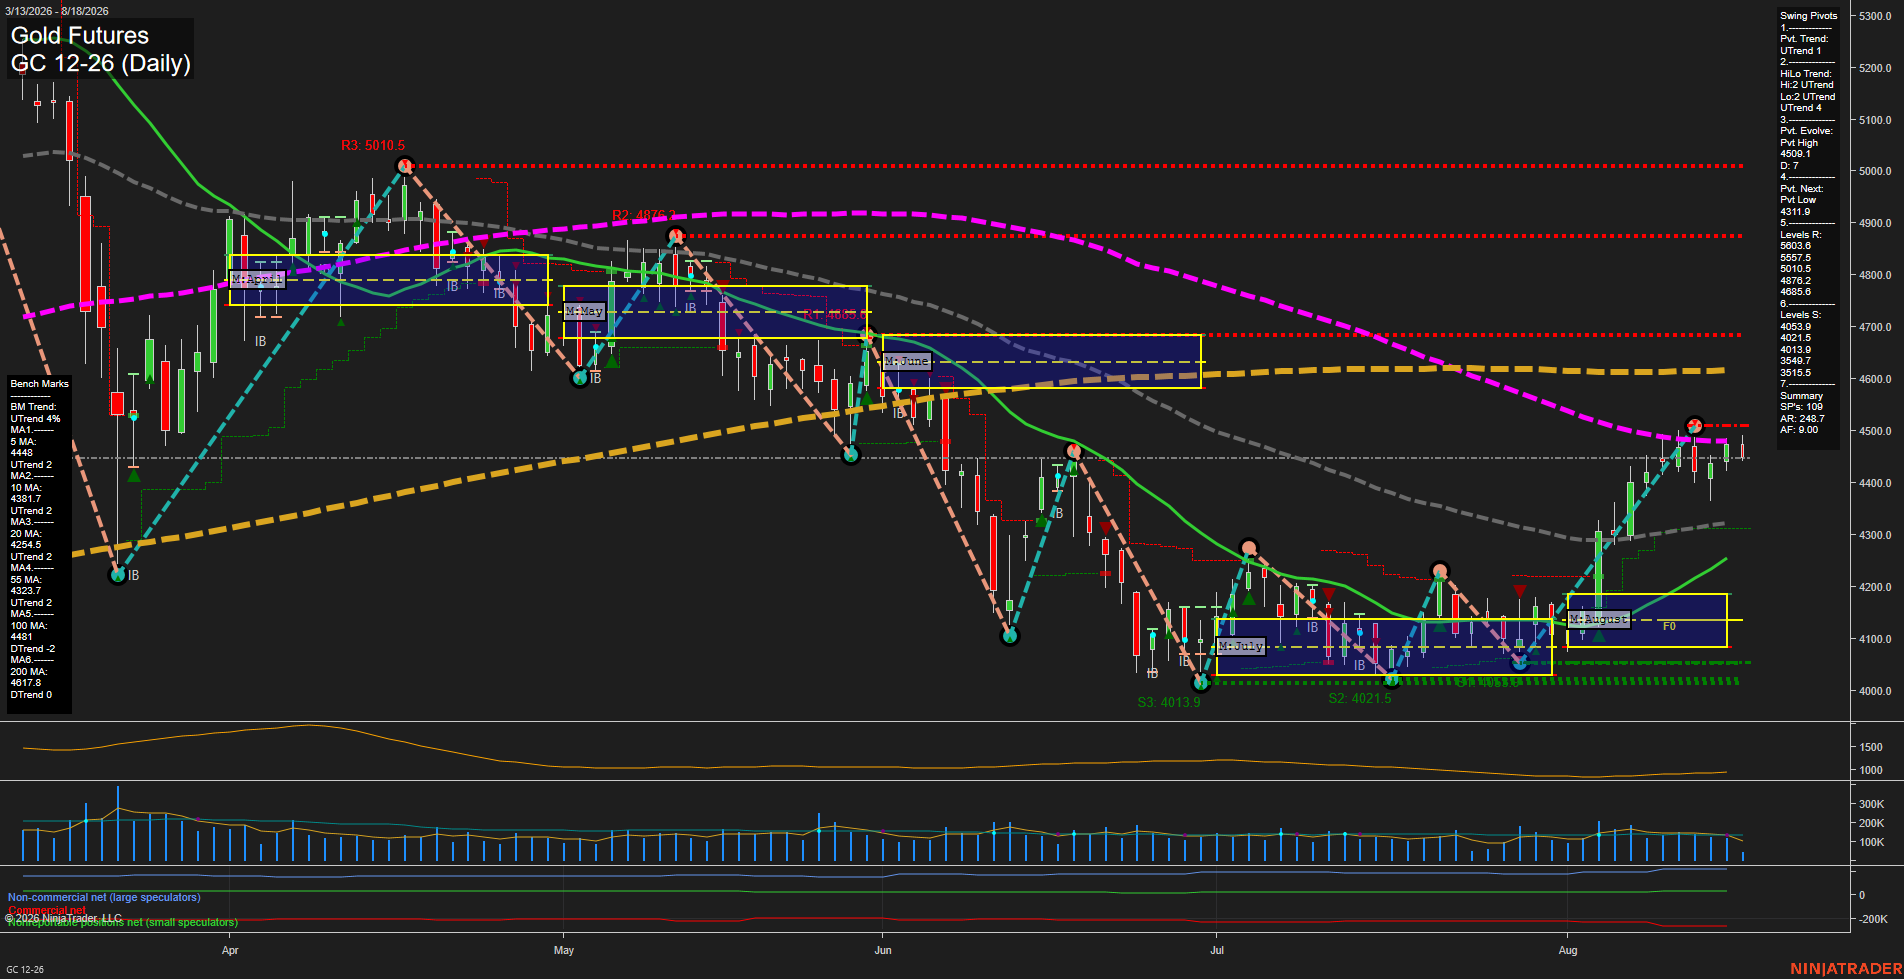
GC Daily View
Overall Rating
- Short-Term: Bullish
- Intermediate-Term: Bullish
- Long-Term: Bearish.
Key Insights Summary
Gold has transitioned from the July base near 4,020 into an August V-shaped recovery, producing higher swing lows and an active short-term pivot uptrend. Price is above the weekly and monthly F0% levels and above the rising 5-, 10-, 20-, and 55-day benchmarks, while recent small candles beneath the 4,507.7 pivot high reflect consolidation after the sharp rally. The intermediate structure is constructive, although price remains below declining 100- and 200-day benchmarks and the yearly grid remains negative, preserving a longer-term countertrend character. Near-term structure centers on the 4,507.7 pivot high, with 4,685.6 as the next major overhead pivot resistance and 4,311.9 as the pivot reversal level.
View charts on: AlphaWebTrader HTF Charts