NYSE stocks closed lower as global long-term yields climbed, pressuring technology and metals while oil and geopolitical risks sustained caution.
Fundamentals: U.S. equities closed lower as a global selloff in long-dated government bonds pushed yields higher, weighing most heavily on technology and semiconductor shares. The S&P 500 fell 0.69% and the Nasdaq Composite lost 1.33%, while higher oil prices, Middle East tensions and fiscal concerns added to inflation and borrowing-cost pressures.
Technicals: Major index futures maintained constructive intermediate- and long-term structures despite mixed to bearish short-term readings across several markets. ES, NQ, YM, RTY and FDAX faced consolidation or pullbacks near recent highs, while EMD held a broadly positive trend. ETF movers included gains in AAPL, IBIT and TLT, with GLD, NVDA and META lower.
After Market Close daily snapshot: market news summary and sentiment, major ETFs, Magnificent 7 analysis, Indices Futures Higher Time Frame Analysis, and E-mini S&P500, Nasdaq 100, NYMEX Crude, Gold Futures Daily Chart analysis.
As of: August 18, 2026 05:00 CT
Market News Summary:
Global bond-market selling pushed long-term yields to multiyear highs, weighing on technology stocks, precious metals, and broader risk sentiment.
Primary Drivers & Risks:
- Primary Driver: Global long-term yield surge
- Primary Risk: Higher borrowing costs pressure equities
Tone:
Risk-off, led by rates and technology weakness.
Stock Market / ETFs / Indices:
U.S. equities ended lower as sovereign yields rose and semiconductor stocks declined. The S&P 500 fell 0.69% and the Nasdaq Composite lost 1.33%, with memory stocks and AI-linked shares under pressure. Strong S&P 500 earnings growth remained a constructive counterpoint, while concentration in AI-related assets was highlighted as a market vulnerability.
Geopolitical:
Iranian missile activity toward the UAE and the expiration of an Iran truce added geopolitical uncertainty. U.S.-China dialogue remained centered on maintaining the existing trade truce, with low expectations for a substantive breakthrough.
Oil / Energy:
Oil traded unevenly as Middle East developments drove caution. Elevated oil prices added to inflation and interest-rate concerns, while about half of Venezuela’s oil output was reported to be flowing to the United States.
Gold / Metals:
Gold and silver declined as rising global yields outweighed support from a softer U.S. dollar and Middle East risks. Gold’s longer-term diversification demand from Asian investors and central banks remained part of the broader bullion backdrop.
Fed / Financials:
Long-term Treasury yields rose despite an unchanged Fed policy rate, steepening the yield curve and lifting consumer borrowing costs. The 30-year Treasury yield moved above 5.33%, while long-duration Treasury funds fell sharply. Japanese bond-market stress and weaker confidence in developed-market fiscal paths added to global rate pressure.
Macro / Other:
Higher government debt costs and concerns over fiscal sustainability remained central macro themes. China data pointed to weaker consumer conditions and difficulty translating technology earnings into broader profitability.
Conclusion:
The dominant market driver was the global selloff in long-dated government bonds and the resulting rise in yields. Technology and semiconductor shares absorbed the largest equity pressure as discount-rate concerns intensified.
Elevated oil prices and Middle East tensions reinforced inflation concerns. Strong S&P 500 earnings, bullion demand trends, and low trading activity across risk assets provided offsetting cross-currents.
Market News Sentiment
Market News Articles: 43
- Neutral: 48.84%
- Negative: 27.91%
- Positive: 23.26%
Sentiment Summary: Market news sentiment is neutral overall, with 49% neutral, 28% negative, and 23% positive coverage across 43 articles.
Conclusion: Neutral coverage leads, while negative articles exceed positive articles.
GLD,Gold Articles: 12
- Negative: 50.00%
- Positive: 33.33%
- Neutral: 16.67%
Sentiment Summary: GLD/Gold coverage is mixed-to-negative, with 50% negative, 33% positive, and 17% neutral across 12 articles.
Conclusion: Gold-related news tone is net negative, indicating a cautious sentiment backdrop relevant to indices futures markets.
USO,Oil Articles: 8
- Negative: 50.00%
- Positive: 37.50%
- Neutral: 12.50%
Sentiment Summary: USO/Oil coverage is mixed with a negative tilt: 50% negative, 38% positive, and 13% neutral across 8 articles.
Conclusion: Oil-related news tone is modestly negative, which may be relevant to energy-sector influence on index futures sentiment.
Market Data Snapshot
ETF Snapshot of major stock market ETFs, Mag7, and others as of: August 18, 2026 05:00
Top Movers & Losers
- AAPL 310.03 Bullish 1.45% ▲
- IBIT 36.60 Bullish 0.49% ▲
- TLT 81.66 Bullish 0.38% ▲
- GLD 398.55 Bearish -1.71% ▼
- NVDA 219.74 Bearish -2.34% ▼
- META 543.67 Bearish -4.45% ▼
Major Index ETFs: SPY, QQQ, DIA, IWM, IJH
- DIA 532.91 Bearish -0.24% ▼
- SPY 767.45 Bearish -0.68% ▼
- IWM 300.23 Bearish -1.26% ▼
- IJH 77.24 Bearish -1.58% ▼
- QQQ 717.51 Bearish -1.69% ▼
Major index ETFs were Bearish across the board: QQQ led losses at -1.69%, followed by IJH at -1.58% and IWM at -1.26%. SPY declined -0.68%, while DIA was the least negative mover at -0.24%.
Mag 7 Stocks: AAPL, MSFT, GOOG, AMZN, META, NVDA, TSLA
- AAPL 310.03 Bullish 1.45% ▲
- MSFT 481.63 Bullish 0.27% ▲
- GOOG 341.28 Bearish -0.05% ▼
- AMZN 259.45 Bearish -0.71% ▼
- TSLA 336.87 Bearish -0.72% ▼
- NVDA 219.74 Bearish -2.34% ▼
- META 543.67 Bearish -4.45% ▼
Mag7 was Bearish overall: AAPL was the most bullish mover at +1.45%, followed by MSFT at +0.27%. GOOG was marginal at -0.05%, while AMZN fell -0.71% and TSLA declined -0.72%. NVDA lost -2.34%, and META was the most bearish mover at -4.45%.
Cross-Market ETFs: TLT, GLD, USO, IBIT
- IBIT 36.60 Bullish 0.49% ▲
- TLT 81.66 Bullish 0.38% ▲
- USO 130.66 Bullish 0.28% ▲
- GLD 398.55 Bearish -1.71% ▼
Mixed cross-market tone: IBIT is the most bullish mover at +0.49%, followed by TLT at +0.38% and USO at +0.28%. GLD is the most bearish mover, down -1.71%.
ETF, Mag7, and Cross-Market ETF Insights
Overall Tone
Bearish risk-off tone, with broad equity ETF and large-cap technology weakness outweighing selective gains in defensive and commodity-linked ETFs.
Equity ETFs and Mag7:
Major Index ETFs were Bearish: SPY -0.68%, DIA -0.24%, IWM -1.26%, IJH -1.58%, and QQQ -1.69%, showing weaker small- and mid-cap participation alongside technology pressure. Mag7 action was selective but Bearish overall: AAPL was the most bullish mover at +1.45%, followed by MSFT +0.27%, while GOOG was marginal at -0.05%, AMZN -0.71%, TSLA -0.72%, NVDA -2.34%, and META was the most bearish mover at -4.45%.
Cross-Market ETFs:
Cross-market ETFs were Mixed, with IBIT the most bullish mover at +0.49%, followed by TLT +0.38% and USO +0.28%. GLD diverged as the most bearish mover at -1.71%, contrasting with gains in bonds, oil, and bitcoin exposure.
Futures Indices – Higher Time Frame Analysis
Summary of the current state of US Indices Futures based on higher time-frame (HTF) technical analysis as of: 2026-08-18: 17:00 CT.
US Indices Futures
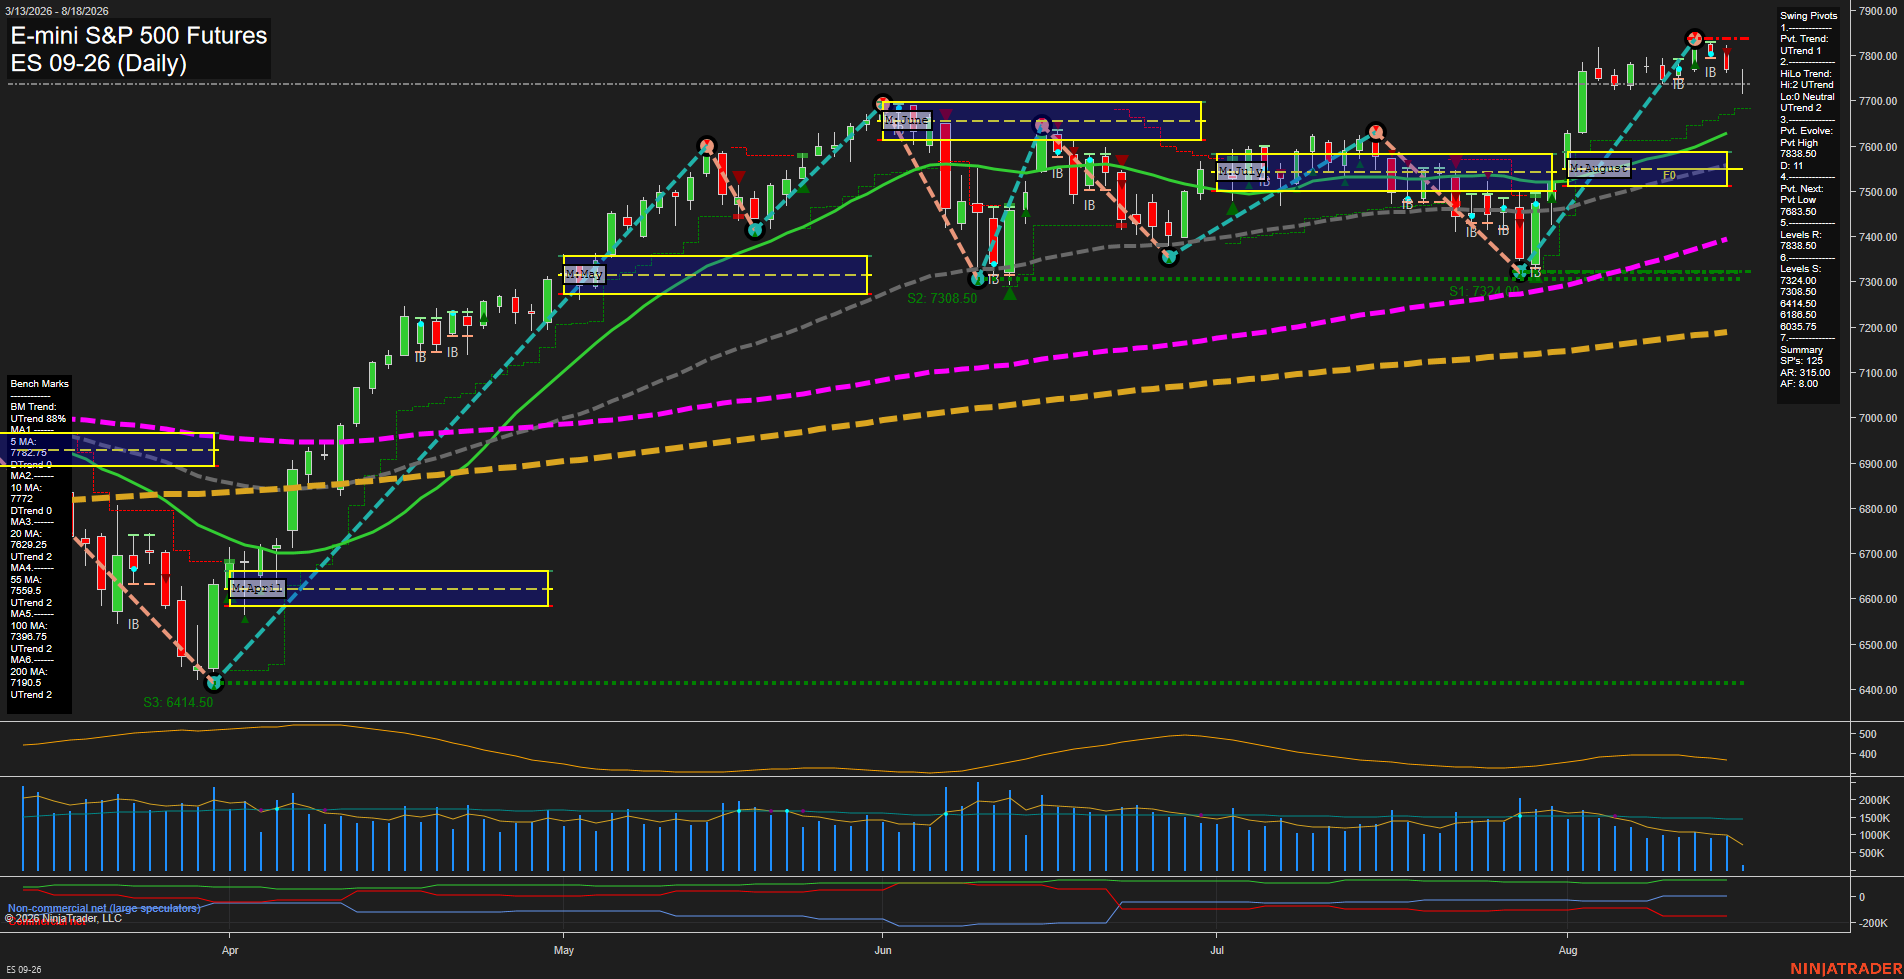
- ES: YSFG/MSFG up, WSFG down; above rising benchmarks; 7838.50 resistance, 7683.50 and 7450.50 swing supports; short-term pullback, broader uptrend.
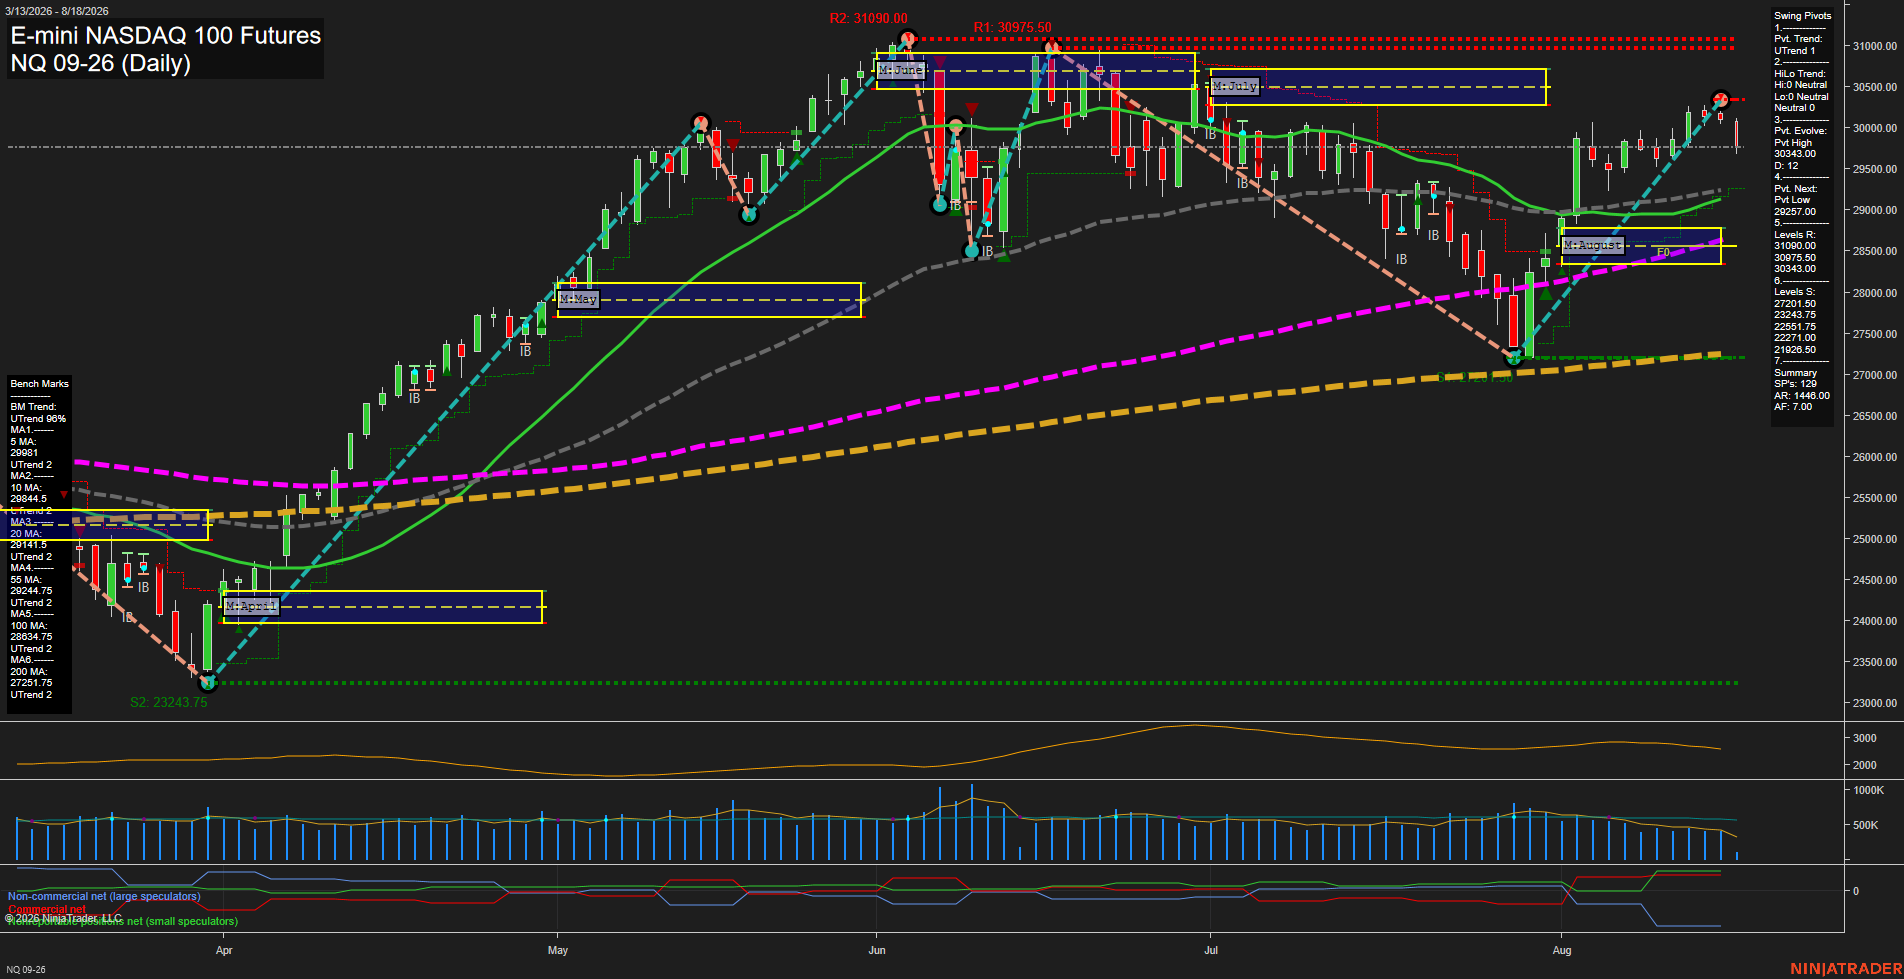
- NQ: YSFG/MSFG up, WSFG down; above rising benchmarks; 30343 resistance, 29257 support, 27201.50 major pivot; short-term rotational.
- YM: YSFG/MSFG up, WSFG below F0%; above 20–200 benchmarks but below 5/10-day; 54884 resistance, 53380 support, 52444 reversal threshold.
- EMD: YSFG/MSFG up, WSFG down; above benchmarks; 3941.7 resistance, 3930.5 support, 3849.7 reversal pivot; short-term mixed within uptrend.
- RTY: YSFG/MSFG up, WSFG down; above benchmarks; 3071.8–3079.9 resistance, 2879.5 reversal reference, 2429.8 major support; short-term mixed.
- FDAX: YSFG/MSFG up, WSFG down; above rising 20–200 benchmarks, below 5-day; 26865 resistance, 26141 reversal reference, 25155 support.
Overall State
- Short-Term: Bearish
- Intermediate-Term: Bullish
- Long-Term: Bullish
Conclusion
Intermediate- and long-term correlations remain bullish across all six indices: pivot structures are generally higher-high/higher-low, YSFG and MSFG are up, and price holds above longer-term benchmarks. WSFG readings are down across the group, while recent short signals and resistance tests at ES, NQ, RTY, and FDAX define short-term countertrend rotation. YM and FDAX show the clearest short-term benchmark weakness; EMD retains the firmest benchmark alignment.
Note: Intra-day counter-trend pullbacks or retracements may occur, HTF is context for informational usage and market structure. Glossary: Session Fib Grids periods of YSFG:’Yearly’, MSFG:’Monthly’, WSFG:’Weekly’
For full details visit: AlphaWebTrader Technicals
ES Daily View
Overall Rating
- Short-Term: Bullish
- Intermediate-Term: Bullish
- Long-Term: Bullish.
Key Insights Summary
Price is consolidating near the 7838.50 pivot high after a sharp August advance, with small daily bars and slowing momentum indicating a mature, relatively compressed upswing. The weekly fib-grid remains countertrend down while price holds above the rising 5-, 10-, 20-, 55-, 100-, and 200-day benchmarks. Intermediate- and long-term structure remains constructive through higher pivot lows and aligned rising averages; 7838.50 is the immediate swing-high reference, while 7683.50 defines the next pivot-reversal level.
View charts on: AlphaWebTrader HTF Charts
NQ Daily View
Overall Rating
- Short-Term: Neutral
- Intermediate-Term: Bullish
- Long-Term: Bullish.
Key Insights Summary
NQ completed a rapid V-shaped recovery from the late-July 27201.50 swing low and reached a new short-term pivot high at 30343.00. The current medium red bar reflects a pullback from that pivot high, while the weekly fib grid remains down and the two current short-term signal readings are short. Price remains above the rising 5-, 10-, 20-, 55-, 100-, and 200-day benchmarks, preserving constructive intermediate- and long-term structure. The 29257.00 pivot-next level and the clustered 20/55-day averages near 29142-29245 define the principal retracement structure beneath current price, while 30343.00, 30975.50, and 31090.00 remain the overhead pivot-resistance sequence.
View charts on: AlphaWebTrader HTF Charts
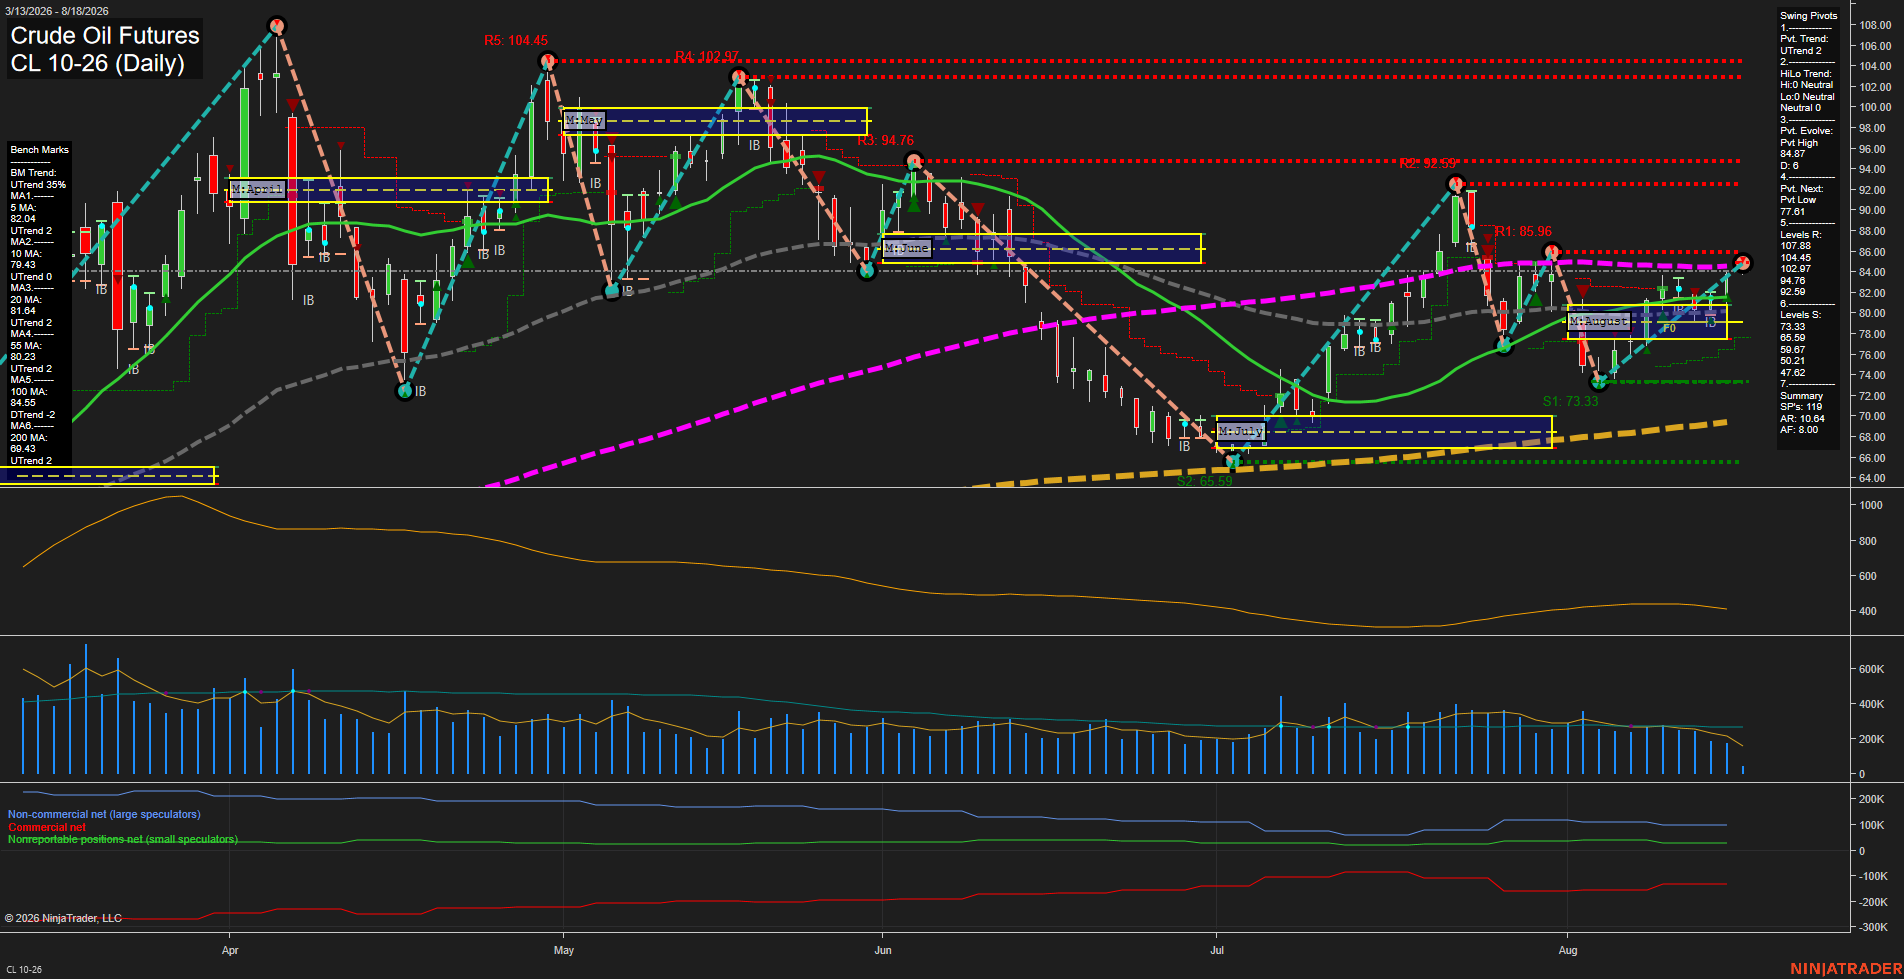
CL Daily View
Overall Rating
- Short-Term: Bullish
- Intermediate-Term: Bullish
- Long-Term: Bullish.
Key Insights Summary
Price has recovered strongly from the early-August 73.33 pivot low, establishing higher lows and reclaiming the rising 5, 10, 20, and 55-day benchmarks. The weekly and monthly fib-grid structures remain upward, while price is pressing beneath nearby 85.96 pivot resistance and the declining 100-day average near 84.55. The swing-pivot structure is in an uptrend, but the current evolving pivot high shows a potentially consolidative area beneath the 85.96 to 92.59 resistance band. Volume is below its stated VOLMA, indicating the advance has occurred with moderate participation rather than broad expansion.
View charts on: AlphaWebTrader HTF Charts
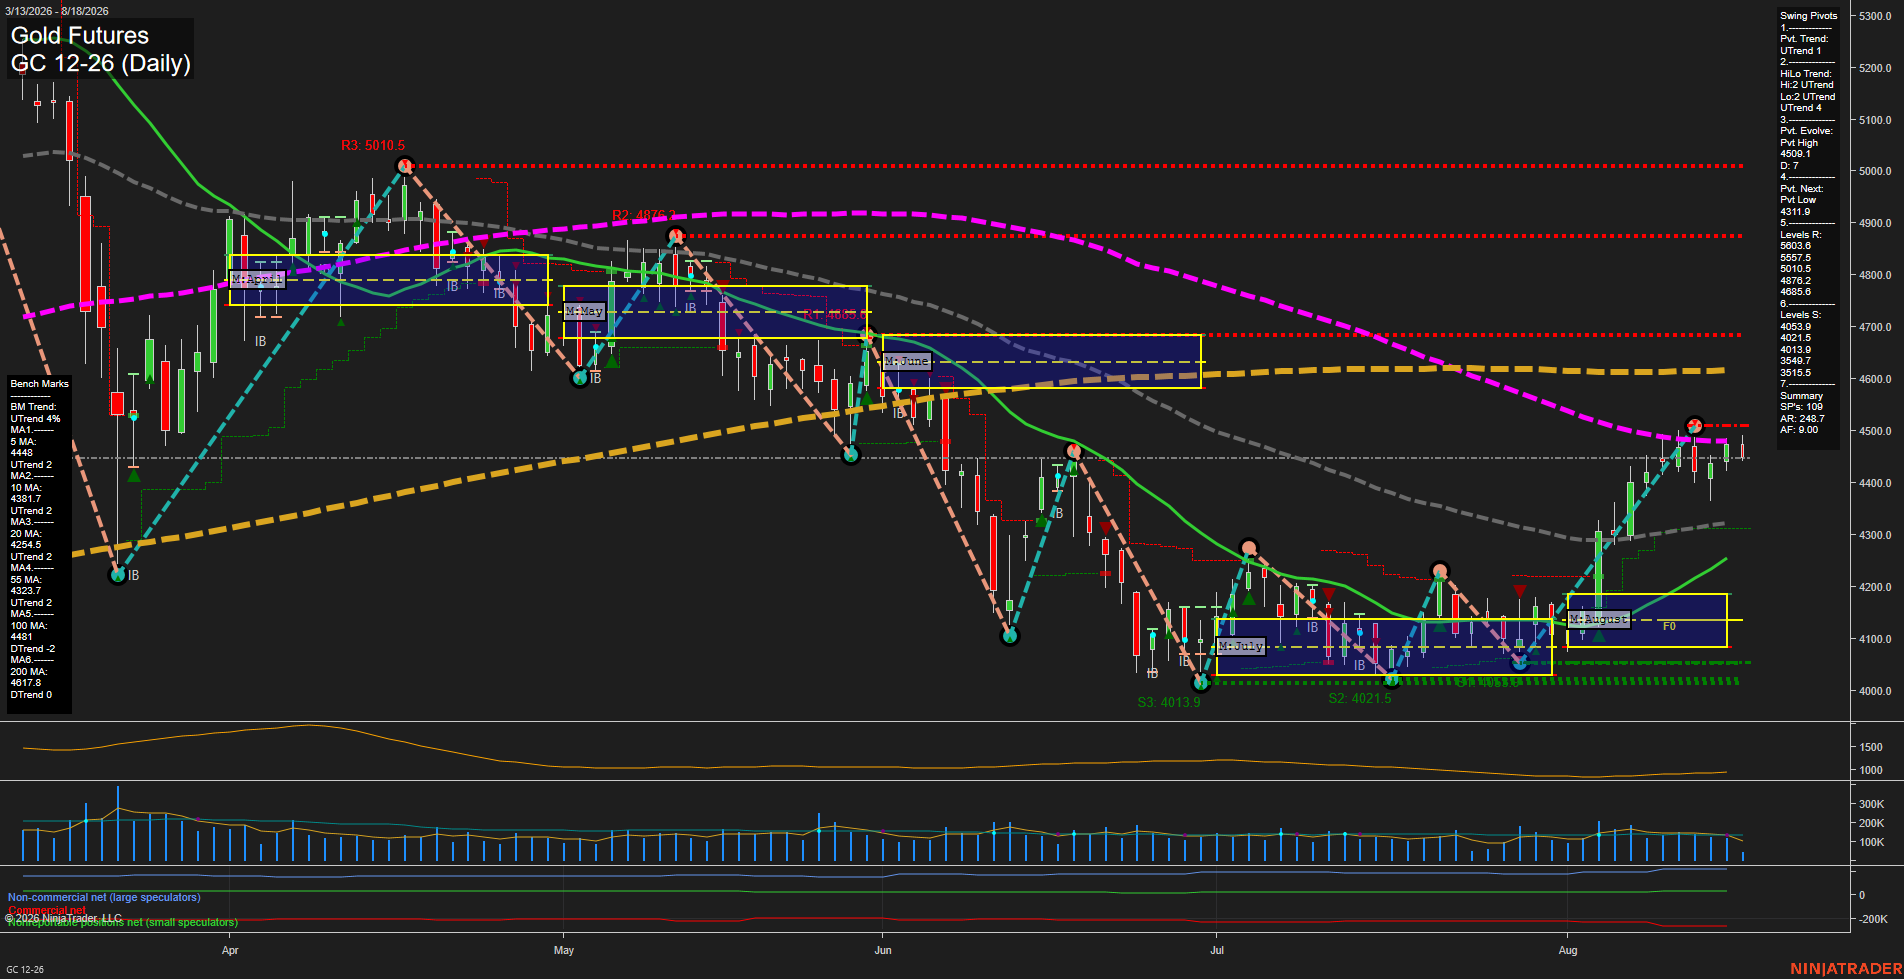
GC Daily View
Overall Rating
- Short-Term: Bullish
- Intermediate-Term: Bullish
- Long-Term: Bearish.
Key Insights Summary
Gold has transitioned from the July base near 4,020 into an August V-shaped recovery, producing higher swing lows and an active short-term pivot uptrend. Price is above the weekly and monthly F0% levels and above the rising 5-, 10-, 20-, and 55-day benchmarks, while recent small candles beneath the 4,507.7 pivot high reflect consolidation after the sharp rally. The intermediate structure is constructive, although price remains below declining 100- and 200-day benchmarks and the yearly grid remains negative, preserving a longer-term countertrend character. Near-term structure centers on the 4,507.7 pivot high, with 4,685.6 as the next major overhead pivot resistance and 4,311.9 as the pivot reversal level.
View charts on: AlphaWebTrader HTF Charts