NYSE pre-market radar tracks bearish short-term equity futures, rising Treasury yields, oil risks tied to Iran and gold support amid debt concerns.
Fundamentals: U.S. equity-index sentiment weakened in the NYSE pre-market as higher Treasury yields, record federal borrowing and softer retailer signals weighed on risk appetite. Oil stayed elevated amid Iran-related supply disruptions despite a late pullback, while gold drew support from dollar weakness and bond-market stress. Treasury market pressure remained the key cross-asset volatility driver.
Technicals: IBIT and USO led prior-session ETF gains, while Tesla, Apple and Amazon declined. Major equity futures show broadly bearish short-term conditions after resistance rejections, with declining daily pivot trends and elevated volatility. Intermediate and long-term structures remain bullish across most contracts, leaving markets in corrective phases within broader advances.
Pre-Market Trading 360° view Market Radar of: holidays, earnings, eco-news, market-news summary, news sentiment, prior session major ETFs, MAG7, Higher Time Frame Analysis Indices Futures Summary, and E-mini S&P500, Nasdaq 100, NYMEX Crude, Gold Futures Daily Chart analysis.
As of: August 21, 2026 07:16 CT
Earnings Radar
Monitoring for earnings releases by the Magnificent 7, AI-tech-related firms, and major financial institutions.
- CRM Release: 2026-08-26 T:AMC
- NVDA Release: 2026-08-26 T:AMC
Conclusion: CRM and NVDA report after the close on Aug. 26, concentrating broad index-relevant software, AI, and semiconductor earnings risk into one session. Market momentum and volume can slow ahead of these major tech releases, with post-release reactions shaping index-futures sentiment.
For full details visit: Yahoo Earnings Calendar
Market News Summary:
Equity-index sentiment weakened as rising Treasury yields, debt concerns, and softer consumer signals outweighed temporary support from Treasury buyback plans.
Primary Drivers & Risks:
- Primary Driver: Treasury yield and debt pressures
- Primary Risk: Iran conflict and oil disruption
Tone:
Risk-off, with elevated cross-asset volatility.
Stock Market / ETFs / Indices:
U.S. stocks and bonds declined, with retailer results adding concern about consumer health. The S&P 500 fell from 7,820 last week to 7,640 amid volatile yields, while Japan’s Nikkei declined 0.5% in response to Wall Street losses. Margin debt fell 5.7% in July after three monthly increases, alongside sharp hedge-fund de-grossing.
Geopolitical:
The U.S.-Iran war neared six months, with disrupted Middle East supply and sharply reduced Hormuz traffic supporting energy-market tension. Black Sea infrastructure strikes also pressured wheat prices and heightened food-supply concerns.
Oil / Energy:
Oil remained on track for a second weekly advance as the Iran conflict constrained regional supply, although futures retreated after a five-session rise in a technical correction. Higher U.S. crude and natural-gas inventories provided a domestic supply buffer, while Iraq outlined plans to raise output substantially over six years.
Gold / Metals:
Gold rebounded toward a weekly gain of nearly 5%, supported by dollar weakness, bond-market jitters, fiscal concerns, and Iran tensions. Bullion cleared its 200-day moving average in one technical assessment, while another report cited changing monetary-policy expectations behind an early Asian decline.
Fed / Financials:
Treasury buybacks reversed yields for only one day as federal borrowing exceeded $40 trillion. Commentary highlighted heavy government and corporate debt supply, softer foreign demand, and confidence concerns as factors maintaining upward pressure on yields; fading Fed-hike odds also supported gold.
Macro / Other:
Walmart and other retailer results reinforced concerns about an ailing U.S. consumer. Financing demand from AI infrastructure is increasing pressure on credit and equity markets as companies fund data centers, chips, power capacity, and energy grids.
Conclusion:
Treasury-market stress and higher yields remained the central pressure on index futures sentiment. Consumer-health concerns added to the equity-market weakness.
Iran-related energy disruption kept oil and inflation risks elevated despite a late futures pullback. Dollar weakness and debt concerns supported gold, while heavy borrowing needs remained a cross-asset volatility source.
Market News Sentiment
Market News Articles: 28
- Neutral: 53.57%
- Negative: 32.14%
- Positive: 14.29%
Sentiment Summary: Of 28 market news articles, 54% were neutral, 32% negative, and 14% positive, indicating neutral coverage with a negative skew.
Conclusion: Indices futures day traders are facing predominantly neutral news flow, while negative articles outnumber positive articles.
GLD,Gold Articles: 15
- Positive: 53.33%
- Negative: 33.33%
- Neutral: 13.33%
Sentiment Summary: Gold coverage is moderately positive, with 53% positive, 33% negative, and 13% neutral articles across 15 items.
Conclusion: The tone reflects a positive tilt toward gold, with meaningful negative coverage still present.
USO,Oil Articles: 8
- Positive: 50.00%
- Neutral: 37.50%
- Negative: 12.50%
Sentiment Summary: USO/Oil coverage is moderately positive, with 50% positive, 38% neutral, and 13% negative articles across 8 items.
Conclusion: Oil-related news tone is net positive but includes a substantial neutral share, indicating mixed informational coverage for indices futures day traders.
Market Data Snapshot
ETF Snapshot of major stock market ETFs, Mag7, and others as of: August 21, 2026 07:16
Top Movers & Losers
- IBIT 41.20 Bullish 6.24% ▲
- USO 134.54 Bullish 2.77% ▲
- GLD 415.26 Bullish 0.34% ▲
- TSLA 345.13 Bearish -1.71% ▼
- AAPL 311.30 Bearish -1.75% ▼
- AMZN 260.11 Bearish -2.16% ▼
Major Index ETFs: SPY, QQQ, DIA, IWM, IJH
- QQQ 710.93 Bearish -0.72% ▼
- SPY 762.60 Bearish -0.84% ▼
- IJH 76.37 Bearish -0.87% ▼
- DIA 527.51 Bearish -1.27% ▼
- IWM 297.67 Bearish -1.34% ▼
Major index ETFs are Bearish across the board. IWM is the most bearish mover at -1.34%, followed by DIA at -1.27%; SPY declined -0.84% and IJH fell -0.87%. QQQ is the least negative mover at -0.72%.
Mag 7 Stocks: AAPL, MSFT, GOOG, AMZN, META, NVDA, TSLA
- META 545.83 Bearish -0.04% ▼
- NVDA 216.85 Bearish -0.33% ▼
- MSFT 481.15 Bearish -0.65% ▼
- GOOG 338.20 Bearish -1.02% ▼
- TSLA 345.13 Bearish -1.71% ▼
- AAPL 311.30 Bearish -1.75% ▼
- AMZN 260.11 Bearish -2.16% ▼
Mag7 was Bearish across the group: META was the least negative mover at -0.04%, marginally lower, while AMZN was the most bearish mover at -2.16%. AAPL -1.75% and TSLA -1.71% also showed notable Bearish moves; GOOG -1.02%, MSFT -0.65%, and NVDA -0.33% were lower.
Cross-Market ETFs: TLT, GLD, USO, IBIT
- IBIT 41.20 Bullish 6.24% ▲
- USO 134.54 Bullish 2.77% ▲
- GLD 415.26 Bullish 0.34% ▲
- TLT 82.34 Bearish -0.82% ▼
Other ETFs are Mixed: IBIT is the most bullish mover at +6.24%, followed by USO at +2.77%; GLD adds a marginal +0.34%. TLT is the most bearish mover at -0.82%.
ETF, Mag7, and Cross-Market ETF Insights
Overall Tone
Mixed: Broad equity ETFs and Mag7 are Bearish, while IBIT and USO are strongly Bullish and GLD is marginally Bullish.
Equity ETFs and Mag7:
Major Index ETFs were broadly Bearish: SPY -0.84%, QQQ -0.72%, IJH -0.87%, DIA -1.27%, and IWM -1.34%, with QQQ the least negative mover and IWM the most bearish index ETF. Mag7 was also broadly Bearish, led by META’s near-flat -0.04%, followed by NVDA -0.33%, MSFT -0.65%, GOOG -1.02%, TSLA -1.71%, AAPL -1.75%, and AMZN -2.16%. Equity weakness was broadly aligned rather than selective, with AMZN the most bearish mover across equities.
Cross-Market ETFs:
Cross-market action was Mixed: IBIT was the most bullish mover at +6.24%, USO gained +2.77%, and GLD was marginally Bullish at +0.34%. TLT was Bearish at -0.82%, making it the most bearish cross-market ETF and contrasting with strength in bitcoin and oil.
Futures Indices – Higher Time Frame Analysis
Summary of the current state of US Indices Futures based on higher time-frame (HTF) technical analysis as of: 2026-08-21: 07:16 CT.
US Indices Futures
- ES YSFG/MSFG above F0%, WSFG below F0%, benchmarks broadly rising, 7838.50 resistance, 7657.75 support, 7448.50 pivot-reversal reference.
- NQ YSFG/MSFG above F0%, WSFG below F0%, benchmarks rising, 30343.00 resistance, 29022.75 support, 27201.50 major pivot support.
- YM YSFG/MSFG above F0%, WSFG below F0%, benchmarks rising beyond 20-day, 54884 resistance, 52800 support, 52424 pivot-next.
- EMD YSFG/MSFG above F0%, WSFG below F0%, all major benchmarks rising, 3941.7 resistance, 3813.8 support, 3721.3 pivot-reversal threshold.
- RTY YSFG/MSFG above F0%, WSFG down, benchmarks rising, 3079.9 resistance, 2992.3 support, 2877.5 pivot-next reference.
- FDAX YSFG/MSFG above F0%, WSFG below F0%, benchmarks rising, 26665-26685 resistance, 25965 support, 25107 pivot-next.
Overall State
- Short-Term: Bearish
- Intermediate-Term: Bullish
- Long-Term: Bullish
Conclusion
All listed indices retain bullish intermediate- and long-term structure through upward YSFG/MSFG positioning, rising higher-timeframe benchmarks, and higher pivot frameworks. ES, NQ, YM, EMD, RTY, and FDAX are in short-term retracements or consolidation beneath WSFG F0%/NTZ areas after rejection at stated pivot highs. EMD and RTY show the fastest short-term downside rotation; ES, YM, and RTY weekly conditions remain mixed. Resistance is concentrated at recent swing highs, while listed pivot supports define the current retracement structure.
Note: Intra-day counter-trend pullbacks or retracements may occur, HTF is context for informational usage and market structure. Glossary: Session Fib Grids periods of YSFG:’Yearly’, MSFG:’Monthly’, WSFG:’Weekly’
For full details visit: AlphaWebTrader Technicals
ES Daily View
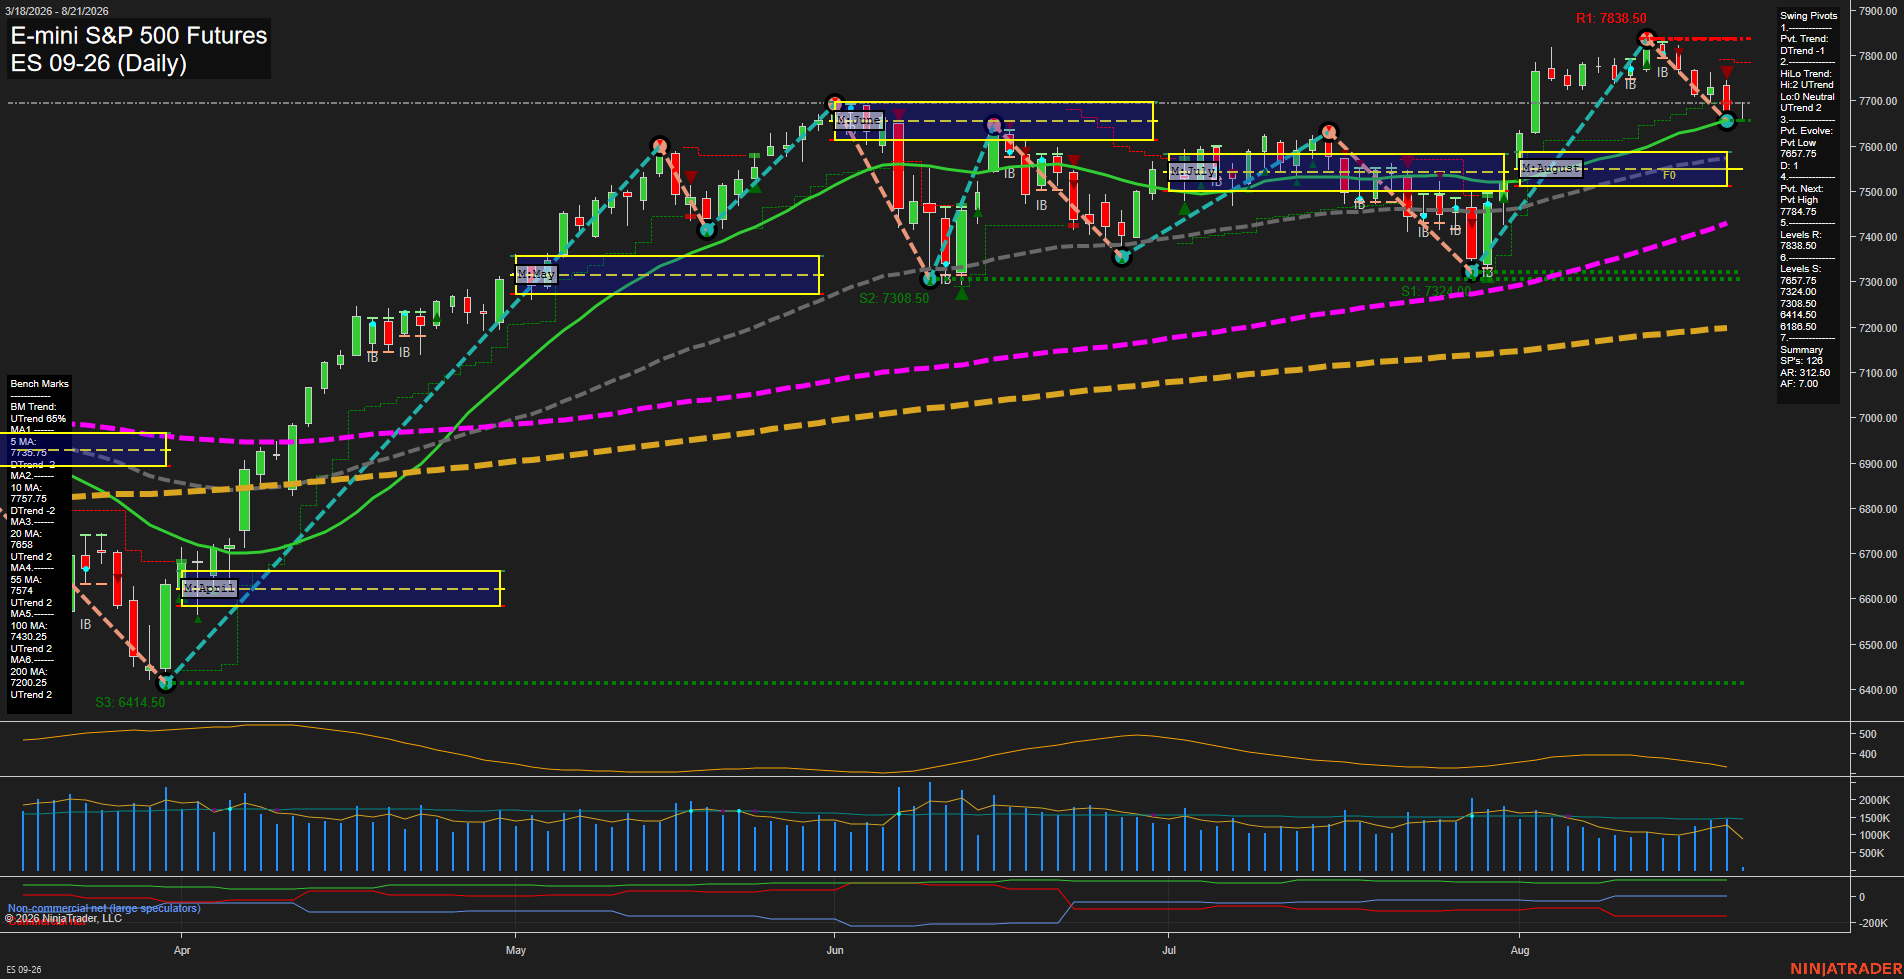
Overall Rating
- Short-Term: Bearish
- Intermediate-Term: Bullish
- Long-Term: Bullish.
Key Insights Summary
The daily structure shows a short-term pullback from the 7838.50 pivot high, with price below the weekly F0% area and both the 5-day and 10-day benchmarks declining. The active pivot trend is down, while the broader HiLo structure remains up and price is holding near the rising 20-day benchmark. The August monthly grid and 100-day, 200-day benchmarks retain an upward intermediate-to-long-term trend backdrop. The 7657.75 support area is the immediate structural reference beneath the market, while 7787.50 and 7838.50 define the nearby recovery and resistance sequence. Volatility remains elevated relative to a typical quiet consolidation, consistent with a choppy retracement inside a still-positive larger trend.
View charts on: AlphaWebTrader HTF Charts
NQ Daily View
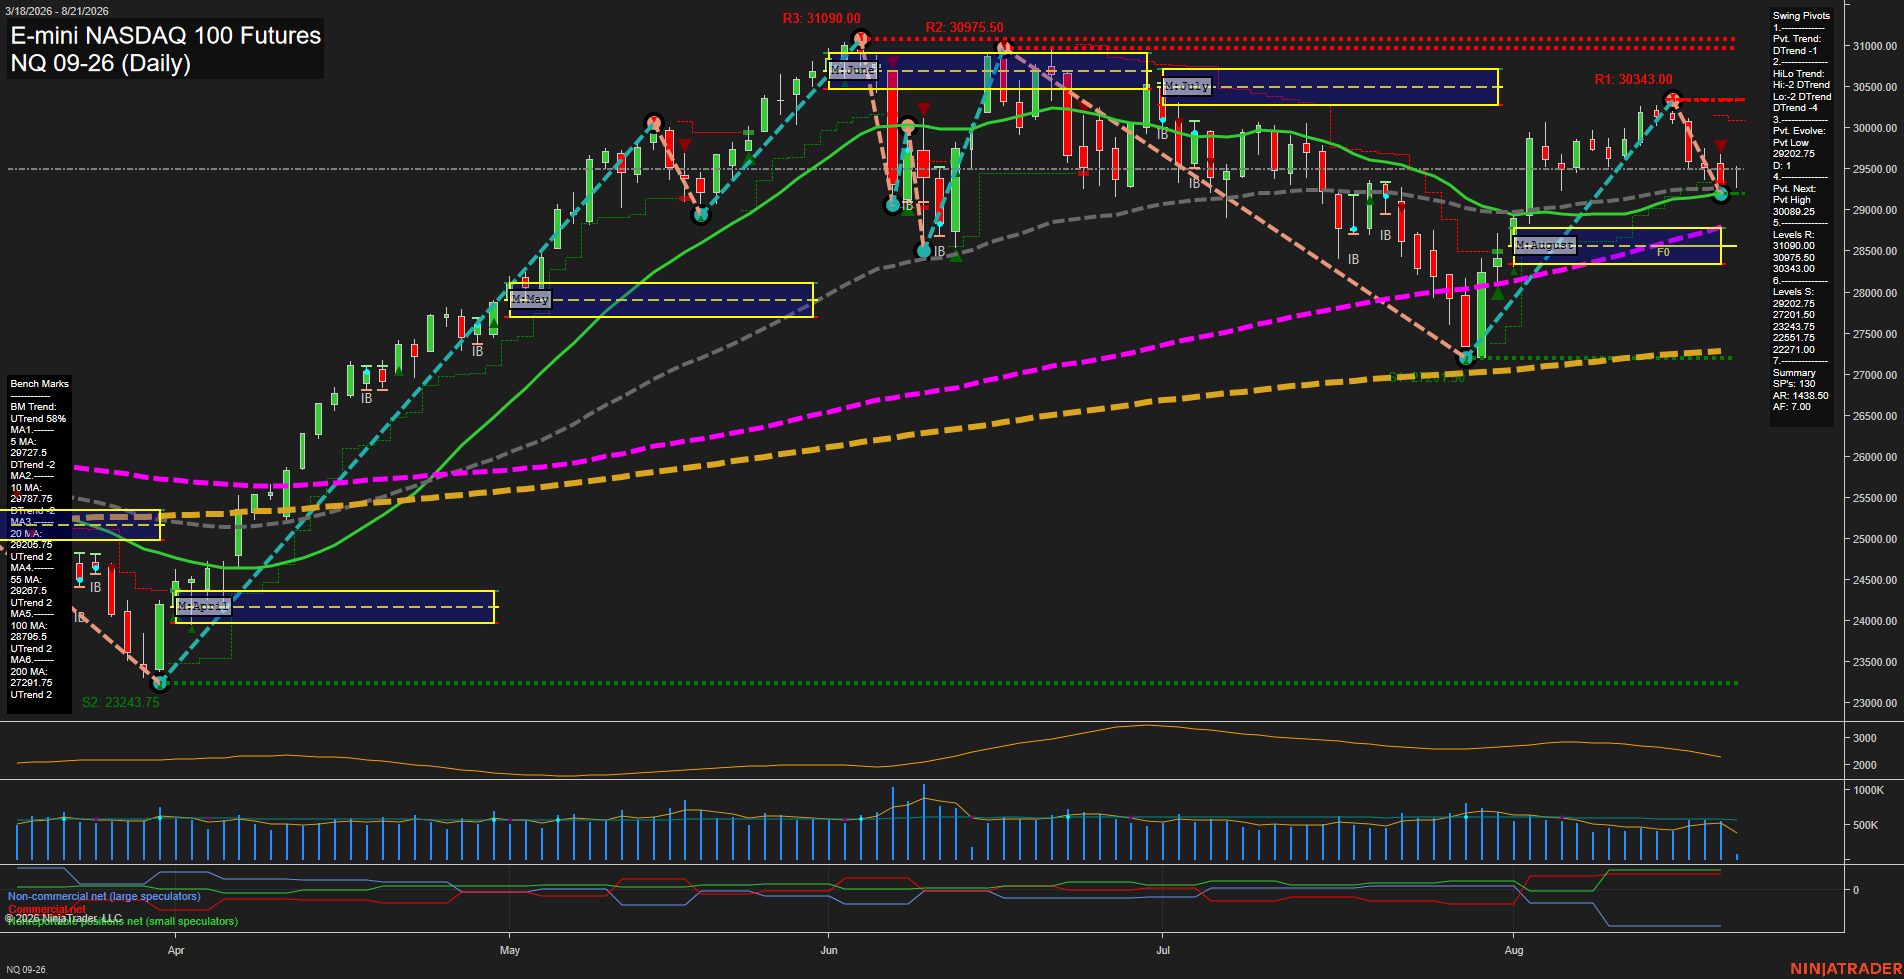
Overall Rating
- Short-Term: Bearish
- Intermediate-Term: Neutral
- Long-Term: Bullish.
Key Insights Summary
Price is consolidating following an August rebound from the 27201.50 swing-support region, but the latest pullback has restored a short-term DTrend and left price below the weekly F0% level. The 30013 short-term signal area and 30089.25 pivot threshold remain the key upside swing reference, with 30343.00 the next overhead resistance. Intermediate and long-term structure remains constructive because price is holding above the rising 20-, 55-, 100-, and 200-day benchmarks and remains above the monthly and yearly F0% zones. The present structure is a countertrend retracement within the larger advance, with 29022.75 as nearby pivot support and reduced momentum/volume participation indicating consolidation rather than an impulsive directional expansion.
View charts on: AlphaWebTrader HTF Charts
CL Daily View
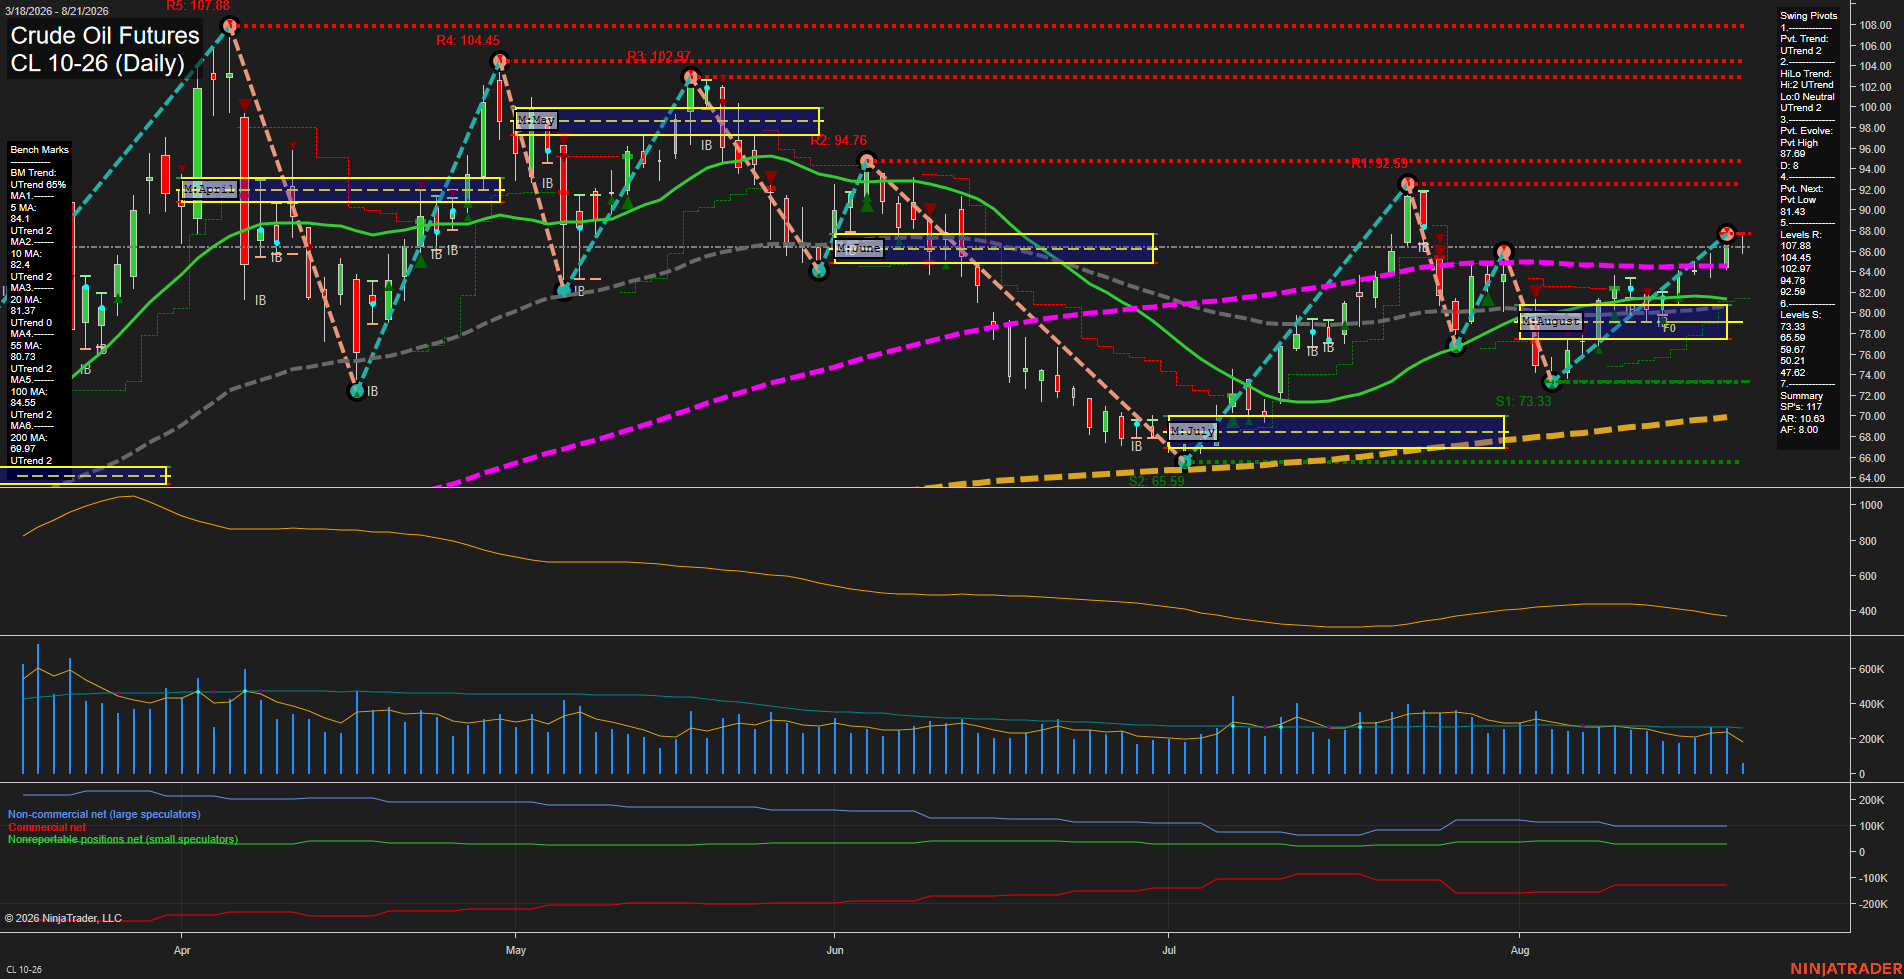
Overall Rating
- Short-Term: Bullish
- Intermediate-Term: Bullish
- Long-Term: Bullish.
Key Insights Summary
CL has extended its August rebound into a fast, medium-range upswing, with price at 87.00 holding above every daily benchmark and above the weekly and monthly fib-grid centers. Both pivot structures are UTrend, confirming higher-low behavior from the late-July low near 73.33. The current pivot is evolving as a high at 87.69, making that area the immediate swing inflection, while 81.43 defines the next indicated downside pivot threshold. The 92.59 to 94.76 resistance band is the next major overhead structure; below, the 5-day through 55-day averages clustered from 80.73 to 84.10 provide a technically constructive retracement zone. Long-term structure remains positive with price above the rising 100-day and 200-day benchmarks, while ATR near 10.63 reflects an actively volatile crude-oil swing environment.
View charts on: AlphaWebTrader HTF Charts
GC Daily View
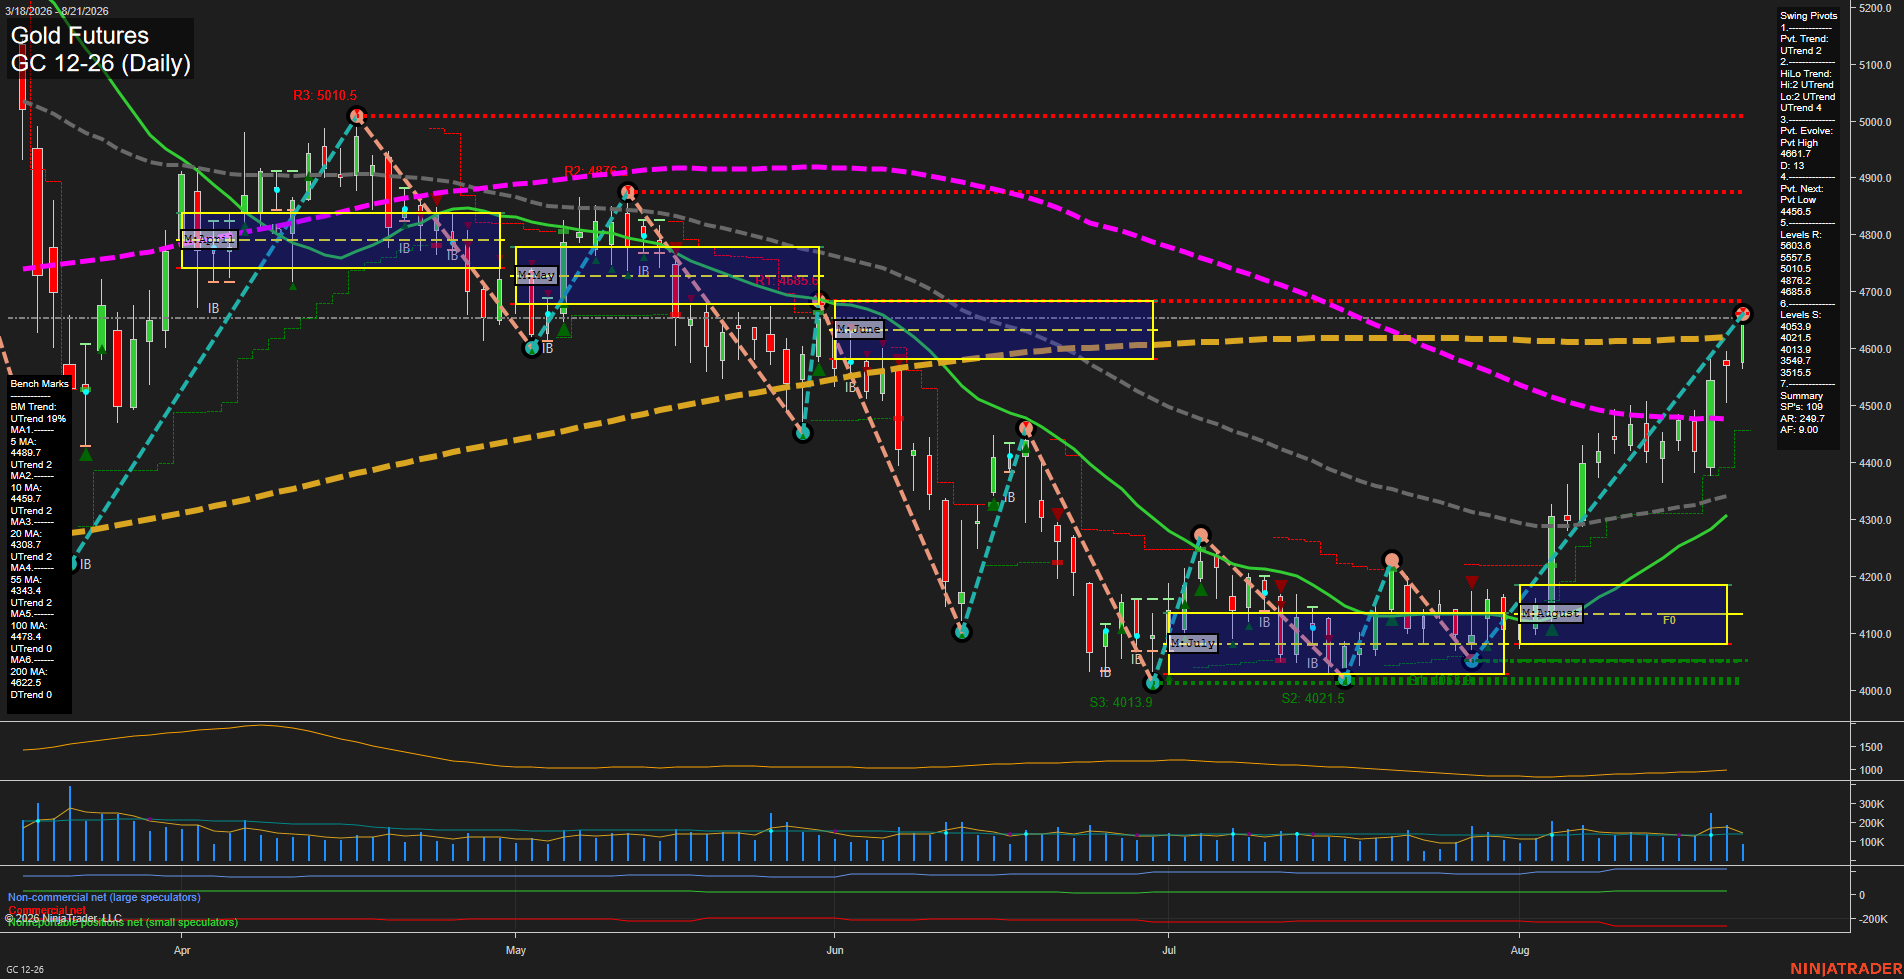
Overall Rating
- Short-Term: Bullish
- Intermediate-Term: Bullish
- Long-Term: Neutral.
Key Insights Summary
Gold has staged a sharp V-shaped recovery from the early-August 4014-4054 support zone, producing higher lows and regaining the 5, 10, 20, 55, and 100-day benchmarks. Short-term swing structure is upward, although price is approaching the 4685.6 pivot resistance and remains below the declining 200-day benchmark near 4622.5. The weekly and monthly fib grids remain positive, while the negative yearly grid position and overhead 200-day average leave the longer-term picture mixed. Elevated ATR and the rapid rebound indicate an active, high-volatility recovery phase rather than a low-range consolidation.
View charts on: AlphaWebTrader HTF Charts