U.S. stocks rebounded as Treasury buybacks, crypto gains and a weaker dollar lifted sentiment, while rising yields, oil and fiscal risks persisted.
Fundamentals: U.S. equities recovered from a yield-driven sell-off as Treasury bond-buyback activity, Bitcoin strength and a weaker dollar supported risk sentiment. The Dow led gains, while the S&P 500 and Nasdaq remained lower for the week. Rising Treasury yields, elevated oil prices, Strait of Hormuz disruption concerns and fiscal-debt pressures kept cross-asset volatility in focus.
Technicals: IBIT and Tesla led notable ETF and equity gains, while Amazon, Apple and Nvidia closed lower. Major U.S. and European index futures showed short-term bearish or mixed conditions after recent resistance tests, with declining daily momentum and elevated volatility. Intermediate- and long-term structures remained broadly bullish across ES, NQ, YM, EMD, RTY and FDAX.
After Market Close daily snapshot: market news summary and sentiment, major ETFs, Magnificent 7 analysis, Indices Futures Higher Time Frame Analysis, and E-mini S&P500, Nasdaq 100, NYMEX Crude, Gold Futures Daily Chart analysis.
As of: August 21, 2026 05:00 CT
Market News Summary:
U.S. equities rebounded Friday as Treasury-market intervention, crypto strength, dollar weakness, and Middle East energy concerns shaped cross-asset trading.
Primary Drivers & Risks:
- Primary Driver: Treasury yields and buyback intervention
- Primary Risk: Fiscal credibility and elevated oil
Tone:
Constructive rebound with persistent macro and valuation caution.
Stock Market / ETFs / Indices:
The Dow gained nearly 1%, or about 500 points, as Wall Street recovered from the prior session’s yield-driven sell-off. The S&P 500 and Nasdaq also rose, but all three major indexes ended the week lower. Bitcoin’s advance toward $80,000 and strength in crypto-related stocks supported sentiment, while commentary highlighted the S&P 500’s historically elevated valuation as a pullback risk. Consumer earnings indicated selective spending.
Geopolitical:
Middle East tensions centered on expectations that the Strait of Hormuz would remain closed for coming weeks. The disruption theme supported oil and precious-metals demand.
Oil / Energy:
WTI and Brent moved higher, with Brent testing new highs amid Strait of Hormuz closure concerns. Separately, PJM transmission-congestion costs rose 43% to $6 billion in the first half of 2026, highlighting U.S. grid constraints. AI-related electricity demand and nuclear-sector developments also remained in focus.
Gold / Metals:
Gold and silver extended gains as a weaker dollar, fiscal-risk hedging, and Hormuz uncertainty offset elevated Treasury yields. DXY remained below 99, while gold, silver, platinum, palladium, and copper tested technical breakout levels. Attention now shifts to July PCE data and the Jackson Hole Fed address.
Fed / Financials:
Treasury’s long-duration bond-buyback initiative helped stocks rebound but did not prevent yields from rising. Debate intensified over Treasury intervention, Fed independence, and the credibility of monetary policy. U.S. public debt surpassed $40 trillion, reinforcing fiscal-deficit concerns; bond sentiment readings also indicated extreme bearishness toward long-duration debt.
Macro / Other:
Bitcoin rose roughly 24% for the week, its strongest performance since 2023, supported by renewed ETF demand, policy activity around the CLARITY Act, and movement in the rates complex. Prediction-market traders indicated Bitcoin finishing the year near current levels. Shein targeted a Hong Kong listing by September 1.
Conclusion:
Friday’s index rebound tracked Treasury-market actions, a stronger crypto complex, and improved risk sentiment. Treasury yields remained the central cross-asset variable.
Fiscal debt concerns, questions about Fed independence, elevated oil prices, and Middle East disruption remained active risks. High S&P 500 valuations and upcoming PCE and Jackson Hole events kept macro sensitivity elevated.
Market News Sentiment
Market News Articles: 33
- Neutral: 48.48%
- Negative: 36.36%
- Positive: 15.15%
Sentiment Summary: Of 33 market news articles, 48% were neutral, 36% negative, and 15% positive, indicating predominantly neutral coverage with a negative tilt.
Conclusion: Indices futures day traders are facing a news backdrop with limited positive sentiment and notable negative coverage.
GLD,Gold Articles: 15
- Positive: 66.67%
- Neutral: 20.00%
- Negative: 13.33%
Sentiment Summary: Gold-related coverage is predominantly positive at 67%, with 20% neutral and 13% negative across 15 articles.
Conclusion: The snapshot shows a positive tone toward gold, indicating a risk-sensitive market narrative relevant to index futures monitoring.
USO,Oil Articles: 7
- Positive: 42.86%
- Negative: 28.57%
- Neutral: 28.57%
Sentiment Summary: USO/Oil coverage was mixed-to-positive, with 43% positive, 29% negative, and 29% neutral articles across seven items.
Conclusion: Oil-related news sentiment showed a modest positive tilt, while negative and neutral coverage each represented roughly one-third of the sample.
Market Data Snapshot
ETF Snapshot of major stock market ETFs, Mag7, and others as of: August 21, 2026 05:00
Top Movers & Losers
- IBIT 43.68 Bullish 6.02% ▲
- TSLA 362.86 Bullish 5.14% ▲
- GLD 423.36 Bullish 1.95% ▲
- AMZN 258.63 Bearish -0.57% ▼
- AAPL 309.35 Bearish -0.63% ▼
- NVDA 214.72 Bearish -0.98% ▼
Major Index ETFs: SPY, QQQ, DIA, IWM, IJH
- DIA 532.22 Bullish 0.89% ▲
- IWM 299.96 Bullish 0.77% ▲
- IJH 76.77 Bullish 0.52% ▲
- SPY 765.72 Bullish 0.41% ▲
- QQQ 713.44 Bullish 0.35% ▲
Major index ETFs were Bullish across the group: DIA led with +0.89%, followed by IWM at +0.77% and IJH at +0.52%. SPY gained +0.41%, while QQQ was the least positive mover at +0.35%.
Mag 7 Stocks: AAPL, MSFT, GOOG, AMZN, META, NVDA, TSLA
- TSLA 362.86 Bullish 5.14% ▲
- GOOG 341.75 Bullish 1.05% ▲
- META 549.90 Bullish 0.75% ▲
- MSFT 483.24 Bullish 0.43% ▲
- AMZN 258.63 Bearish -0.57% ▼
- AAPL 309.35 Bearish -0.63% ▼
- NVDA 214.72 Bearish -0.98% ▼
Mixed: TSLA is the most bullish mover at +5.14%, followed by GOOG at +1.05%. META and MSFT are also Bullish at +0.75% and +0.43%. NVDA is the most bearish mover at -0.98%, with AAPL at -0.63% and AMZN at -0.57%.
Cross-Market ETFs: TLT, GLD, USO, IBIT
- IBIT 43.68 Bullish 6.02% ▲
- GLD 423.36 Bullish 1.95% ▲
- USO 134.64 Bullish 0.07% ▲
- TLT 82.05 Bearish -0.35% ▼
Mixed cross-market tone: IBIT is the most bullish mover at +6.02%, followed by GLD at +1.95%. USO is marginally Bullish at +0.07%. TLT is the most bearish mover at -0.35%.
ETF, Mag7, and Cross-Market ETF Insights
Overall Tone
Mixed conditions: equity index ETFs were broadly Bullish, while Mag7 leadership was selective and cross-market strength was led by IBIT.
Equity ETFs and Mag7:
Major Index ETFs were broadly Bullish, led by DIA at +0.89% and IWM at +0.77%, while QQQ was the least positive at +0.35%. Mag7 performance was Mixed: TSLA was the most bullish mover at +5.14%, while NVDA was the most bearish mover at -0.98%; GOOG, META, and MSFT were Bullish while AMZN and AAPL were Bearish. Equity strength was therefore broad among index ETFs but selective within large-cap technology.
Cross-Market ETFs:
Cross-market ETFs were Mixed, with IBIT the most bullish mover at +6.02% and GLD also Bullish at +1.95%. TLT was the most bearish mover at -0.35%, while USO was marginally Bullish at +0.07%. Strong IBIT and GLD contrasted with Bearish TLT and near-flat USO.
Futures Indices – Higher Time Frame Analysis
Summary of the current state of US Indices Futures based on higher time-frame (HTF) technical analysis as of: 2026-08-21: 17:00 CT.
US Indices Futures
- ES YSFG/MSFG up, WSFG down; benchmarks broadly rising; 7838.50 resistance, 7657.75 support, 7448.50 reversal pivot.
- NQ YSFG/MSFG above F0%, WSFG below F0%; rising long benchmarks; 30343 resistance, 29022.75 support, 27201.50 major pivot.
- YM YSFG/MSFG up, WSFG below F0%; benchmarks rising beyond 20-day; 54884 resistance, 52800 support, 52424 reversal pivot.
- EMD YSFG/MSFG up, WSFG below F0%; benchmarks rising; 3941.7 resistance, 3813.8 support, 3721.3 reversal pivot.
- RTY YSFG/MSFG up, WSFG down; price above major benchmarks; 3079.9 resistance, 2992.3 support, 2877.5 pivot reference.
- FDAX YSFG/MSFG up, WSFG below F0%; benchmarks rising; 26685 resistance, 25965 support, 25107 pivot reference.
Overall State
- Short-Term: Bearish
- Intermediate-Term: Bullish
- Long-Term: Bullish
Conclusion
ES, NQ, YM, EMD, RTY, and FDAX retain aligned intermediate- and long-term upward structures, supported by rising MSFG/YSFG positioning and 55-, 100-, and 200-period benchmarks. Daily and weekly WSFG readings are predominantly below F0%/NTZ areas, with short-term pivot trends down after rejection at major swing highs. Current index correlation reflects broad countertrend retracement conditions within higher-timeframe advances; listed pivot supports and resistances define the active structural ranges.
Note: Intra-day counter-trend pullbacks or retracements may occur, HTF is context for informational usage and market structure. Glossary: Session Fib Grids periods of YSFG:’Yearly’, MSFG:’Monthly’, WSFG:’Weekly’
For full details visit: AlphaWebTrader Technicals
ES Daily View
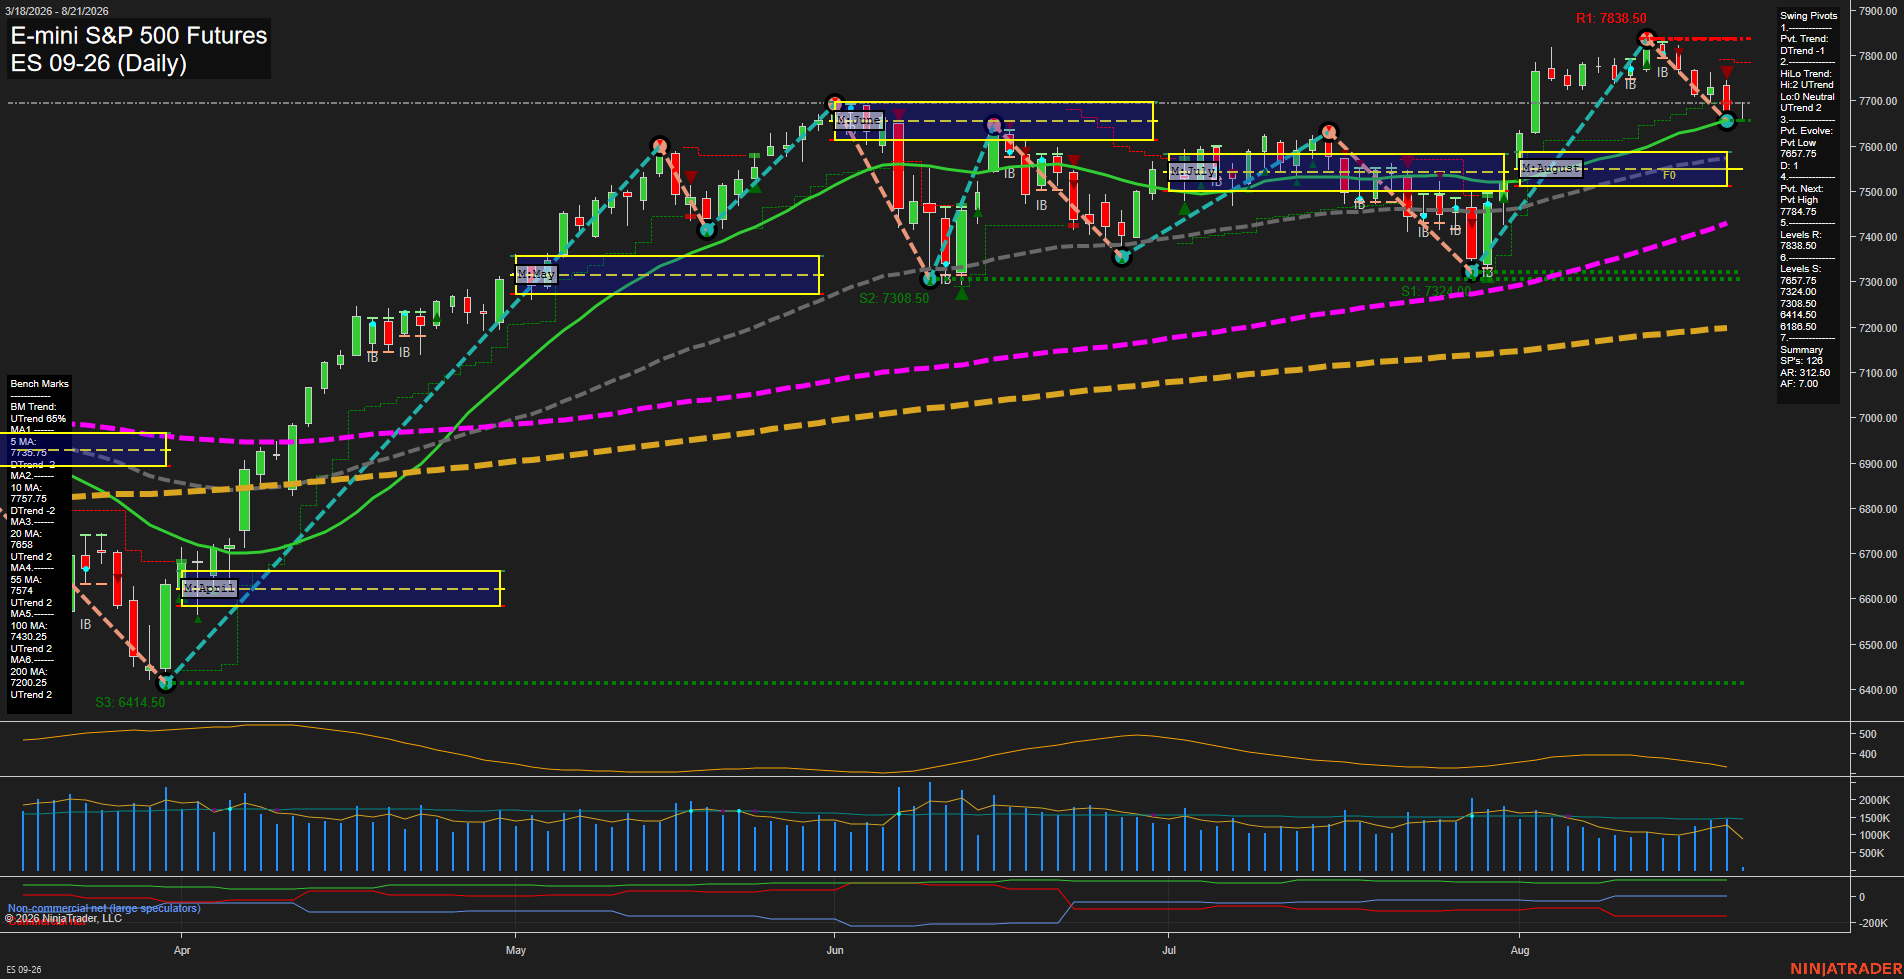
Overall Rating
- Short-Term: Bearish
- Intermediate-Term: Bullish
- Long-Term: Bullish.
Key Insights Summary
The daily structure shows a short-term pullback from the 7838.50 pivot high, with price below the weekly F0% area and both the 5-day and 10-day benchmarks declining. The active pivot trend is down, while the broader HiLo structure remains up and price is holding near the rising 20-day benchmark. The August monthly grid and 100-day, 200-day benchmarks retain an upward intermediate-to-long-term trend backdrop. The 7657.75 support area is the immediate structural reference beneath the market, while 7787.50 and 7838.50 define the nearby recovery and resistance sequence. Volatility remains elevated relative to a typical quiet consolidation, consistent with a choppy retracement inside a still-positive larger trend.
View charts on: AlphaWebTrader HTF Charts
NQ Daily View
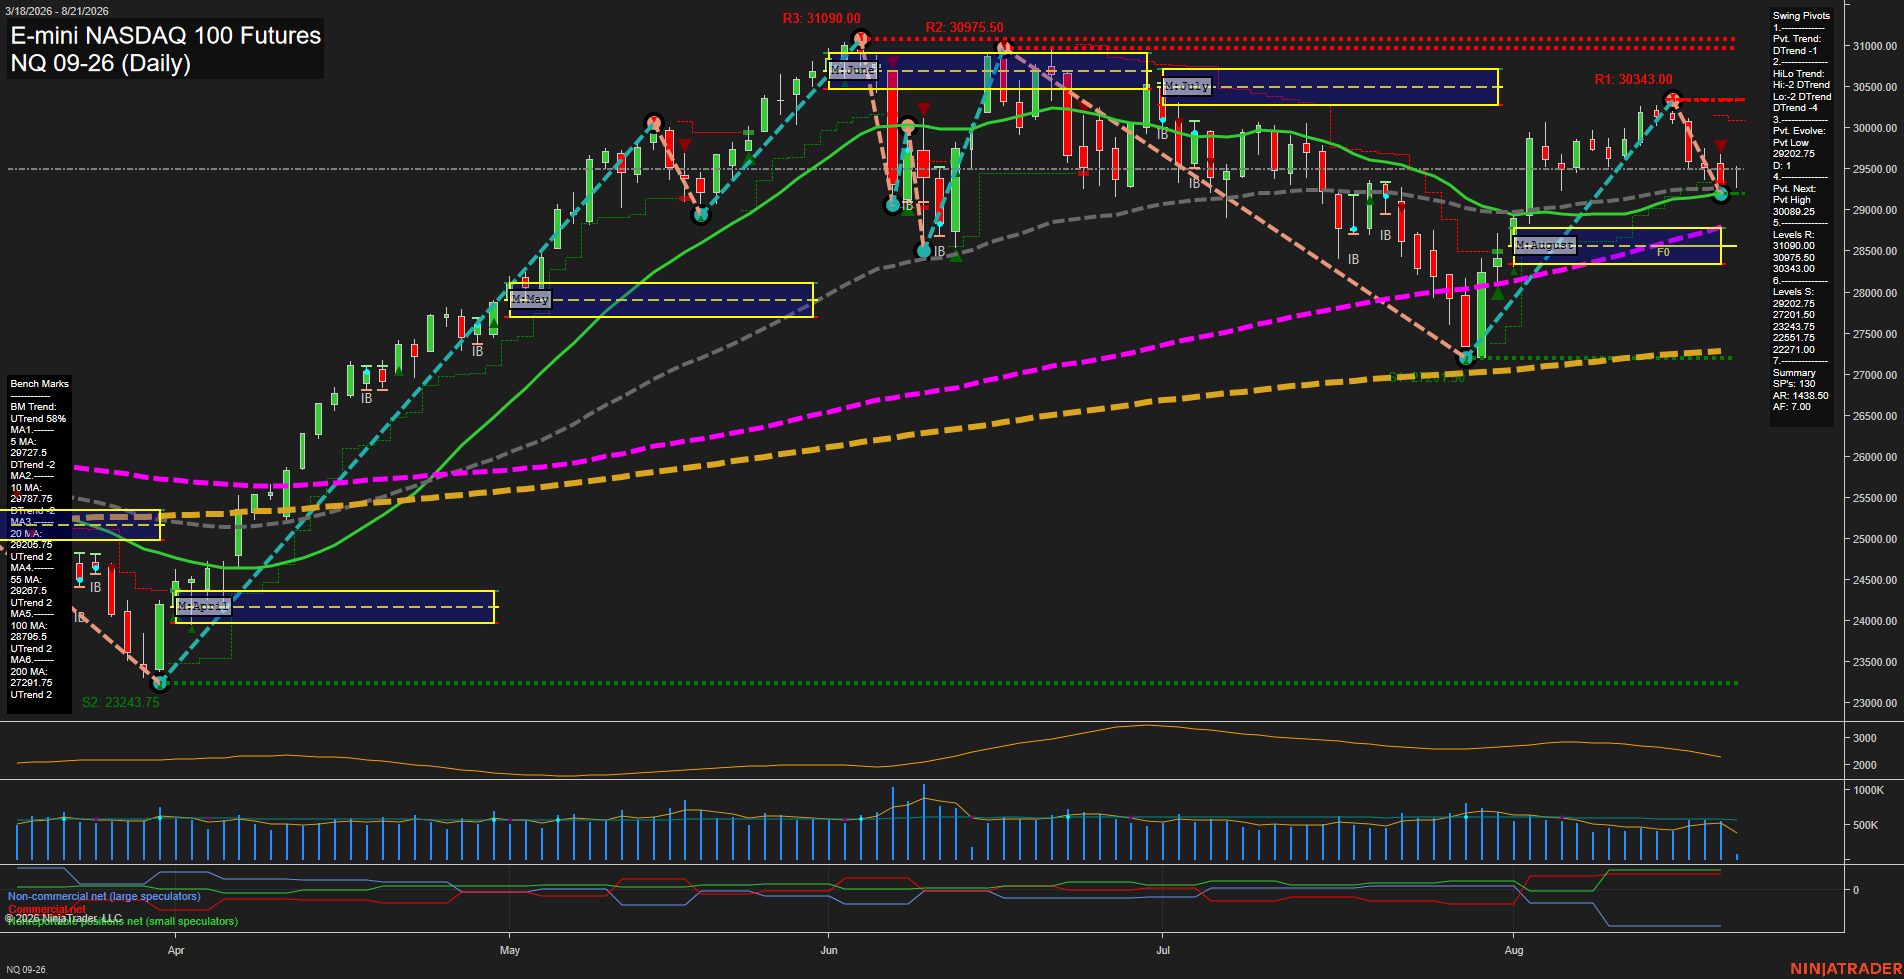
Overall Rating
- Short-Term: Bearish
- Intermediate-Term: Neutral
- Long-Term: Bullish.
Key Insights Summary
Price is consolidating following an August rebound from the 27201.50 swing-support region, but the latest pullback has restored a short-term DTrend and left price below the weekly F0% level. The 30013 short-term signal area and 30089.25 pivot threshold remain the key upside swing reference, with 30343.00 the next overhead resistance. Intermediate and long-term structure remains constructive because price is holding above the rising 20-, 55-, 100-, and 200-day benchmarks and remains above the monthly and yearly F0% zones. The present structure is a countertrend retracement within the larger advance, with 29022.75 as nearby pivot support and reduced momentum/volume participation indicating consolidation rather than an impulsive directional expansion.
View charts on: AlphaWebTrader HTF Charts
CL Daily View
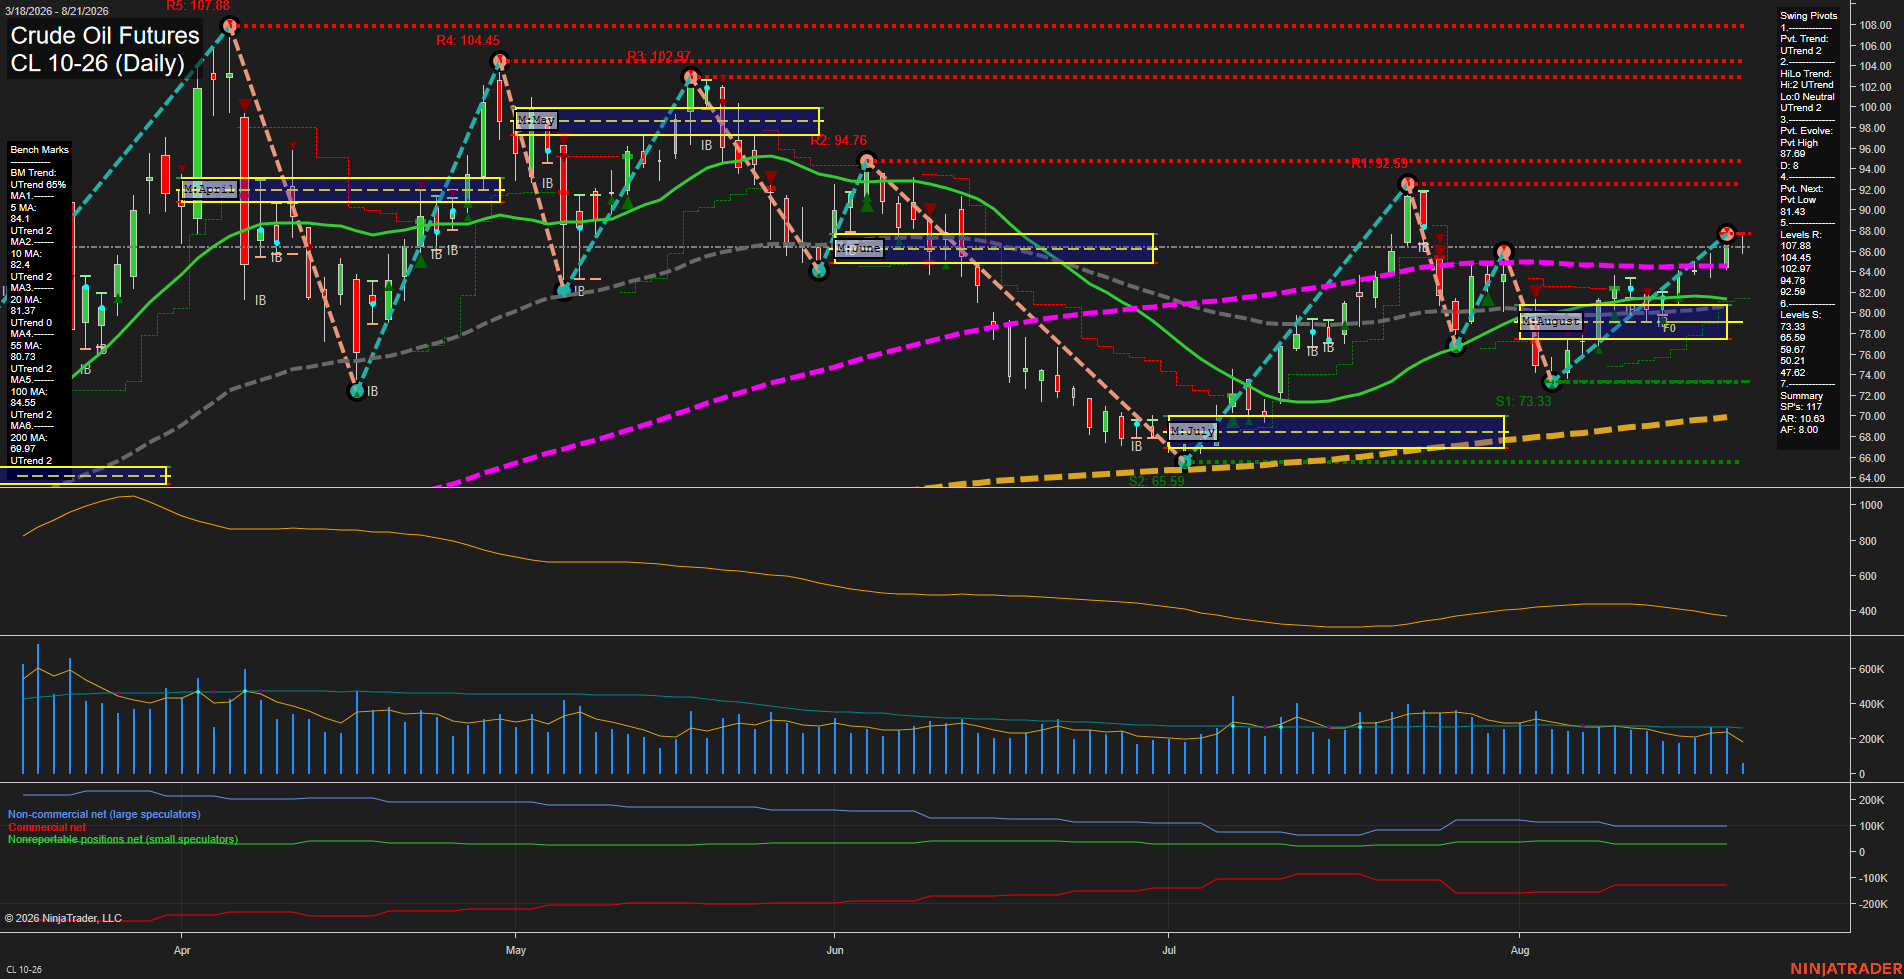
Overall Rating
- Short-Term: Bullish
- Intermediate-Term: Bullish
- Long-Term: Bullish.
Key Insights Summary
CL has extended its August rebound into a fast, medium-range upswing, with price at 87.00 holding above every daily benchmark and above the weekly and monthly fib-grid centers. Both pivot structures are UTrend, confirming higher-low behavior from the late-July low near 73.33. The current pivot is evolving as a high at 87.69, making that area the immediate swing inflection, while 81.43 defines the next indicated downside pivot threshold. The 92.59 to 94.76 resistance band is the next major overhead structure; below, the 5-day through 55-day averages clustered from 80.73 to 84.10 provide a technically constructive retracement zone. Long-term structure remains positive with price above the rising 100-day and 200-day benchmarks, while ATR near 10.63 reflects an actively volatile crude-oil swing environment.
View charts on: AlphaWebTrader HTF Charts
GC Daily View
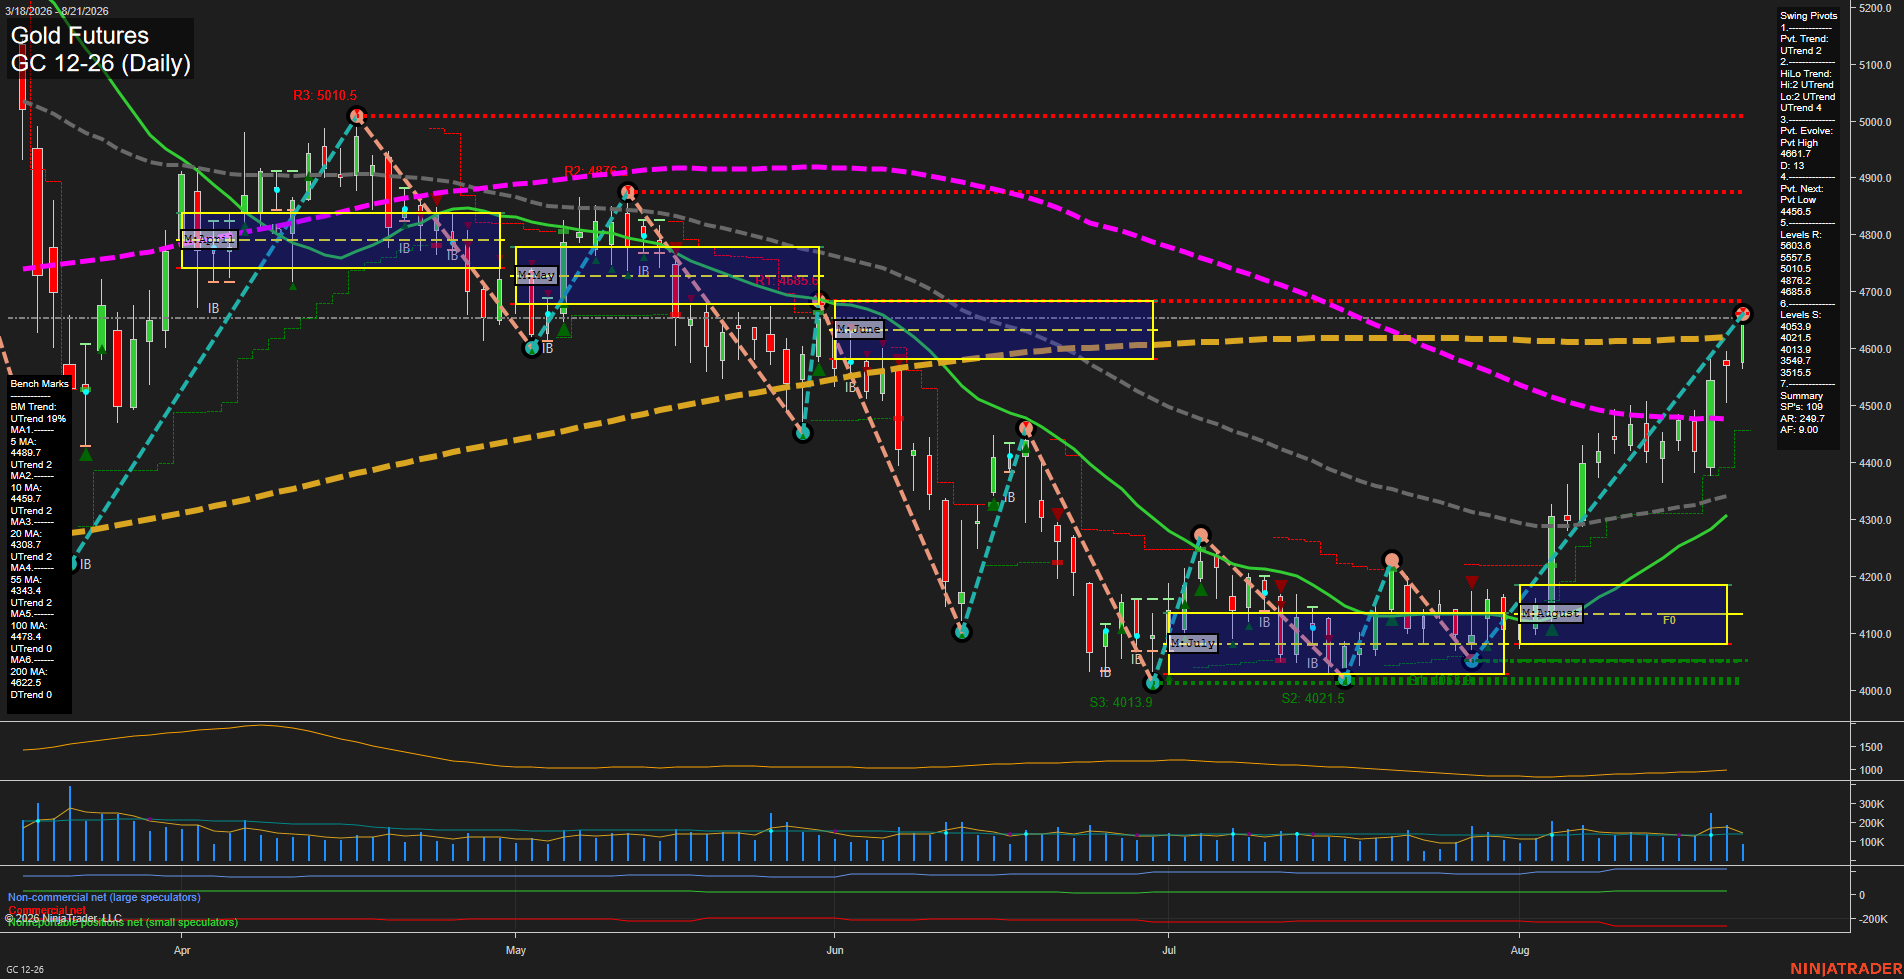
Overall Rating
- Short-Term: Bullish
- Intermediate-Term: Bullish
- Long-Term: Neutral.
Key Insights Summary
Gold has staged a sharp V-shaped recovery from the early-August 4014-4054 support zone, producing higher lows and regaining the 5, 10, 20, 55, and 100-day benchmarks. Short-term swing structure is upward, although price is approaching the 4685.6 pivot resistance and remains below the declining 200-day benchmark near 4622.5. The weekly and monthly fib grids remain positive, while the negative yearly grid position and overhead 200-day average leave the longer-term picture mixed. Elevated ATR and the rapid rebound indicate an active, high-volatility recovery phase rather than a low-range consolidation.
View charts on: AlphaWebTrader HTF Charts