U.S. stocks edged higher as Treasury buybacks lowered long-term yields, while gold surged and oil rose amid escalating UAE-Iran energy supply tensions.
Fundamentals: U.S. equities recovered modestly after Treasury expanded long-bond buybacks, pulling down long-dated yields and supporting bonds and precious metals. The Dow, S&P 500 and Nasdaq posted small gains, while gold climbed above $4,500 as the dollar weakened. Oil tested new highs despite a third straight U.S. crude inventory build, with UAE-Iran tensions adding supply concerns.
Technicals: IBIT, Tesla and GLD led notable ETF gains, while QQQ, IJH and Nvidia declined modestly. Futures analysis across the S&P 500, Nasdaq, Dow, Russell 2000, E-mini S&P, and DAX showed bearish short-term conditions after resistance tests and pullbacks. Intermediate- and long-term trends remained bullish, supported by rising benchmark averages and higher-order pivot structures.
After Market Close daily snapshot: market news summary and sentiment, major ETFs, Magnificent 7 analysis, Indices Futures Higher Time Frame Analysis, and E-mini S&P500, Nasdaq 100, NYMEX Crude, Gold Futures Daily Chart analysis.
As of: August 19, 2026 05:00 CT
Market News Summary:
Long-term Treasury buybacks drove yields lower, supporting a modest U.S. equity rebound and a sharp move higher in gold.
Primary Drivers & Risks:
- Primary Driver: Treasury long-bond buyback expansion
- Primary Risk: Iran-related energy supply tensions
Tone:
Constructive risk sentiment, with significant policy and geopolitical cross-currents.
Stock Market / ETFs / Indices:
U.S. stocks recovered from a three-day decline as Treasury yields fell. The Dow gained 0.22%, the S&P 500 rose 0.22%, and the Nasdaq added 0.16%; Moderna’s rally supported healthcare. IPO activity remained active, with AI-related companies representing more than half of capital raised in this year’s IPOs.
Geopolitical:
The UAE halted trade with Iran after reporting missiles fired in its direction, while President Trump said no negotiations with Tehran were planned. Trump also stated that the U.S. had reached a trade agreement with Canada.
Oil / Energy:
U.S. commercial crude inventories increased by 4.4 million barrels, marking a third consecutive weekly build. Despite the inventory increase, WTI and Brent tested new highs as UAE-Iran tensions intensified.
Gold / Metals:
Gold surged above $4,500 and reached a two-month high as long-dated Treasury yields declined and the dollar weakened. Silver and platinum also gained attention alongside the bond-market rally, while the GDX gold-miner ETF advanced.
Fed / Financials:
The Treasury Department increased buyback operations for longer-term debt, contributing to lower long-end yields and stronger demand for Treasury exposure. U.S.-listed fixed-income ETFs drew $13.2 billion in weekly inflows, while total federal debt surpassed $40 trillion. Trump renewed pressure on the Federal Reserve to lower interest rates.
Macro / Other:
Concerns persisted around the durability of the AI-led market advance, with recession and valuation risks cited alongside rising capital needs for data centers, military spending, and reshoring.
Conclusion:
Treasury long-bond buybacks lowered yields and supported equities, bonds, and precious metals. Gold posted a pronounced advance as the dollar weakened and long-dated Treasuries rallied.
Iran-related tensions lifted oil despite another U.S. crude inventory build. Federal debt levels, rate-policy pressure, and concerns over AI valuations remained important cross-currents.
Market News Sentiment
Market News Articles: 34
- Neutral: 50.00%
- Negative: 32.35%
- Positive: 17.65%
Sentiment Summary: Of 34 market news articles, 50% were neutral, 32% negative, and 18% positive, indicating predominantly neutral coverage with a negative skew among directional articles.
Conclusion: Indices futures day traders are facing mixed news flow, with negative articles outnumbering positive articles.
GLD,Gold Articles: 13
- Positive: 76.92%
- Neutral: 23.08%
Sentiment Summary: Gold (GLD) article sentiment is positive at 77%, with 23% neutral coverage across 13 articles.
Conclusion: The snapshot shows predominantly positive gold-related news sentiment, which may be relevant to indices futures traders monitoring cross-asset risk tone.
USO,Oil Articles: 7
- Negative: 42.86%
- Positive: 28.57%
- Neutral: 28.57%
Sentiment Summary: USO and oil coverage is mixed-to-negative, with 43% negative, 29% positive, and 29% neutral articles across 7 articles.
Conclusion: Oil-related news tone is net negative, which may remain a relevant cross-market sentiment input for index futures traders.
Market Data Snapshot
ETF Snapshot of major stock market ETFs, Mag7, and others as of: August 19, 2026 05:00
Top Movers & Losers
- IBIT 38.78 Bullish 5.96% ▲
- TSLA 351.12 Bullish 4.23% ▲
- GLD 413.84 Bullish 3.84% ▲
- QQQ 716.08 Bearish -0.20% ▼
- IJH 77.04 Bearish -0.26% ▼
- NVDA 217.56 Bearish -0.99% ▼
Major Index ETFs: SPY, QQQ, DIA, IWM, IJH
- IWM 301.72 Bullish 0.50% ▲
- DIA 534.27 Bullish 0.26% ▲
- SPY 769.06 Bullish 0.21% ▲
- QQQ 716.08 Bearish -0.20% ▼
- IJH 77.04 Bearish -0.26% ▼
Mixed index ETF snapshot: IWM is the most bullish mover at +0.50%, followed by DIA at +0.26% and SPY at +0.21%. IJH is the most bearish mover at -0.26%, while QQQ is modestly Bearish at -0.20%.
Mag 7 Stocks: AAPL, MSFT, GOOG, AMZN, META, NVDA, TSLA
- TSLA 351.12 Bullish 4.23% ▲
- AMZN 265.84 Bullish 2.46% ▲
- AAPL 316.83 Bullish 2.19% ▲
- MSFT 484.31 Bullish 0.56% ▲
- META 546.03 Bullish 0.43% ▲
- GOOG 341.70 Bullish 0.12% ▲
- NVDA 217.56 Bearish -0.99% ▼
Mag7 was Bullish overall, led by TSLA at +4.23%, the most bullish mover, followed by AMZN at +2.46% and AAPL at +2.19%. MSFT rose +0.56%, META gained +0.43%, and GOOG was marginally Bullish at +0.12%. NVDA was the most bearish mover at -0.99%.
Cross-Market ETFs: TLT, GLD, USO, IBIT
- IBIT 38.78 Bullish 5.96% ▲
- GLD 413.84 Bullish 3.84% ▲
- TLT 83.02 Bullish 1.67% ▲
- USO 130.91 Bullish 0.19% ▲
Other ETFs were Bullish across the snapshot: IBIT led as the most bullish mover at +5.96%, followed by GLD at +3.84% and TLT at +1.67%. USO was the least positive mover at +0.19%, a modest gain.
ETF, Mag7, and Cross-Market ETF Insights
Overall Tone
Mixed conditions: strong Bullish gains in IBIT, GLD, and selected Mag7 names contrast with marginal-to-Bearish movement in QQQ, IJH, and NVDA.
Equity ETFs and Mag7:
Major Index ETFs were Mixed, with IWM +0.50%, DIA +0.26%, and SPY +0.21% Bullish, while QQQ -0.20% and IJH -0.26% were Bearish. Mag7 leadership was selective: TSLA was the most bullish mover at +4.23%, followed by AMZN at +2.46% and AAPL at +2.19%, while NVDA was the most bearish mover at -0.99%. MSFT +0.56%, META +0.43%, and near-flat GOOG +0.12% added modest Bullish support.
Cross-Market ETFs:
Cross-Market ETFs were broadly Bullish, led by IBIT, the most bullish mover, at +5.96%, with GLD also strongly Bullish at +3.84%. TLT gained +1.67%, while USO was the least positive mover at a marginal +0.19%. Strength in IBIT, GLD, and TLT diverged from the Mixed equity ETF tape.
Futures Indices – Higher Time Frame Analysis
Summary of the current state of US Indices Futures based on higher time-frame (HTF) technical analysis as of: 2026-08-19: 17:00 CT.
US Indices Futures
- ES YSFG/MSFG above F0%, WSFG below F0%; above rising 20/55/100/200-day benchmarks; 7838.50 resistance, 7697.00 pivot support; short-term pullback within UTrend.
- NQ YSFG/MSFG above F0%, WSFG bearish; above rising 20/55/100/200-day benchmarks; 30343 resistance, 29339 pivot, 29189-29257 benchmark support; countertrend recovery/pullback structure.
- YM YSFG/MSFG above F0%, WSFG below F0%; above rising 20/55/100/200-day benchmarks; 54884 resistance, 53381 pivot, 52430-52442 support; short-term retracement.
- EMD YSFG/MSFG above F0%, WSFG below F0%; above rising 20/55/100/200-day benchmarks; 3947.7 resistance, 3835.7 pivot, 3730.5-3724.0 support; short-term decline.
- RTY YSFG/MSFG above F0%, WSFG below F0%; above rising 20/55/100/200-day benchmarks; 3079.9 resistance, 3006.9 pivot, 3002.2 benchmark support; corrective downswing.
- FDAX YSFG/MSFG above F0%, WSFG down; above rising 20/55/100/200-day benchmarks; 26665 resistance, 26115 swing low, 25113 pivot-reversal reference; corrective structure.
Overall State
- Short-Term: Bearish
- Intermediate-Term: Bullish
- Long-Term: Bullish
Conclusion
All six indices share bearish short-term WSFG or signal conditions following rejection or retracement from recent pivot highs. YSFG and MSFG conditions, rising benchmark alignment, and intermediate pivot structures remain bullish across the group. Price is testing nearby pivot and benchmark support beneath defined swing-high resistance, maintaining synchronized corrective action within broader intermediate- and long-term uptrends.
Note: Intra-day counter-trend pullbacks or retracements may occur, HTF is context for informational usage and market structure. Glossary: Session Fib Grids periods of YSFG:’Yearly’, MSFG:’Monthly’, WSFG:’Weekly’
For full details visit: AlphaWebTrader Technicals
ES Daily View
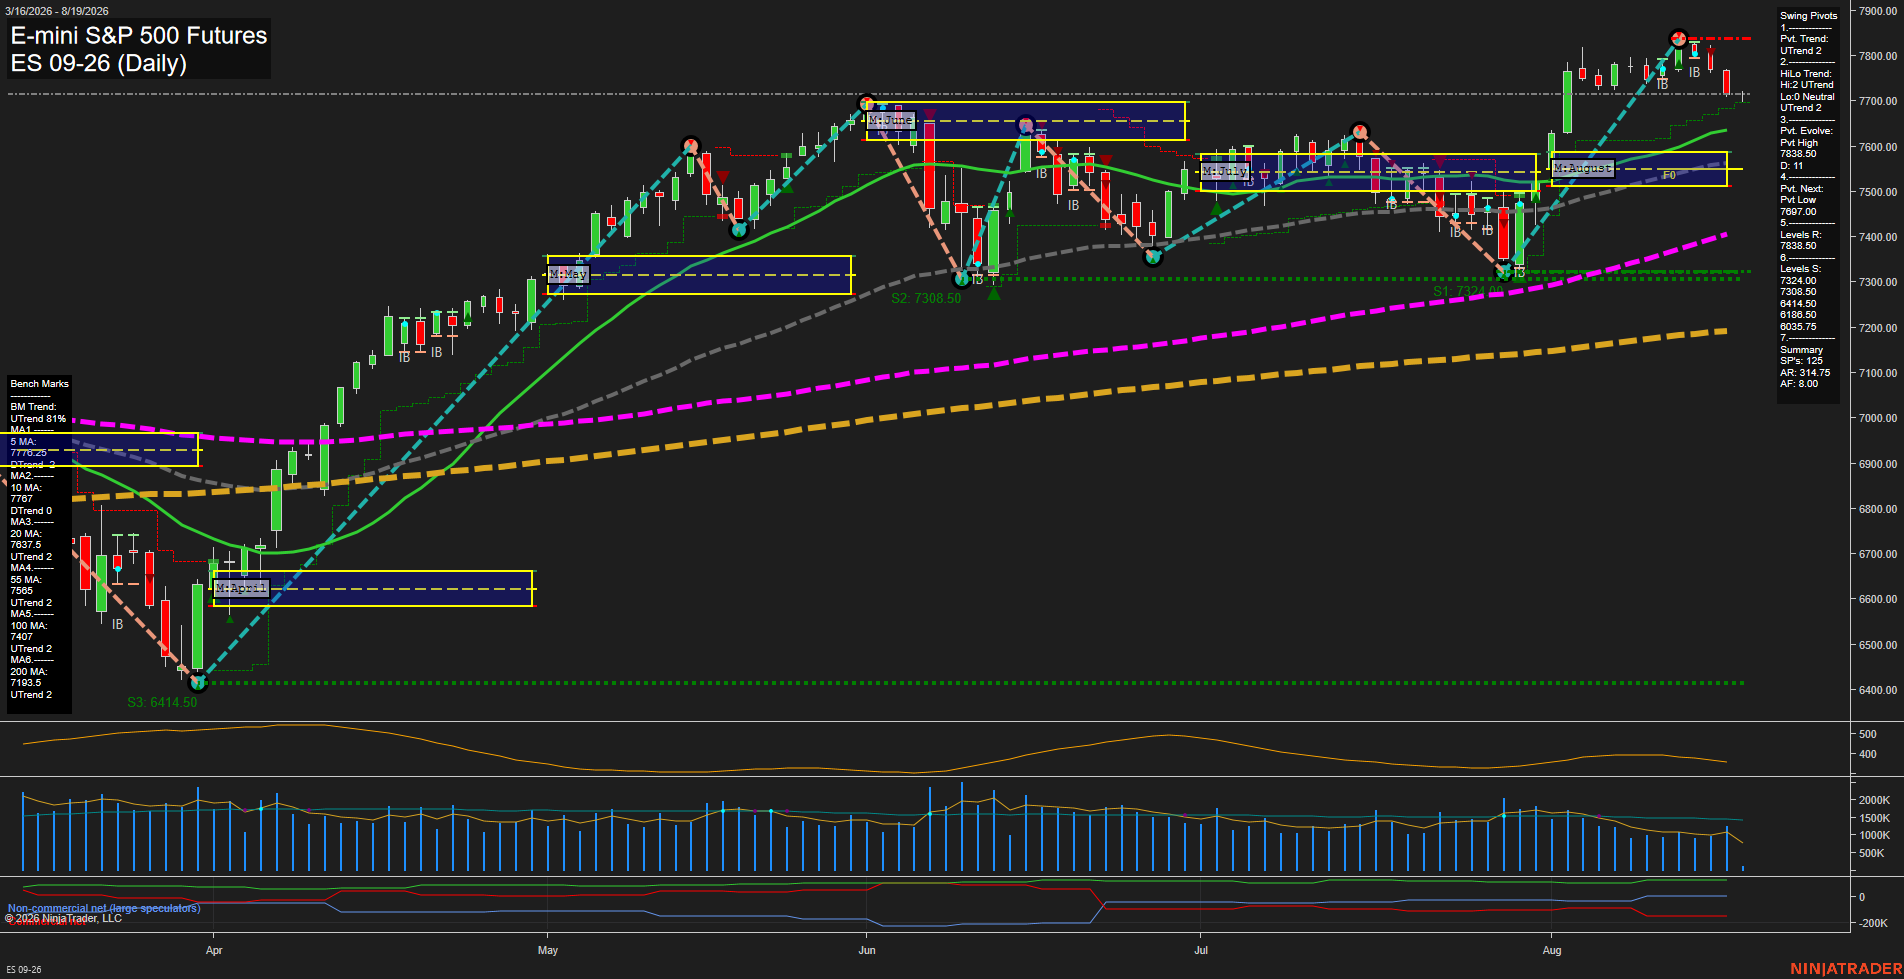
Overall Rating
- Short-Term: Bearish
- Intermediate-Term: Bullish
- Long-Term: Bullish.
Key Insights Summary
The daily structure remains bullish on the intermediate and long-term time frames, with price above the rising 20, 55, 100, and 200 day benchmarks and both pivot trend measures still in UTrend. Short-term action has shifted into a fast downside retracement from the 7838.50 pivot high, reflected by price trading below the 5 and 10 day averages, a weekly Fib Grid position below F0%, and concurrent short-term short signals. The 7697.00 pivot-next level defines the nearby reversal threshold, while 7838.50 remains the dominant overhead swing resistance. August price remains above the monthly F0% area, framing the current decline as a counter-trend pullback within the broader advance unless the intermediate support structure weakens materially.
View charts on: AlphaWebTrader HTF Charts
NQ Daily View
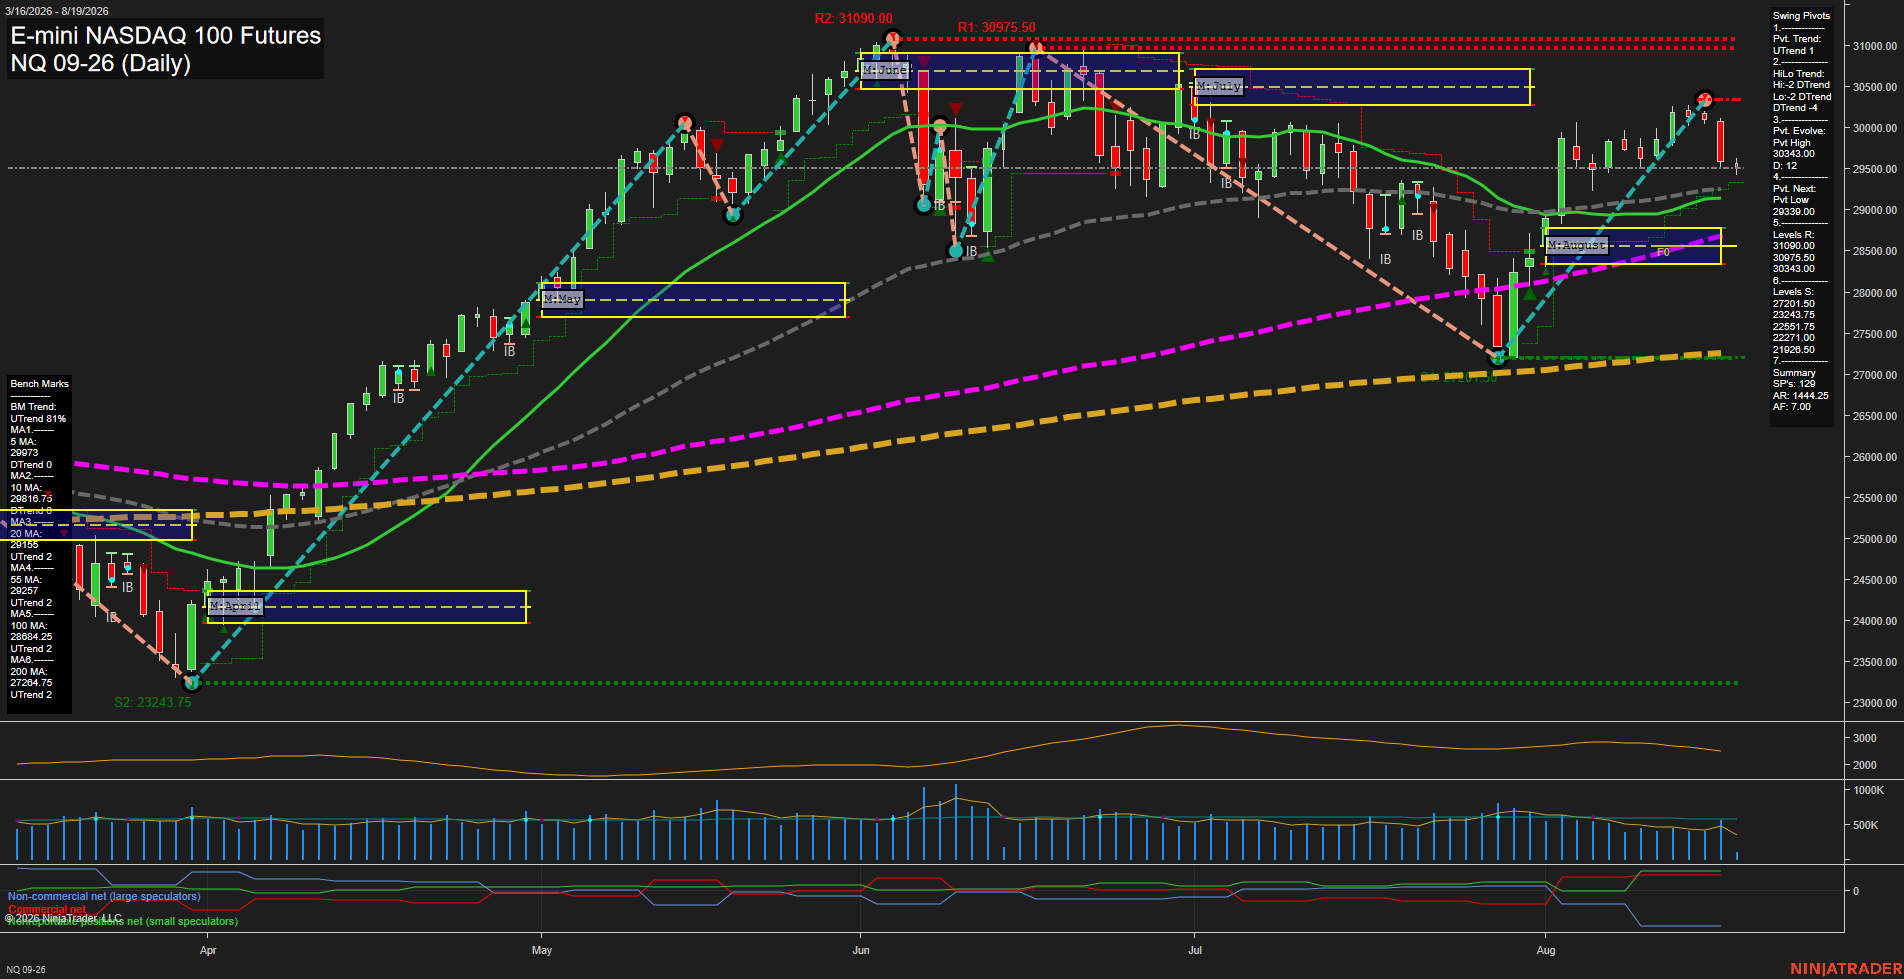
Overall Rating
- Short-Term: Bearish
- Intermediate-Term: Bullish
- Long-Term: Bullish.
Key Insights Summary
The daily structure reflects a sharp countertrend pullback from the 30103 pivot high, with price below the weekly F0% level, below the 5 and 10 day benchmarks, and a short-term downside signal active. The 29339 pivot-next level is the immediate structural reference after the large bearish bar. Intermediate and long-term structure remains constructive because price holds above the August monthly F0% region and the rising 20, 55, 100, and 200 day benchmarks. The market is operating as a volatile pullback within the broader 2026 advance, with 30343 as nearby overhead pivot resistance and the 29189 to 29257 moving-average area defining the closest intermediate-term support zone.
View charts on: AlphaWebTrader HTF Charts
CL Daily View
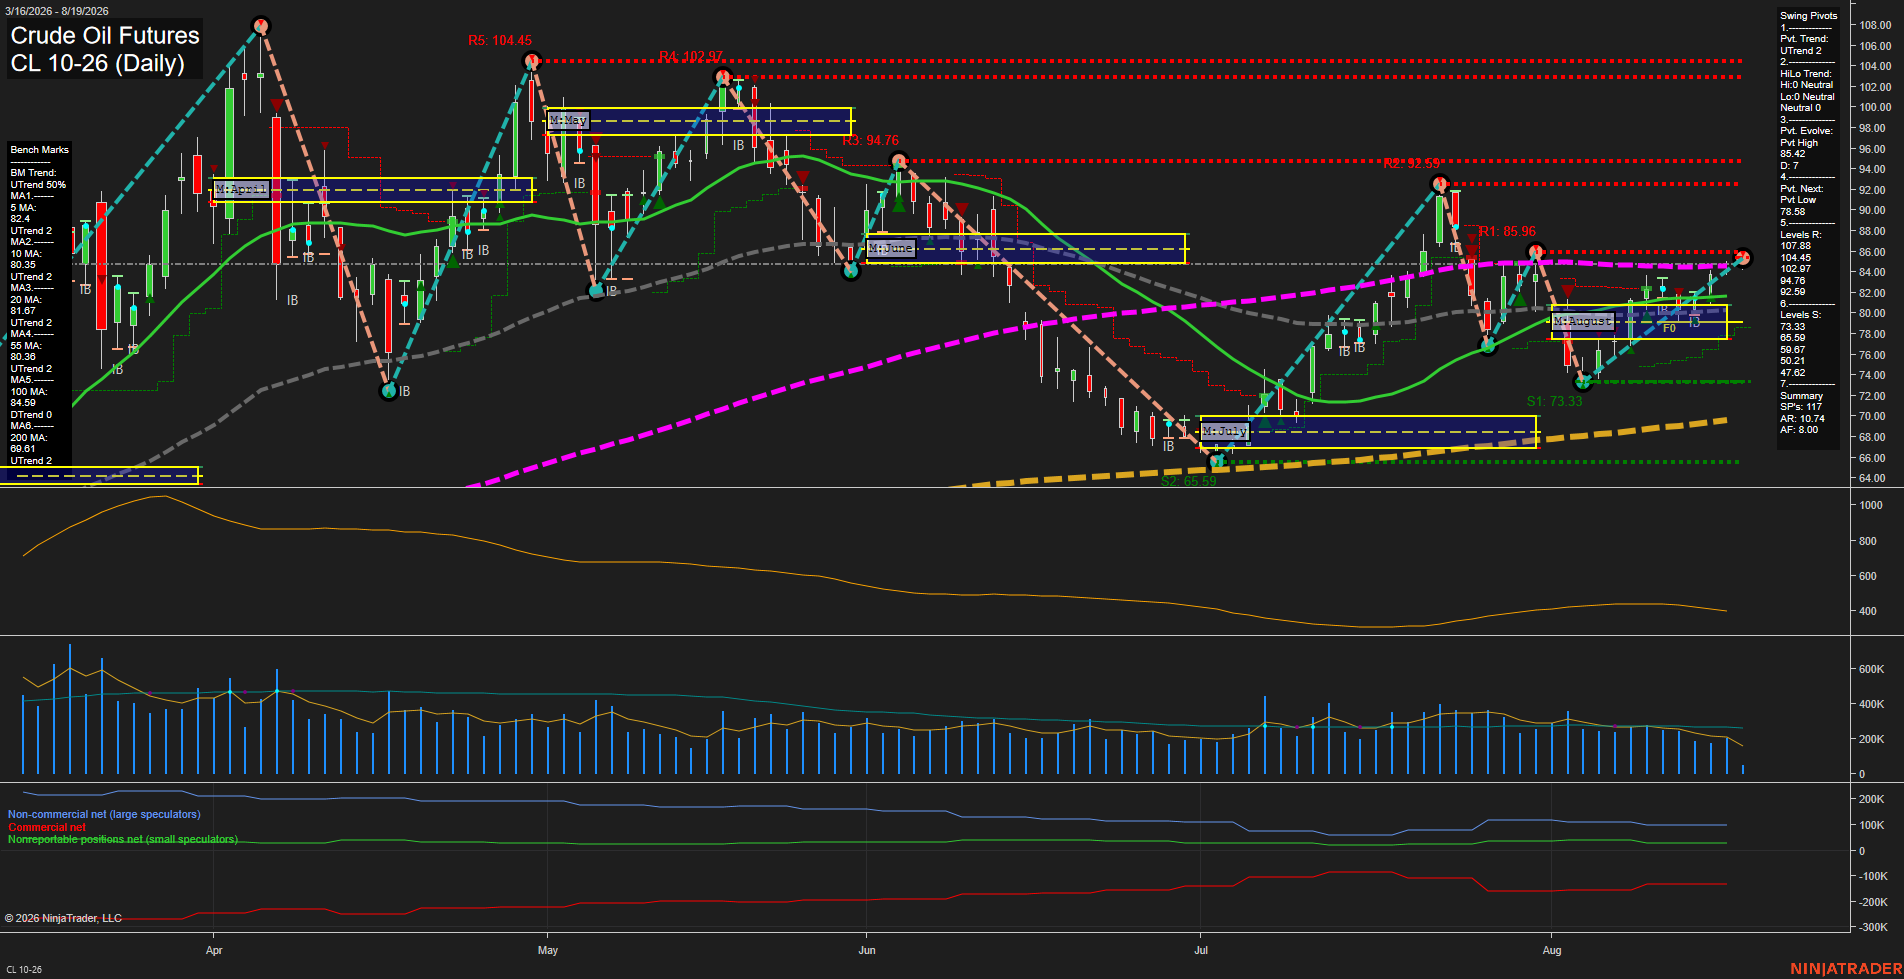
Overall Rating
- Short-Term: Bullish
- Intermediate-Term: Bullish
- Long-Term: Bullish.
Key Insights Summary
Price has recovered from the late-July selloff with higher lows from the 73.33 pivot low and has reclaimed the rising short-term benchmark cluster. The weekly and monthly Fib-grid readings remain above F0%, supporting an upward short-to-intermediate-term swing structure, while the 200-day benchmark remains firmly upward. Momentum has slowed as price approaches the 85.47 evolving pivot high and nearby 85.96 resistance; this creates a consolidation zone beneath the larger 92.59 and 94.76 resistance levels. The intermediate HiLo trend remains neutral because the broader structure is still rebuilding following the June-to-July decline, while the 100-day average remains slightly downward near price.
View charts on: AlphaWebTrader HTF Charts
GC Daily View
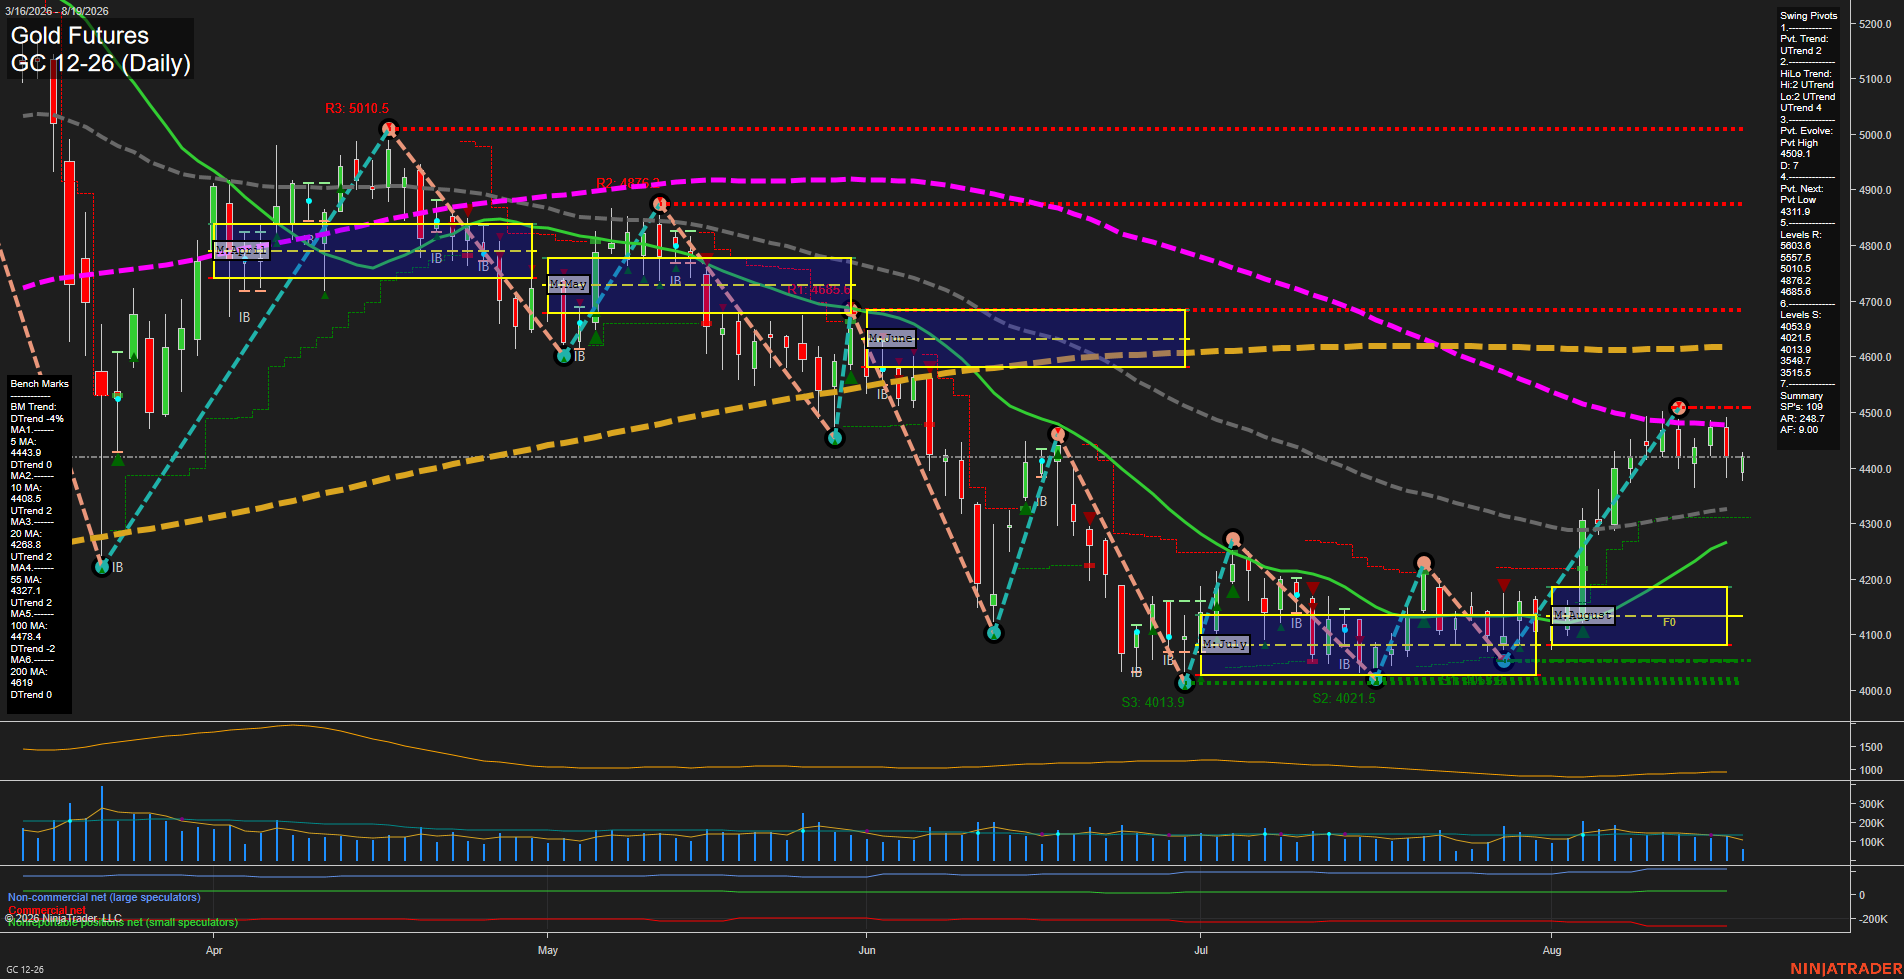
Overall Rating
- Short-Term: Bearish
- Intermediate-Term: Bullish
- Long-Term: Bearish.
Key Insights Summary
Gold is retracing lower after the August rally peaked at the 4509.1 pivot high, with price now below the declining 5-day average and slightly below the 10-day benchmark. The weekly grid is below F0% and short-term signal flow is bearish, while the active pivot structure and rising 20-day and 55-day averages retain an intermediate-term recovery profile. Price remains beneath falling 100-day and 200-day averages, defining the larger trend as bearish. The current structure reflects a medium-range pullback within an intermediate rebound, with 4311.9 as the next pivot reversal reference and 4509.1 as the nearest swing-high rejection area.
View charts on: AlphaWebTrader HTF Charts