U.S. stocks and bonds fell as Treasury yields and crude prices rose, while Iran war risks, weak retail results and inflation concerns weighed on markets.
Fundamentals: U.S. equities and Treasuries ended lower as rising yields and crude prices intensified pressure on risk assets. Walmart's weak earnings and mixed retail signals added to consumer concerns, while the U.S.-Iran conflict remained a source of inflation anxiety. Gold retreated from monthly highs on profit-taking, and expanded Treasury buybacks did not prevent a bond-market selloff.
Technicals: Equity ETFs showed mixed closing action, with IBIT and USO advancing while Tesla, Apple and Amazon declined. Futures analysis found short-term consolidation or bearish pullbacks across several major contracts, including Nasdaq, Dow, E-mini S&P, EMD and FDAX. Despite near-term weakness beneath recent pivot highs, intermediate- and long-term trend structures remained broadly positive.
After Market Close daily snapshot: market news summary and sentiment, major ETFs, Magnificent 7 analysis, Indices Futures Higher Time Frame Analysis, and E-mini S&P500, Nasdaq 100, NYMEX Crude, Gold Futures Daily Chart analysis.
As of: August 20, 2026 05:00 CT
Market News Summary:
U.S. stocks and bonds declined as rising Treasury yields, higher crude prices, and consumer concerns outweighed Treasury buyback support.
Primary Drivers & Risks:
- Primary Driver: Rising Treasury yields pressure equities
- Primary Risk: Iran war and oil inflation
Tone:
Risk-off, with rate and energy pressures dominating.
Stock Market / ETFs / Indices:
U.S. equities closed lower, with the Dow down more than 1% and reported down roughly 600 points. Rising yields, higher crude prices, and Walmart’s weak earnings weighed on sentiment; some commentary also cited elevated equity valuations and AI-bubble concerns.
Geopolitical:
The U.S.-Iran war remained a key source of market anxiety, cited alongside inflation concerns and the oil-price spike. The conflict was approaching its sixth month.
Oil / Energy:
Crude prices rose as WTI tested major resistance, while a wider refining crack spread pointed to persistent pressure on U.S. gasoline prices. Higher energy costs added to inflation and consumer-spending concerns.
Gold / Metals:
Gold moved away from monthly highs as traders took profits after a strong rally, while broader gold commentary remained focused on Treasury purchases, liquidity conditions, and higher long-term price targets. Silver’s long-term demand outlook drew support from projected data-center electronics consumption.
Fed / Financials:
Treasuries fell despite expanded long-dated Treasury buybacks, with doubts that the program addressed the underlying drivers of higher yields, including government debt and inflation concerns. The dollar also faced pressure in commentary around the buyback plan, while mortgage rates edged down to 6.65%.
Macro / Other:
Jobless claims fell, but mixed retail results and Walmart’s earnings raised concerns about consumer health. Commentary also noted inflation expectations remained anchored, despite renewed market focus on rates and energy costs.
Conclusion:
Rising Treasury yields and crude prices were the main cross-asset pressures, driving a decline in U.S. stocks and bonds. Treasury buybacks did not prevent the bond-market selloff.
The Iran conflict, higher fuel costs, and weaker consumer signals intensified inflation and growth concerns. Gold retained broader support despite profit-taking, while bullish equity and AI themes remained counterpoints to the session’s risk-off move.
Market News Sentiment
Market News Articles: 32
- Positive: 50.00%
- Neutral: 37.50%
- Negative: 12.50%
Sentiment Summary: Market news sentiment is balanced-to-positive, with 50% positive, 38% neutral, and 13% negative coverage across 32 articles.
Conclusion: Indices futures day traders are facing a predominantly positive news tone, though neutral coverage remains substantial.
GLD,Gold Articles: 14
- Positive: 50.00%
- Negative: 35.71%
- Neutral: 14.29%
Sentiment Summary: Gold coverage is mixed-to-positive, with 50% positive, 36% negative, and 14% neutral articles across 14 items.
Conclusion: For indices futures day traders, gold-related news tone is slightly positive but remains divided.
USO,Oil Articles: 8
- Positive: 37.50%
- Neutral: 37.50%
- Negative: 25.00%
Sentiment Summary: USO and oil coverage was mixed, with 38% positive, 38% neutral, and 25% negative articles.
Conclusion: Oil-related news tone was balanced overall, with positive and neutral coverage jointly outweighing negative coverage.
Market Data Snapshot
ETF Snapshot of major stock market ETFs, Mag7, and others as of: August 20, 2026 05:00
Top Movers & Losers
- IBIT 41.20 Bullish 6.24% ▲
- USO 134.54 Bullish 2.77% ▲
- GLD 415.26 Bullish 0.34% ▲
- TSLA 345.13 Bearish -1.71% ▼
- AAPL 311.30 Bearish -1.75% ▼
- AMZN 260.11 Bearish -2.16% ▼
Major Index ETFs: SPY, QQQ, DIA, IWM, IJH
- QQQ 710.93 Bearish -0.72% ▼
- SPY 762.60 Bearish -0.84% ▼
- IJH 76.37 Bearish -0.87% ▼
- DIA 527.59 Bearish -1.25% ▼
- IWM 297.67 Bearish -1.34% ▼
Major index ETFs were Bearish across the board: IWM led losses at -1.34%, followed by DIA at -1.25%, IJH at -0.87%, SPY at -0.84%, and QQQ was the least negative mover at -0.72%.
Mag 7 Stocks: AAPL, MSFT, GOOG, AMZN, META, NVDA, TSLA
- META 545.83 Bearish -0.04% ▼
- NVDA 216.85 Bearish -0.33% ▼
- MSFT 481.15 Bearish -0.65% ▼
- GOOG 338.20 Bearish -1.02% ▼
- TSLA 345.13 Bearish -1.71% ▼
- AAPL 311.30 Bearish -1.75% ▼
- AMZN 260.11 Bearish -2.16% ▼
Mag7 was Bearish across the group. META was the least negative mover at -0.04%, remaining marginally lower, while AMZN was the most bearish mover at -2.16%. AAPL -1.75%, TSLA -1.71%, GOOG -1.02%, MSFT -0.65%, and NVDA -0.33% were also Bearish.
Cross-Market ETFs: TLT, GLD, USO, IBIT
- IBIT 41.20 Bullish 6.24% ▲
- USO 134.54 Bullish 2.77% ▲
- GLD 415.26 Bullish 0.34% ▲
- TLT 82.34 Bearish -0.82% ▼
Cross-market conditions were Mixed: IBIT was the most bullish mover at +6.24%, followed by USO at +2.77% and GLD at +0.34%. TLT was the most bearish mover at -0.82%.
ETF, Mag7, and Cross-Market ETF Insights
Overall Tone
Bearish equity ETFs and Mag7 performance alongside Bullish crypto, energy, and gold positioning reflects a Mixed cross-market tone.
Equity ETFs and Mag7:
Major Index ETFs were broadly Bearish, led lower by IWM at -1.34%, DIA at -1.25%, and SPY at -0.84%; QQQ was the least negative major index ETF at -0.72%. Mag7 performance was also Bearish and selective, with AMZN the most bearish mover at -2.16%, followed by AAPL at -1.75% and TSLA at -1.71%. META was marginally lower and the least negative Mag7 name at -0.04%.
Cross-Market ETFs:
Cross-market ETFs diverged from equities, with IBIT the most bullish mover at +6.24% and USO also Bullish at +2.77%. GLD added a modest +0.34%, while TLT was the most bearish cross-market ETF at -0.82%. Bullish crypto, energy, and gold contrasted with Bearish equities and Treasuries.
Futures Indices – Higher Time Frame Analysis
Summary of the current state of US Indices Futures based on higher time-frame (HTF) technical analysis as of: 2026-08-20: 17:00 CT.
US Indices Futures
- ES Bullish weekly structure; YSFG/MSFG above F0%, WSFG below F0%; benchmarks rising; resistance 7838.50, support 7705.50; daily consolidation.
- NQ Neutral weekly, bearish daily; YSFG/MSFG above F0%, WSFG below F0%; rising benchmarks; resistance 30343-31090, support 29404.50, 27565.
- YM Neutral weekly, bearish daily; YSFG/MSFG above F0%, WSFG below F0%; rising benchmarks; resistance 54884, supports 53264, 52438, 51630.
- EMD Neutral weekly, bearish daily; YSFG/MSFG above F0%, WSFG below NTZ; rising longer benchmarks; resistance 3941.7, supports 3847.8, 3804.7.
- RTY Neutral short-term, bullish higher structure; YSFG/MSFG above F0%, WSFG below F0%; rising benchmarks; resistance 3071.1-3079.9, supports 3008.9, 2878.5.
- FDAX Bearish short-term, bullish higher structure; YSFG/MSFG above F0%, WSFG below F0%; rising longer benchmarks; resistance 26685-26865, supports 25979, 25107, 24715.
Overall State
- Short-Term: Bearish
- Intermediate-Term: Bullish
- Long-Term: Bullish
Conclusion
US index futures retain aligned intermediate- and long-term bullish structures: YSFG and MSFG readings are generally above F0%, and longer benchmark averages are rising. Short-term conditions are mixed to bearish, with WSFG readings below F0% or NTZ across the group and daily pullbacks beneath short benchmarks. ES shows relative short-term resilience, while NQ, YM, EMD, and FDAX carry active daily downside structures. RTY remains mixed near its August pivot zone. Recent pivot highs define resistance, while stated pivot lows and rising intermediate benchmarks define structural support.
Note: Intra-day counter-trend pullbacks or retracements may occur, HTF is context for informational usage and market structure. Glossary: Session Fib Grids periods of YSFG:’Yearly’, MSFG:’Monthly’, WSFG:’Weekly’
For full details visit: AlphaWebTrader Technicals
ES Daily View
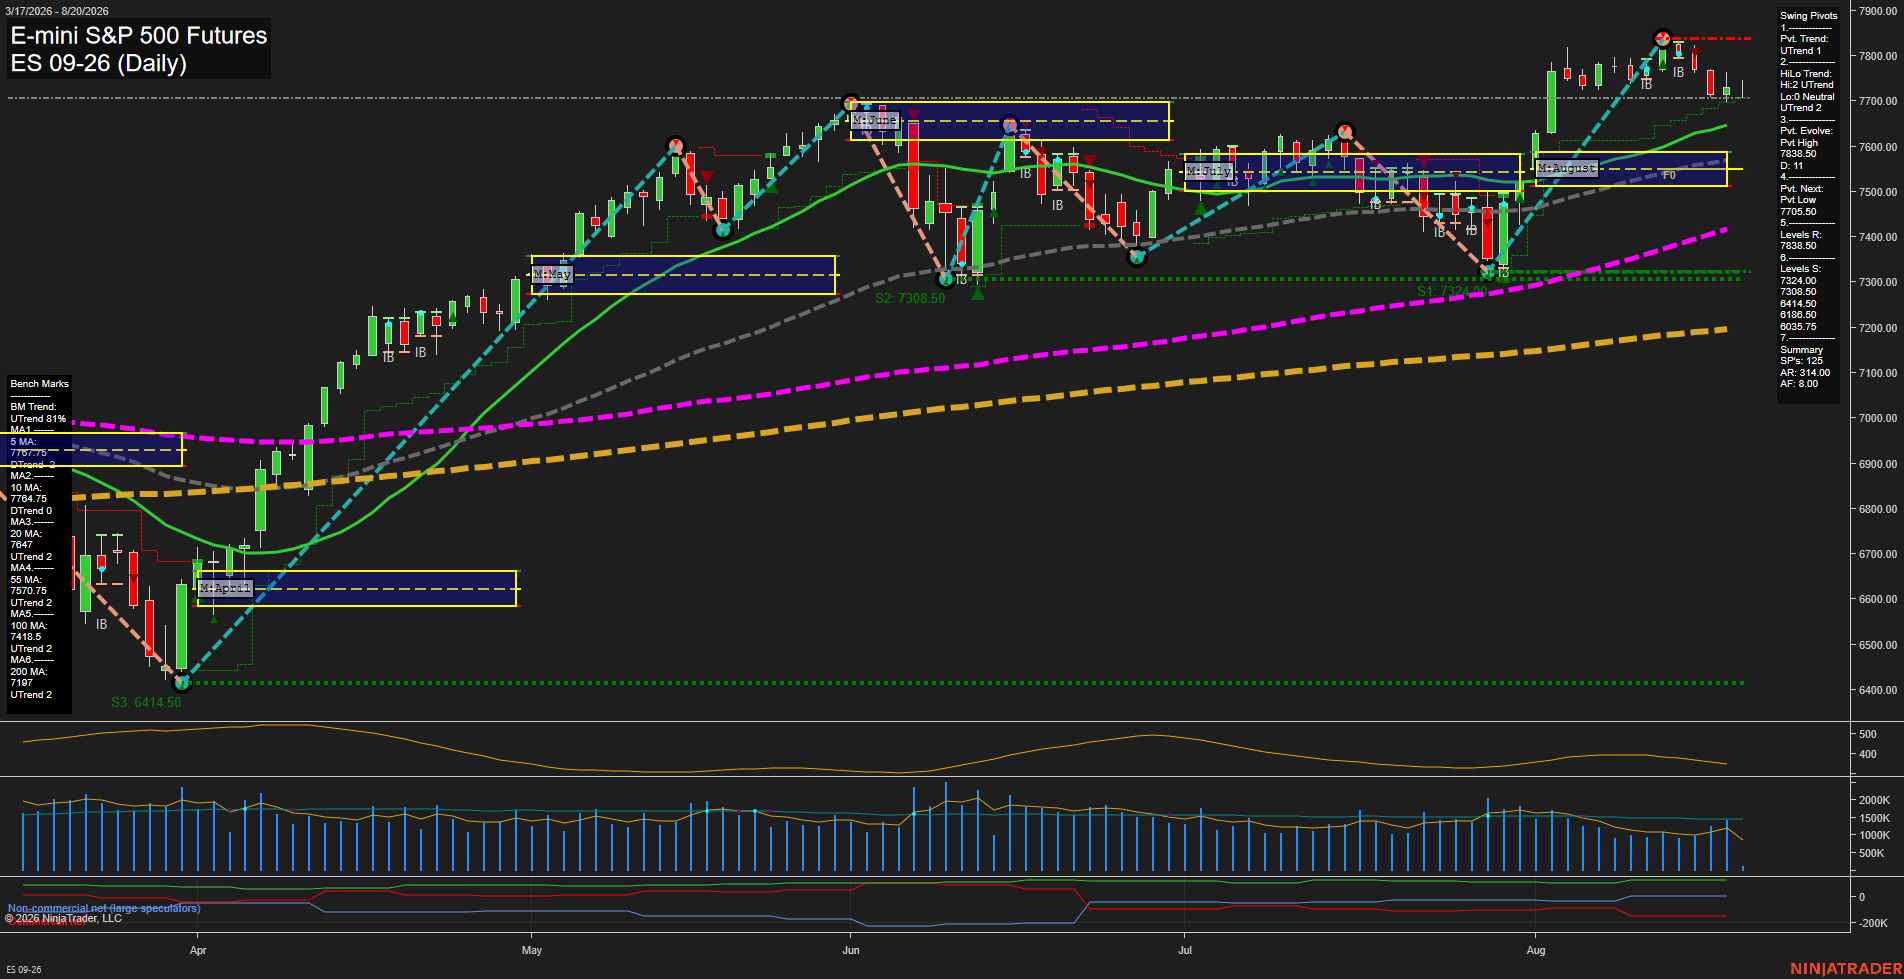
Overall Rating
- Short-Term: Neutral
- Intermediate-Term: Bullish
- Long-Term: Bullish.
Key Insights Summary
Price remains in a broader higher-high and higher-low structure, supported by bullish intermediate and long-term pivot trends and price holding above the rising 20-, 55-, 100-, and 200-day benchmarks. Short-term action is consolidative after rejection from the 7836.50 pivot high, with price below the weekly F0% area and both short moving averages. The 7705.50 next-pivot level is the immediate short-term structure point, while 7836.50 remains the defined overhead swing resistance. Medium-sized daily bars and average momentum reflect a pullback/consolidation phase within the larger bullish trend rather than a broad trend reversal.
View charts on: AlphaWebTrader HTF Charts
NQ Daily View
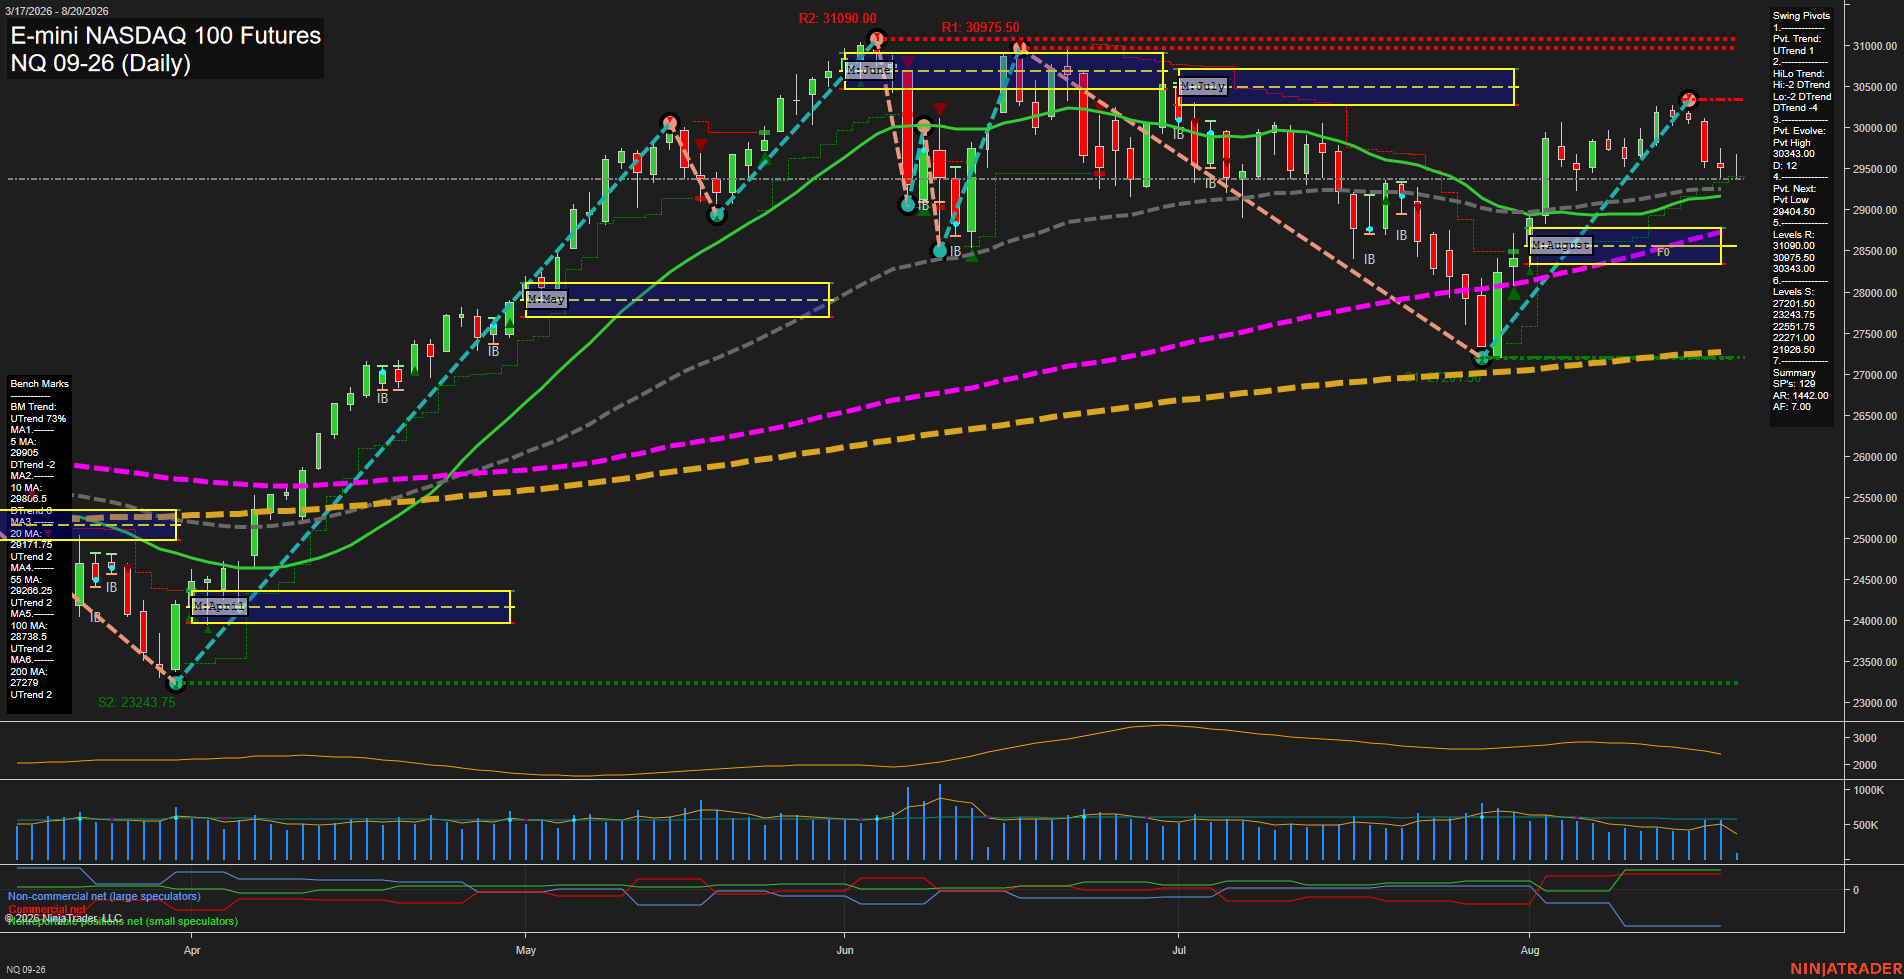
Overall Rating
- Short-Term: Bearish
- Intermediate-Term: Bullish
- Long-Term: Bullish.
Key Insights Summary
The daily structure reflects a fast short-term selloff from the 30312 pivot high into the 29404.50 pivot-low reversal level. Price is below the weekly F0%/NTZ area and beneath both short-term averages, confirming near-term downside momentum, while the 20-, 55-, 100-, and 200-day benchmarks retain upward trends. This creates a counter-trend pullback within a broader bullish long-term structure; 30343.00 is the nearest pivot resistance, while the August monthly grid and intermediate moving averages cluster near the current price zone.
View charts on: AlphaWebTrader HTF Charts
CL Daily View
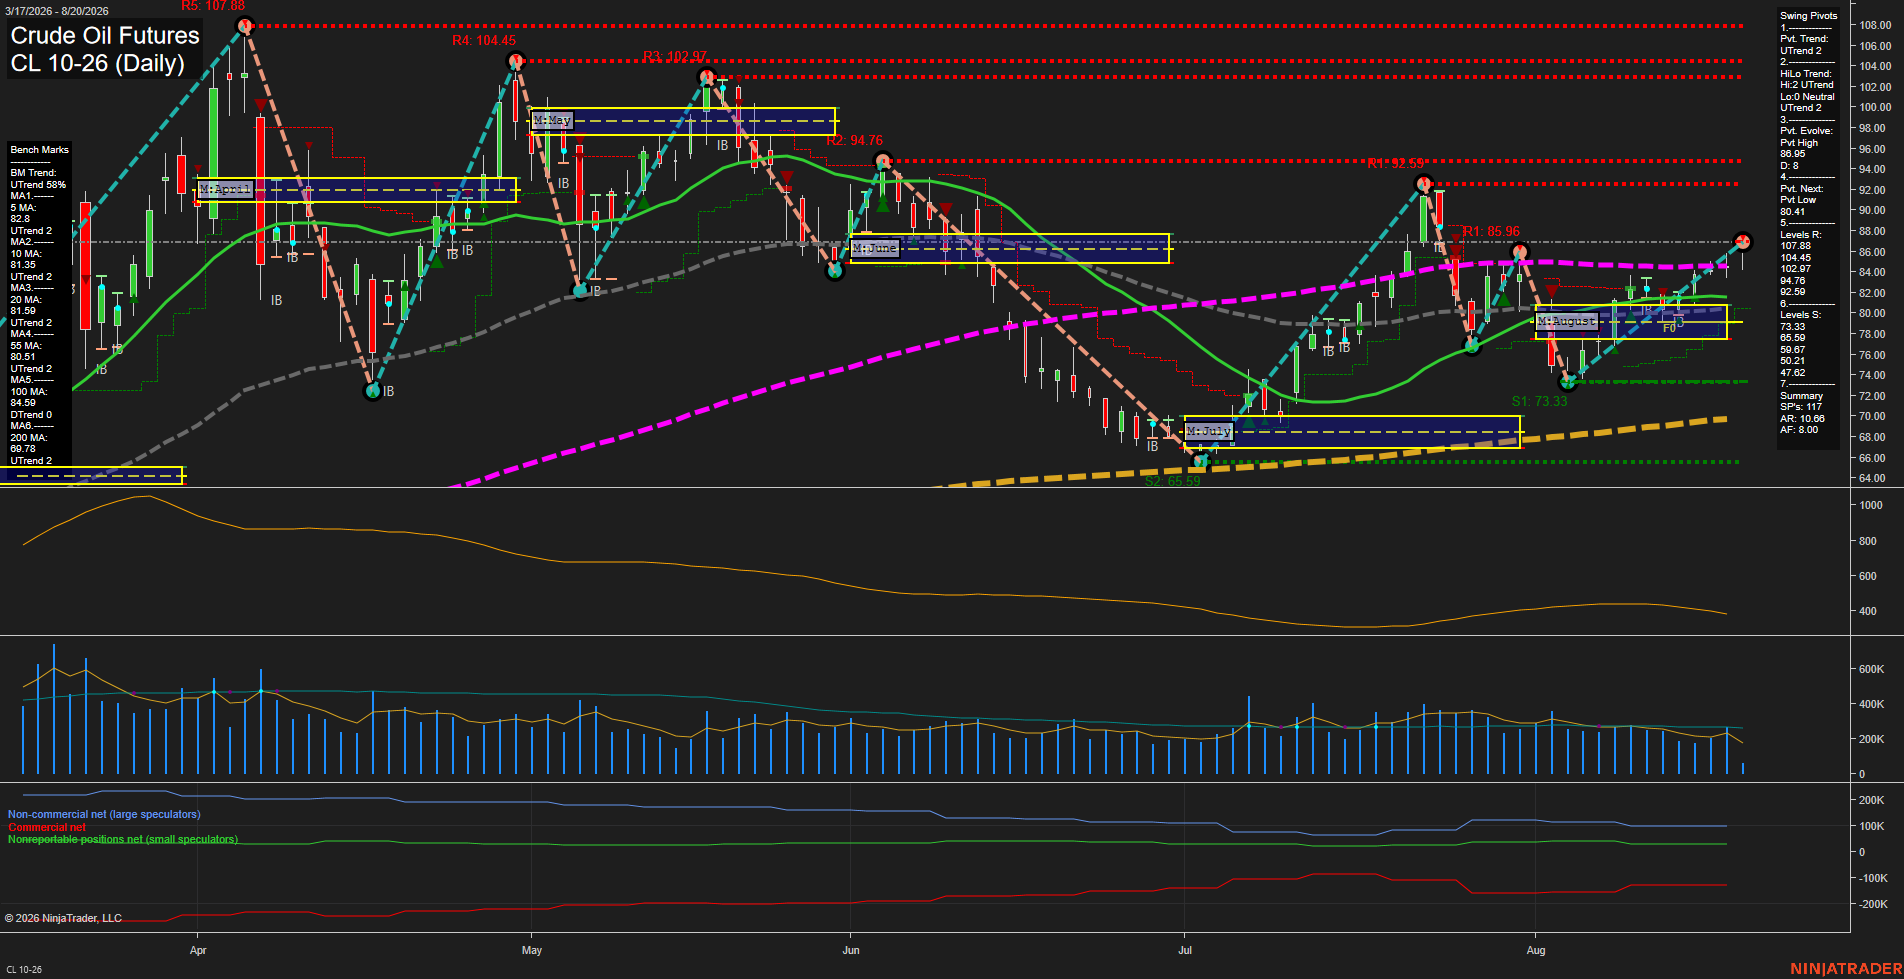
Overall Rating
- Short-Term: Bullish
- Intermediate-Term: Bullish
- Long-Term: Bullish.
Key Insights Summary
CL has recovered sharply from the early-August 73.33 swing low and is holding above every daily benchmark, with aligned UTrend readings in both pivot measures. Price has pushed through the 85.96 pivot resistance area and is consolidating near 87.77 after the advance, while the next meaningful overhead pivot zones are 92.59 and 94.76. The 80.41 pivot-next level and the clustered 20-, 55-, and 10-day averages near 80.51-81.59 define the major retracement structure. ATR remains elevated relative to the recent small bars, indicating that the current pause follows a high-volatility recovery rather than a low-range compression.
View charts on: AlphaWebTrader HTF Charts
GC Daily View
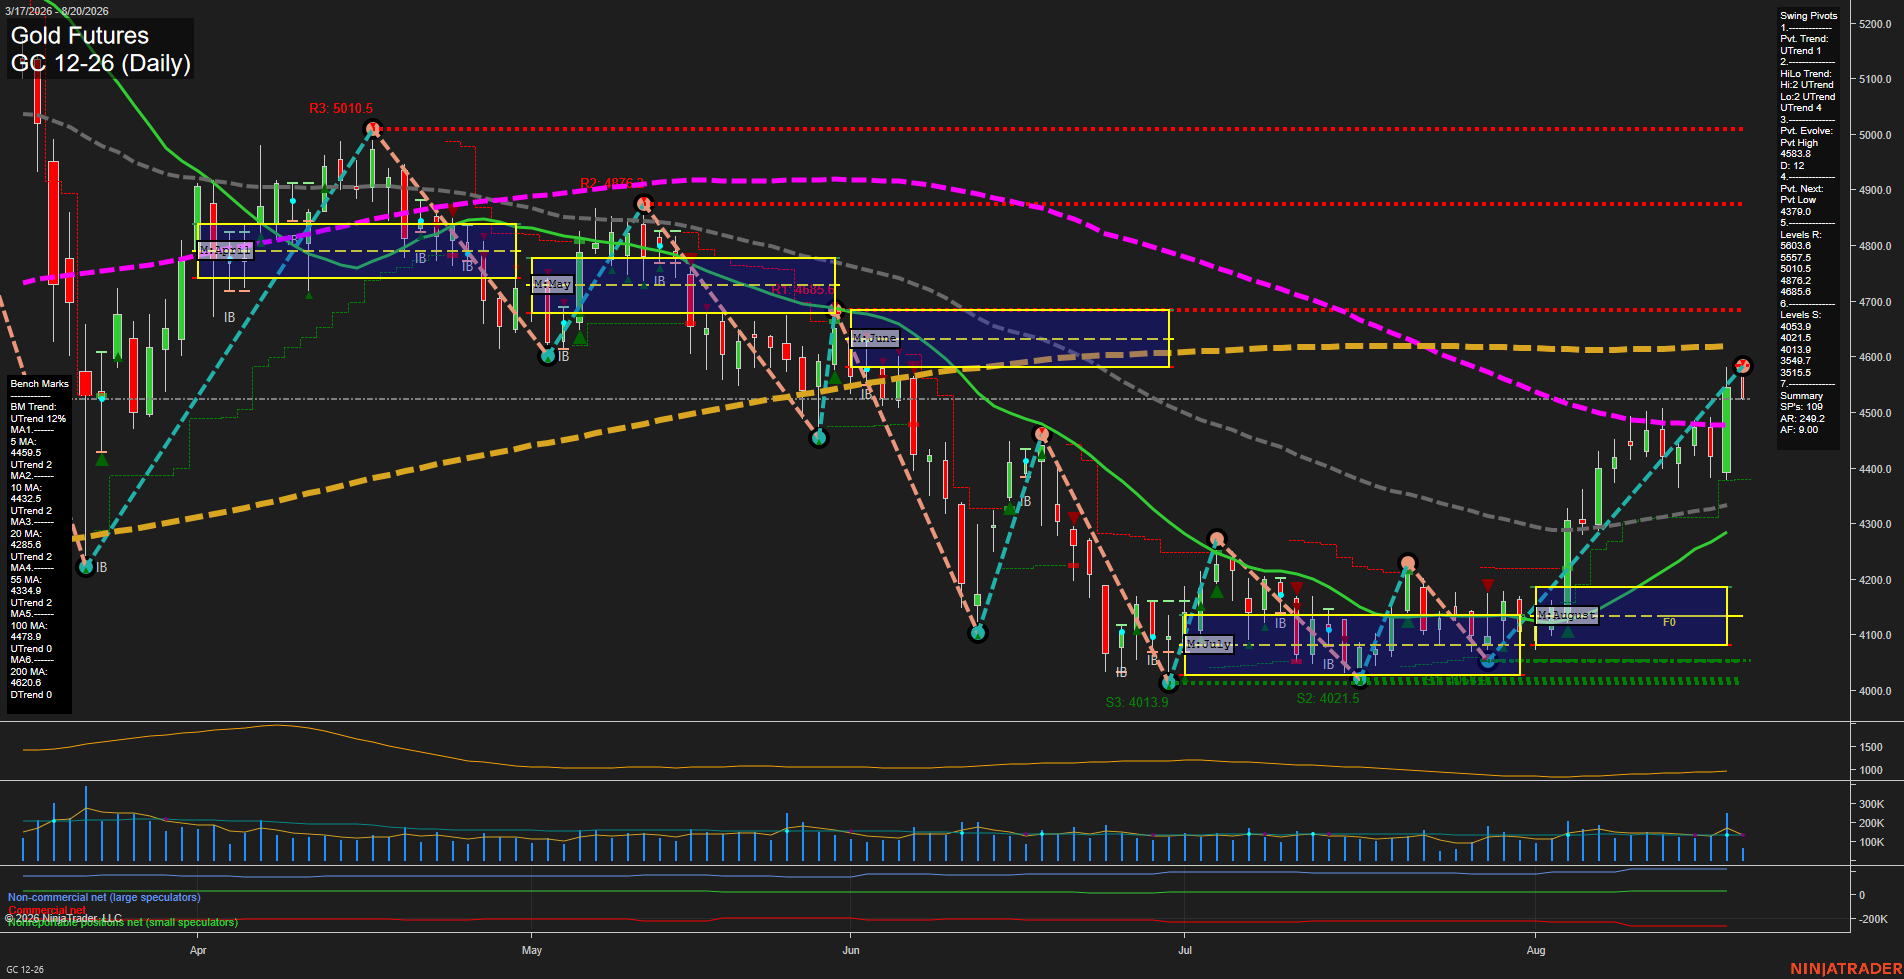
Overall Rating
- Short-Term: Neutral
- Intermediate-Term: Bullish
- Long-Term: Bearish.
Key Insights Summary
Price action has shifted into a high-volatility reversal following the August rally into the 4583.8 pivot high. The short-term pivot structure remains upward, but the latest large-range decline pushed price below the 5-day, 10-day, and 100-day benchmarks, reflecting fast downside momentum and a short-term countertrend retracement. The weekly and monthly fib grids remain positive above their F0% zones, while the 20-day and 55-day averages retain rising trends, preserving the intermediate higher-low recovery structure. The 200-day average remains declining and overhead near 4620.6, maintaining a weaker long-term backdrop. Pivot resistance is concentrated from 4685.6 through 4872.6, while 4379.0 is the immediate pivot-reversal reference and the 4053.9 to 4013.9 area marks deeper structural support.
View charts on: AlphaWebTrader HTF Charts