NYSE pre-market radar tracks ETF movers and index futures as Treasury buybacks ease yields, AI earnings support stocks, and Iran-Hormuz risks lift oil focus.
Fundamentals: U.S. index futures posted modest gains as Treasury buybacks of longer-term bonds supported lower yields and strong AI-linked earnings underpinned equities. Investors also monitored Fed policy signals, elevated stock valuations, crude inventory data, and shipping risks through the Strait of Hormuz amid escalating tensions involving Iran.
Technicals: Pre-market analysis shows mixed conditions across major index futures: intermediate and long-term trends remain broadly bullish, while several daily charts reflect short-term pullbacks from recent highs. ES is consolidating below resistance, while NQ, YM, EMD and FDAX show bearish near-term momentum. IBIT, Tesla and GLD led prior-session ETF gains, while NVDA declined.
Pre-Market Trading 360° view Market Radar of: holidays, earnings, eco-news, market-news summary, news sentiment, prior session major ETFs, MAG7, Higher Time Frame Analysis Indices Futures Summary, and E-mini S&P500, Nasdaq 100, NYMEX Crude, Gold Futures Daily Chart analysis.
As of: August 20, 2026 07:16 CT
EcoNews Radar U.S. Events
| Day | Time | Impact | Event |
|---|---|---|---|
| Thu | 08:30 | Medium | Philly Fed Manufacturing Index |
| Thu | 08:30 | Medium | Unemployment Claims |
EcoNews Summary
No qualifying high-impact EcoNews events are listed. The listed medium-impact USD events do not relate to oil, crude inventories, energy prices, or petroleum supply and are excluded.
Event Notes:
- No qualifying events listed.
Conclusion:
No single qualifying high-impact event is listed for the week.
For full details visit: Forex Factory EcoNews
Market News Summary:
Index futures showed modest early gains as Treasury support for longer-term bonds, strong AI-linked earnings, and geopolitical tensions shaped the session.
Primary Drivers & Risks:
- Primary Driver: Treasury buyback lowers long yields
- Primary Risk: Iran conflict and Hormuz disruption
Tone:
Cautiously constructive, with rate and geopolitical cross-currents.
Stock Market / ETFs / Indices:
U.S. futures posted modest gains early Thursday following a higher Wednesday close. S&P 500 earnings remained strong, led by AI-related companies, while continued AI investment supported broader risk appetite. Valuation concerns persisted, with the forward S&P 500 P/E above its longer-term average; energy remained the leading sector, up 41.5% year to date.
Geopolitical:
Investors assessed an intensifying U.S. economic offensive against Iran and the U.S.-Iran war outlook. Security of shipping through the Strait of Hormuz remained a central market concern.
Oil / Energy:
Oil held near key technical levels as Middle East and Hormuz tensions supported supply-risk pricing. Rising U.S. crude inventories, softer demand, and higher inventories limited the upside. Global LNG conditions were described as tightening.
Gold / Metals:
Gold faced conflicting signals: Fed minutes indicating broader support for rate increases weighed on prices, while falling Treasury yields supported gold and silver. Geopolitical tensions, inflation, and election uncertainty remained cited supports for gold demand.
Fed / Financials:
Treasury announced additional buybacks of longer-term bonds, helping support longer-duration debt and reduce yields. Rising yields remained a valuation issue for equities, while Fed messaging and July meeting minutes kept rate policy in focus. Bally’s disclosed substantial doubt about continuing as a going concern amid debt pressure and financing needs.
Macro / Other:
Japan export growth accelerated for a fifth consecutive month to 23.2%, above estimates, led by robust chip shipments. Bitcoin and ether rose amid political support for crypto legislation and proposed government Bitcoin purchases.
Conclusion:
Treasury long-bond buybacks and lower yields supported futures and rate-sensitive valuations. Strong AI-related earnings remained a key equity-market underpinning.
Iran-related tensions and Strait of Hormuz shipping risks supported oil while increasing geopolitical uncertainty. Higher crude inventories, Fed rate uncertainty, elevated equity valuations, and isolated corporate debt stress remained cross-currents.
Market News Sentiment
Market News Articles: 37
- Neutral: 51.35%
- Positive: 37.84%
- Negative: 10.81%
Sentiment Summary: Of 37 market news articles, 51% were neutral, 38% positive, and 11% negative, indicating predominantly neutral coverage with a positive skew.
Conclusion: Indices futures day traders are facing broadly neutral news sentiment, with positive articles outnumbering negative articles.
GLD,Gold Articles: 16
- Positive: 68.75%
- Neutral: 18.75%
- Negative: 12.50%
Sentiment Summary: GLD and gold coverage is predominantly positive at 69%, with 19% neutral and 13% negative sentiment across 16 articles.
Conclusion: The gold news tone is positive overall, indicating stronger favorable coverage than neutral or negative coverage.
USO,Oil Articles: 7
- Negative: 57.14%
- Neutral: 28.57%
- Positive: 14.29%
Sentiment Summary: USO/Oil coverage is predominantly negative at 57%, with 29% neutral and 14% positive articles.
Conclusion: Oil-related news tone is negative overall, which may be relevant to energy-sensitive index futures sentiment.
Market Data Snapshot
ETF Snapshot of major stock market ETFs, Mag7, and others as of: August 20, 2026 07:16
Top Movers & Losers
- IBIT 38.78 Bullish 5.96% ▲
- TSLA 351.12 Bullish 4.23% ▲
- GLD 413.84 Bullish 3.84% ▲
- QQQ 716.08 Bearish -0.20% ▼
- IJH 77.04 Bearish -0.26% ▼
- NVDA 217.56 Bearish -0.99% ▼
Major Index ETFs: SPY, QQQ, DIA, IWM, IJH
- IWM 301.72 Bullish 0.50% ▲
- DIA 534.27 Bullish 0.26% ▲
- SPY 769.06 Bullish 0.21% ▲
- QQQ 716.08 Bearish -0.20% ▼
- IJH 77.04 Bearish -0.26% ▼
Mixed index ETF snapshot: IWM is the most bullish mover at +0.50%, followed by DIA at +0.26% and SPY at +0.21%. QQQ is bearish at -0.20%, while IJH is the most bearish mover at -0.26%.
Mag 7 Stocks: AAPL, MSFT, GOOG, AMZN, META, NVDA, TSLA
- TSLA 351.12 Bullish 4.23% ▲
- AMZN 265.84 Bullish 2.46% ▲
- AAPL 316.83 Bullish 2.19% ▲
- MSFT 484.31 Bullish 0.56% ▲
- META 546.03 Bullish 0.43% ▲
- GOOG 341.70 Bullish 0.12% ▲
- NVDA 217.56 Bearish -0.99% ▼
Mixed: TSLA is the most bullish mover at +4.23%, followed by AMZN at +2.46% and AAPL at +2.19%. MSFT and META show modest Bullish moves of +0.56% and +0.43%, while GOOG is marginally Bullish at +0.12%. NVDA is the most bearish mover at -0.99%.
Cross-Market ETFs: TLT, GLD, USO, IBIT
- IBIT 38.78 Bullish 5.96% ▲
- GLD 413.84 Bullish 3.84% ▲
- TLT 83.02 Bullish 1.67% ▲
- USO 130.91 Bullish 0.19% ▲
Other ETFs are Bullish across the group: IBIT is the most bullish mover at +5.96%, followed by GLD at +3.84% and TLT at +1.67%. USO is the least positive mover at +0.19%, a modest gain.
ETF, Mag7, and Cross-Market ETF Insights
Overall Tone
Mixed, with selective Bullish leadership in bitcoin, gold, Tesla, and consumer technology while Nasdaq-linked equities and semiconductors were Bearish.
Equity ETFs and Mag7:
Major Index ETFs were Mixed: IWM led at +0.50%, while QQQ was Bearish at -0.20% and IJH was Bearish at -0.26%; SPY at +0.21% and DIA at +0.26% showed marginal Bullish movement. Mag7 performance was selective, led by TSLA at +4.23%, followed by AMZN at +2.46% and AAPL at +2.19%. NVDA was the most bearish equity mover at -0.99%, contrasting with near-flat Bullish GOOG at +0.12% and positive MSFT and META.
Cross-Market ETFs:
Cross-market ETFs were broadly Bullish, led by IBIT as the most bullish mover at +5.96% and GLD at +3.84%. TLT rose +1.67%, while USO was the least positive cross-market mover at a marginal +0.19%. The simultaneous strength in IBIT, GLD, and TLT showed divergence from the Mixed equity ETF backdrop.
Futures Indices – Higher Time Frame Analysis
Summary of the current state of US Indices Futures based on higher time-frame (HTF) technical analysis as of: 2026-08-20: 07:16 CT.
US Indices Futures
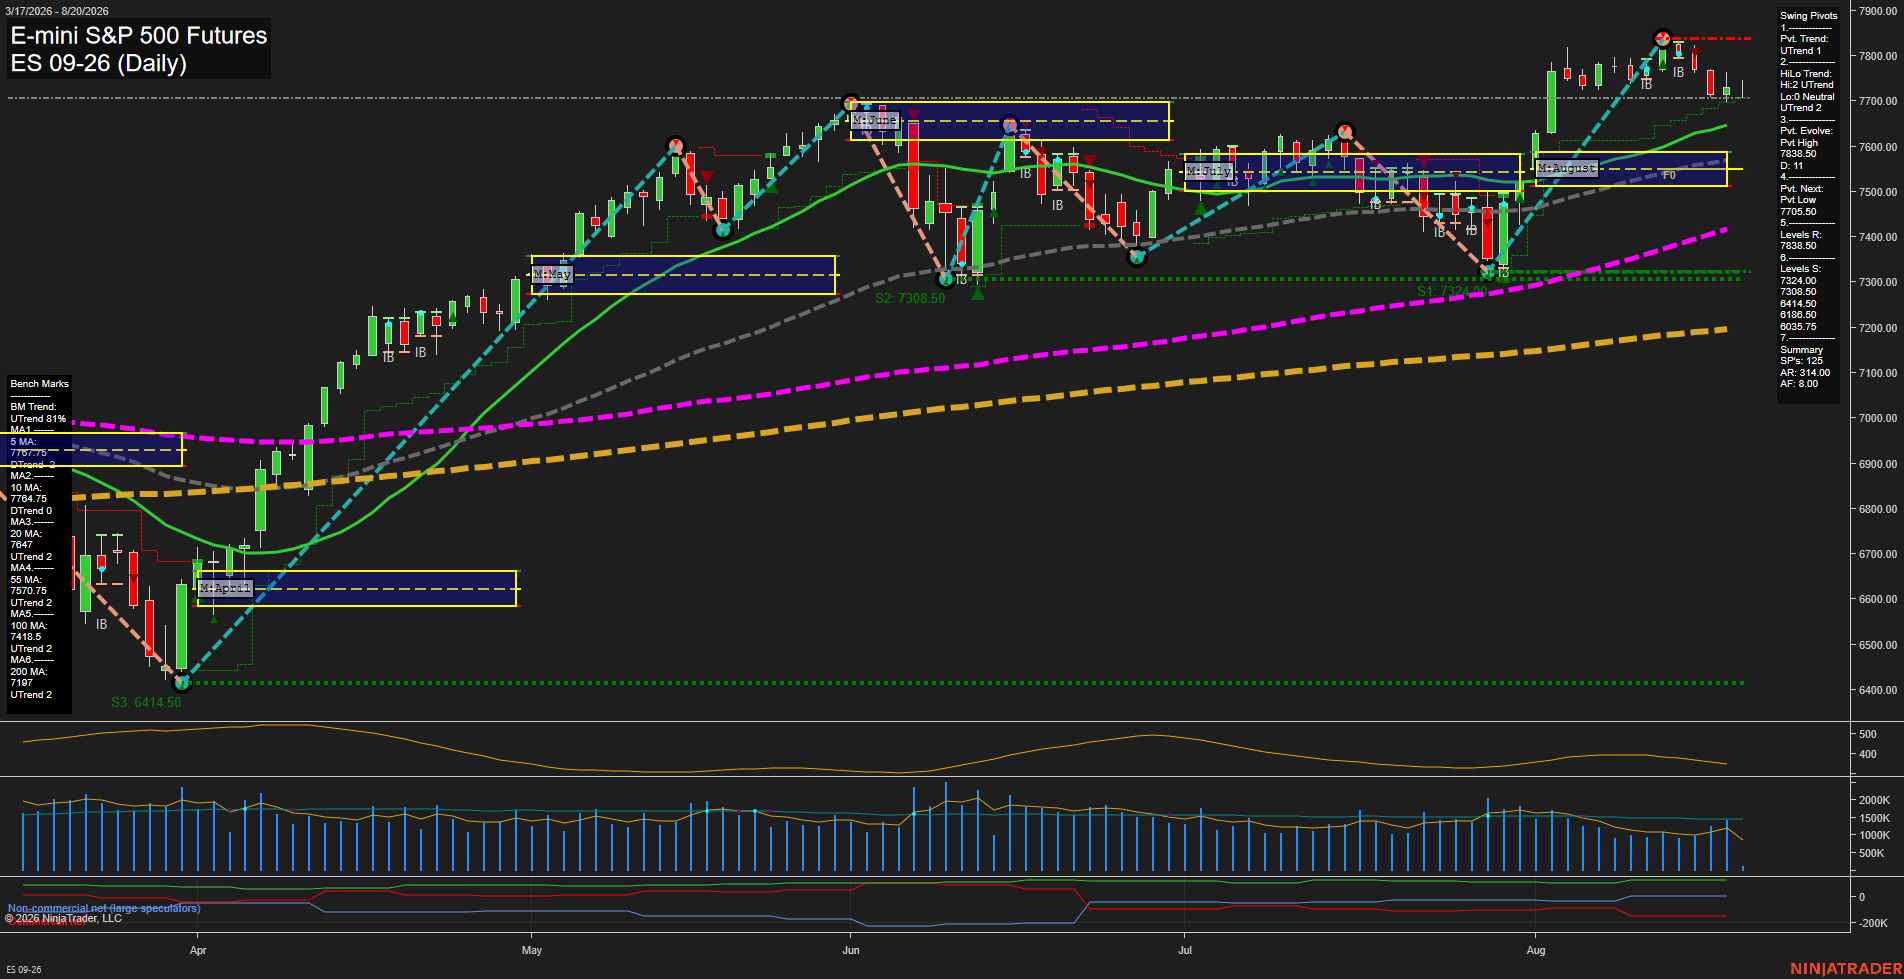
- ES Bullish; YSFG/MSFG above F0%, WSFG below F0%; 7838.50 resistance, 7705.50 pivot support; benchmarks rising.
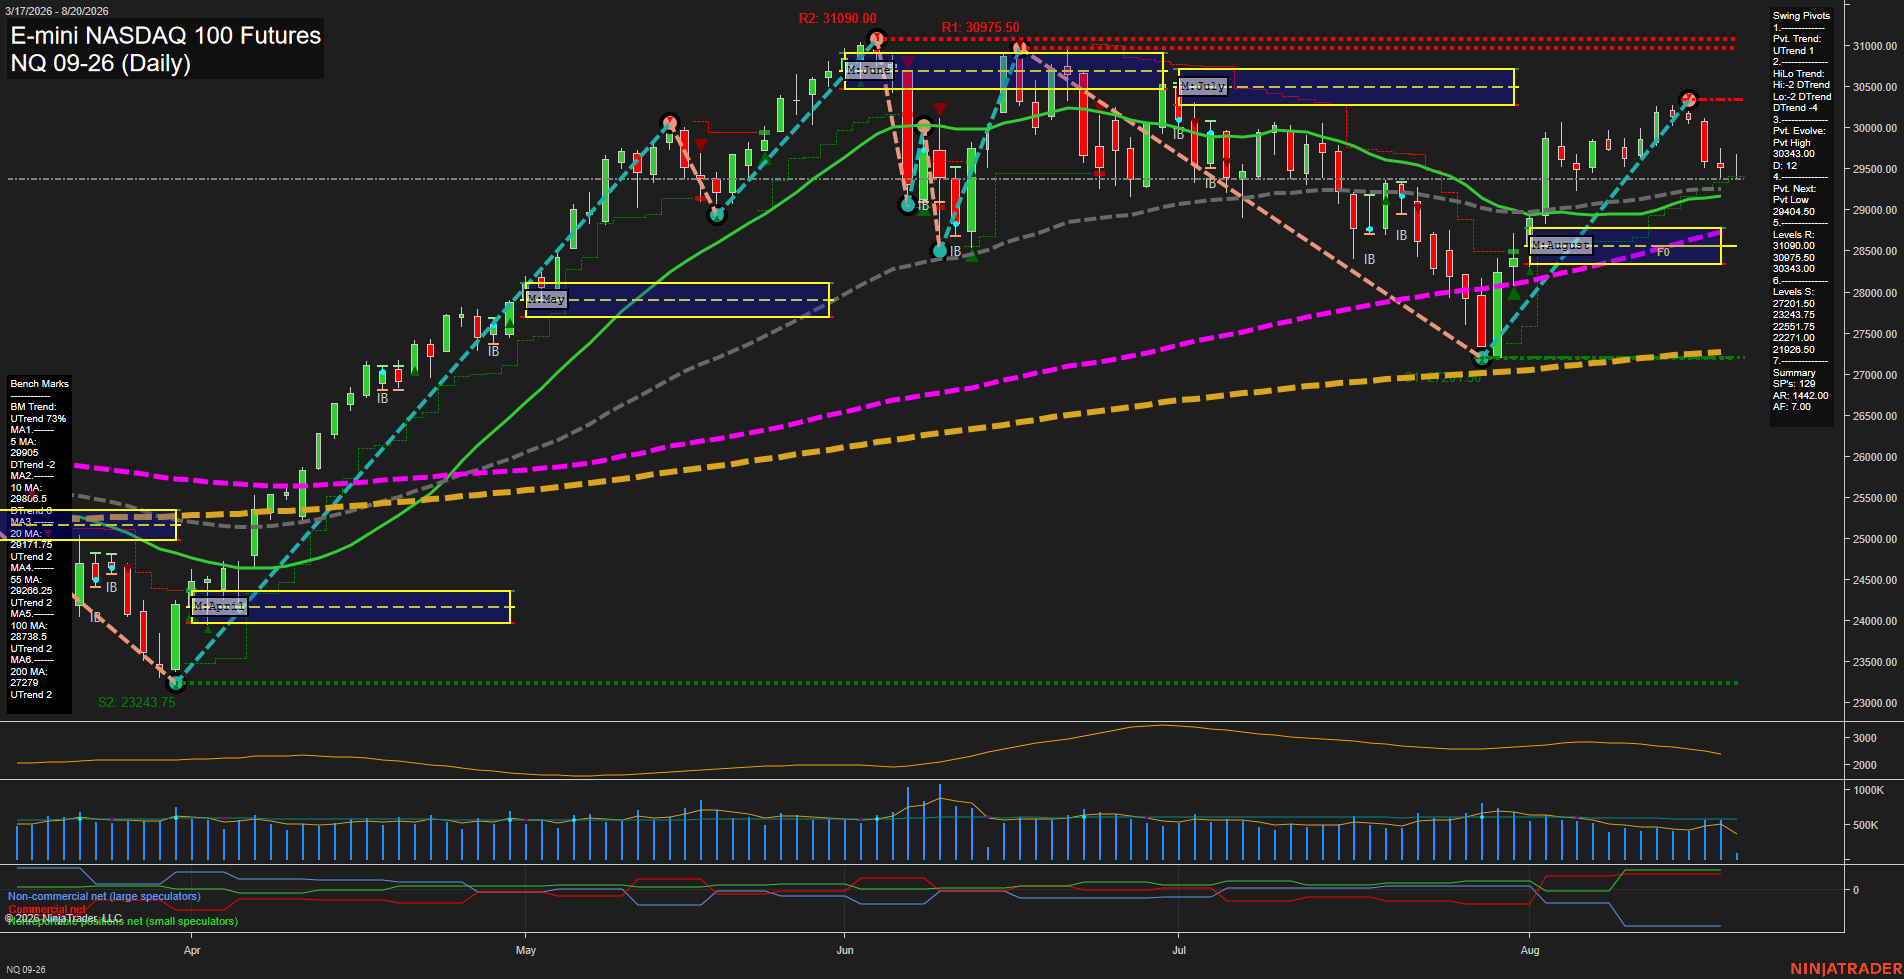
- NQ Neutral; YSFG/MSFG above F0%, WSFG below F0%; 30343-31090 resistance, 29404.50/27565 support; benchmarks rising.
- YM Neutral; YSFG/MSFG above F0%, WSFG below F0%; 54884 resistance, 53264/52438 support; higher benchmarks rising.
- EMD Neutral; YSFG/MSFG above F0%, WSFG below NTZ; 3941.7 resistance, 3847.8/3804.7 support; benchmarks rising.
- RTY Neutral; YSFG/MSFG above F0%, WSFG below F0%; 3071.1-3079.9 resistance, 3008.9/2878.5 support; benchmarks rising.
- FDAX Bearish; YSFG/MSFG upward, WSFG below F0%; 26685-26865 resistance, 25979/25107 support; longer benchmarks rising.
Overall State
- Short-Term: Neutral
- Intermediate-Term: Bullish
- Long-Term: Bullish
Conclusion
Intermediate and long-term directional correlation remains bullish across all contracts, supported by rising benchmark averages, upward pivot structures, and YSFG/MSFG positioning. WSFG readings remain below F0% or NTZ across the group, aligning with current short-term pullbacks beneath recent swing-high resistance. ES retains the strongest short-term structure; NQ, YM, EMD, and FDAX show bearish daily retracements, while RTY is consolidative near its August pivot high.
Note: Intra-day counter-trend pullbacks or retracements may occur, HTF is context for informational usage and market structure. Glossary: Session Fib Grids periods of YSFG:’Yearly’, MSFG:’Monthly’, WSFG:’Weekly’
For full details visit: AlphaWebTrader Technicals
ES Daily View
Overall Rating
- Short-Term: Neutral
- Intermediate-Term: Bullish
- Long-Term: Bullish.
Key Insights Summary
Price remains in a broader higher-high and higher-low structure, supported by bullish intermediate and long-term pivot trends and price holding above the rising 20-, 55-, 100-, and 200-day benchmarks. Short-term action is consolidative after rejection from the 7836.50 pivot high, with price below the weekly F0% area and both short moving averages. The 7705.50 next-pivot level is the immediate short-term structure point, while 7836.50 remains the defined overhead swing resistance. Medium-sized daily bars and average momentum reflect a pullback/consolidation phase within the larger bullish trend rather than a broad trend reversal.
View charts on: AlphaWebTrader HTF Charts
NQ Daily View
Overall Rating
- Short-Term: Bearish
- Intermediate-Term: Bullish
- Long-Term: Bullish.
Key Insights Summary
The daily structure reflects a fast short-term selloff from the 30312 pivot high into the 29404.50 pivot-low reversal level. Price is below the weekly F0%/NTZ area and beneath both short-term averages, confirming near-term downside momentum, while the 20-, 55-, 100-, and 200-day benchmarks retain upward trends. This creates a counter-trend pullback within a broader bullish long-term structure; 30343.00 is the nearest pivot resistance, while the August monthly grid and intermediate moving averages cluster near the current price zone.
View charts on: AlphaWebTrader HTF Charts
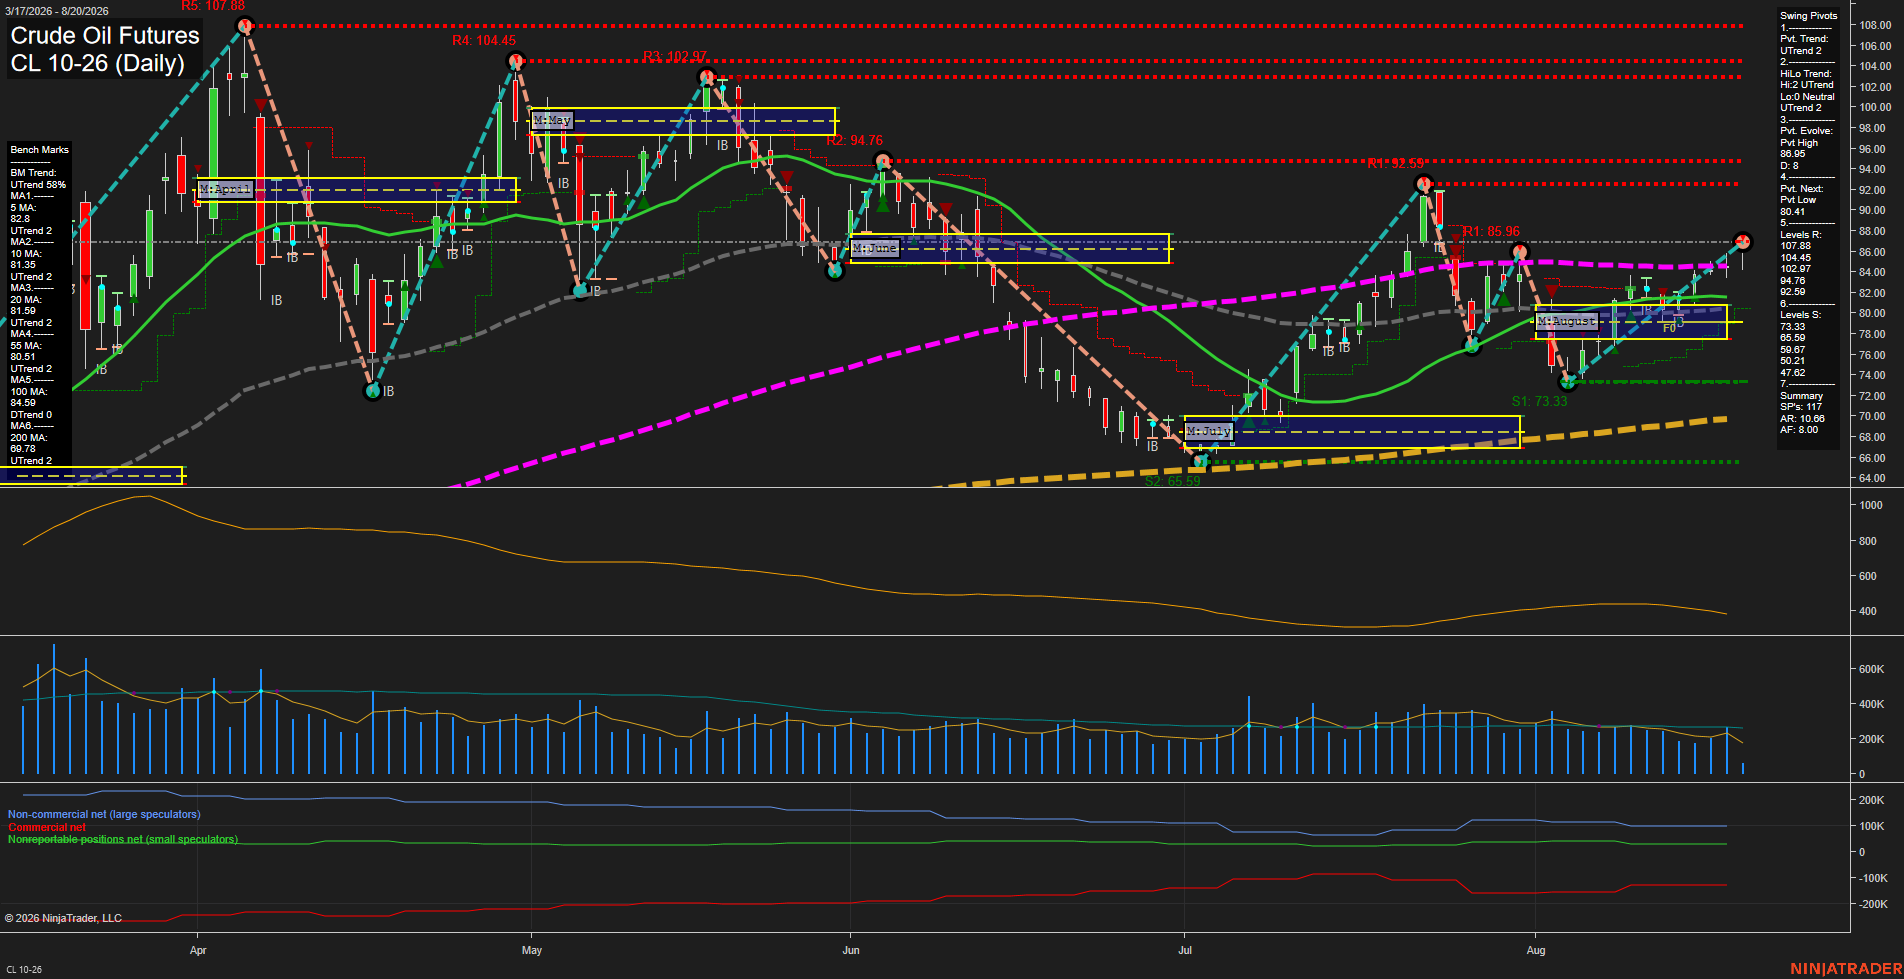
CL Daily View
Overall Rating
- Short-Term: Bullish
- Intermediate-Term: Bullish
- Long-Term: Bullish.
Key Insights Summary
CL has recovered sharply from the early-August 73.33 swing low and is holding above every daily benchmark, with aligned UTrend readings in both pivot measures. Price has pushed through the 85.96 pivot resistance area and is consolidating near 87.77 after the advance, while the next meaningful overhead pivot zones are 92.59 and 94.76. The 80.41 pivot-next level and the clustered 20-, 55-, and 10-day averages near 80.51-81.59 define the major retracement structure. ATR remains elevated relative to the recent small bars, indicating that the current pause follows a high-volatility recovery rather than a low-range compression.
View charts on: AlphaWebTrader HTF Charts
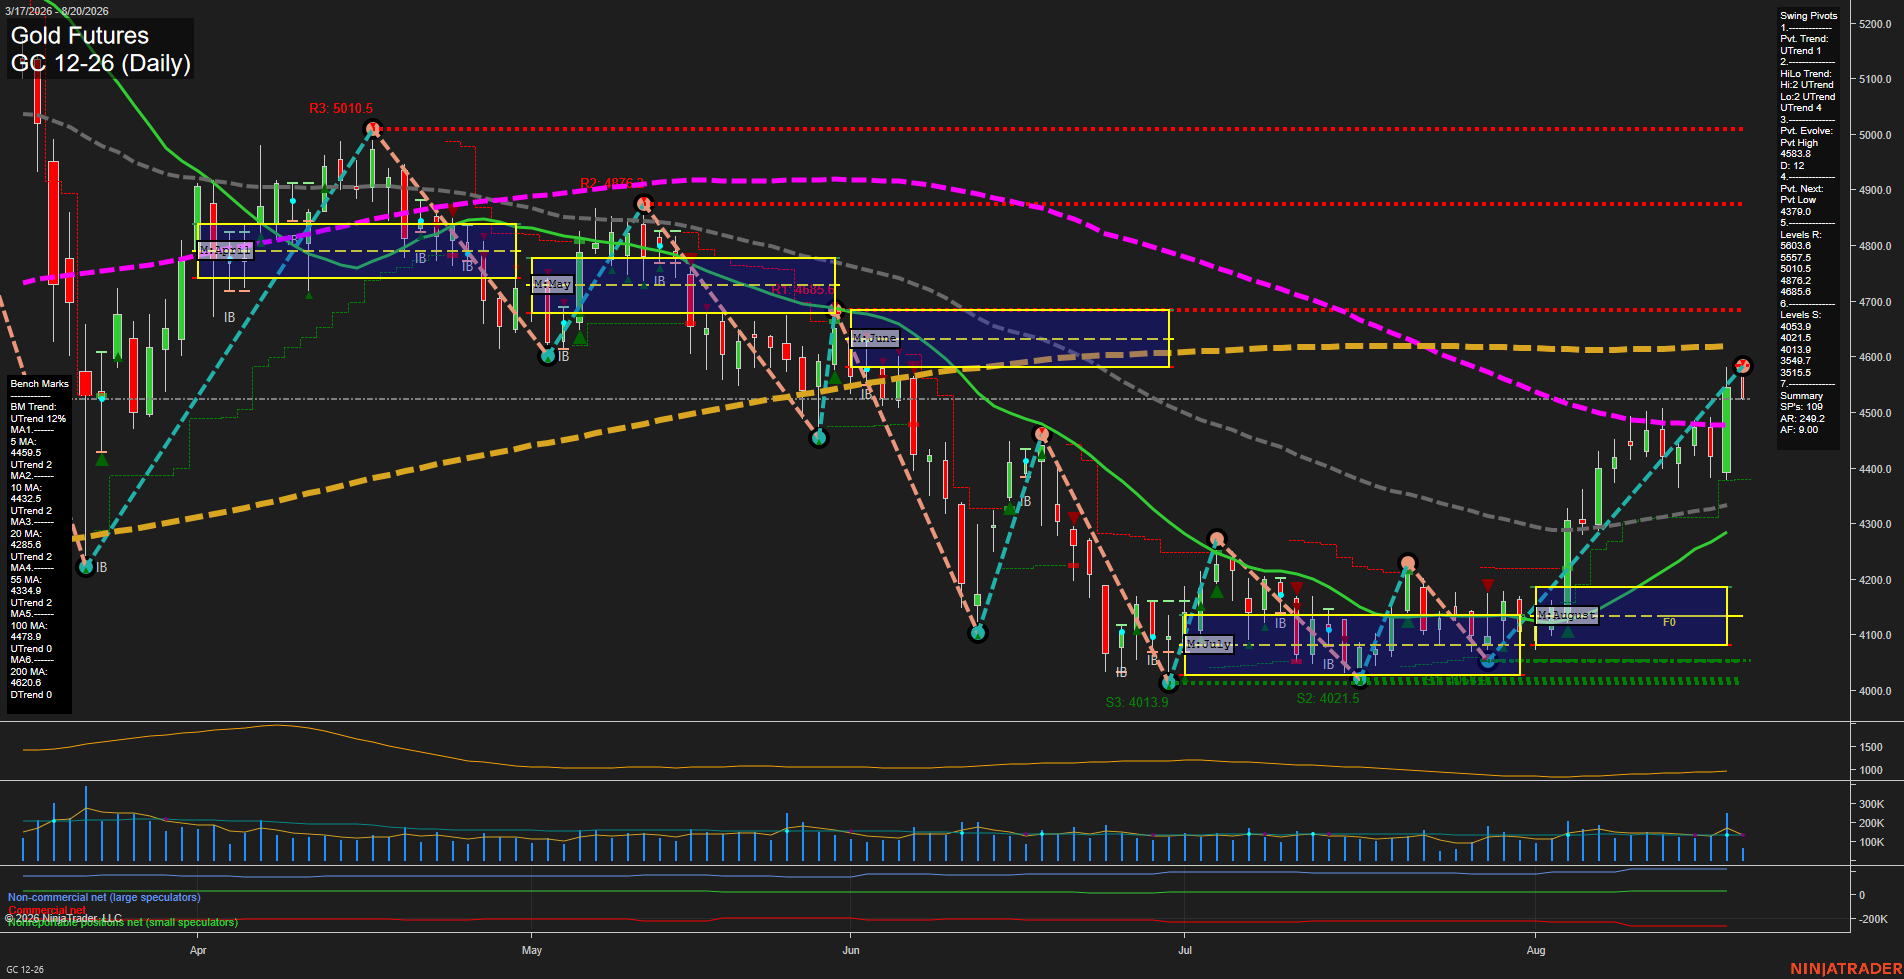
GC Daily View
Overall Rating
- Short-Term: Neutral
- Intermediate-Term: Bullish
- Long-Term: Bearish.
Key Insights Summary
Price action has shifted into a high-volatility reversal following the August rally into the 4583.8 pivot high. The short-term pivot structure remains upward, but the latest large-range decline pushed price below the 5-day, 10-day, and 100-day benchmarks, reflecting fast downside momentum and a short-term countertrend retracement. The weekly and monthly fib grids remain positive above their F0% zones, while the 20-day and 55-day averages retain rising trends, preserving the intermediate higher-low recovery structure. The 200-day average remains declining and overhead near 4620.6, maintaining a weaker long-term backdrop. Pivot resistance is concentrated from 4685.6 through 4872.6, while 4379.0 is the immediate pivot-reversal reference and the 4053.9 to 4013.9 area marks deeper structural support.
View charts on: AlphaWebTrader HTF Charts