NYSE pre-market radar tracks ETF movers, futures technicals and market drivers as Nvidia earnings, Iran sanctions and Hormuz risks weigh on sentiment.
Fundamentals: U.S. index futures are lower as markets focus on Nvidia earnings, Jackson Hole policy signals and a new U.S. sanctions package targeting Iran. Restricted shipping activity through the Strait of Hormuz remains a key energy-market concern, while softer oil prices and lower bond yields partly offset pressure from fiscal-debt worries, elevated real yields and technology-sector sensitivity.
Technicals: Pre-market analysis shows IBIT, Tesla and GLD led prior-session gains, while Amazon, Apple and Nvidia declined. Equity index futures retain broadly constructive intermediate- and long-term structures, though ES, NQ, YM, EMD, RTY and FDAX daily charts reflect short-term pullbacks or consolidation near key pivot support and resistance levels.
Pre-Market Trading 360° view Market Radar of: holidays, earnings, eco-news, market-news summary, news sentiment, prior session major ETFs, MAG7, Higher Time Frame Analysis Indices Futures Summary, and E-mini S&P500, Nasdaq 100, NYMEX Crude, Gold Futures Daily Chart analysis.
As of: August 24, 2026 07:16 CT
Earnings Radar
Monitoring for earnings releases by the Magnificent 7, AI-tech-related firms, and major financial institutions.
- CRM Release: 2026-08-26 T:AMC
- NVDA Release: 2026-08-26 T:AMC
Conclusion: CRM and NVDA report after the close on 2026-08-26, concentrating broad index-relevant software, AI, and semiconductor earnings risk in one after-hours window. Market momentum and volume can slow ahead of these major tech releases, with heightened index-futures sensitivity to post-release guidance and reaction.
For full details visit: Yahoo Earnings Calendar
EcoNews Radar U.S. Events
| Day | Time | Impact | Event |
|---|---|---|---|
| Mon | 14:00 | Medium | Treasury Sec Bessent Speaks |
| Tue | 10:00 | Medium | CB Consumer Confidence |
| Wed | 08:30 | High | Core PCE Price Index m/m |
| Wed | 08:30 | High | Prelim GDP q/q |
| Wed | 08:30 | Medium | Prelim GDP Price Index q/q |
| Wed | 10:30 | Low | Crude Oil Inventories |
| Thu | 08:30 | Medium | Unemployment Claims |
| Thu | 12:15 | Medium | Jackson Hole Symposium |
| Fri | 10:00 | High | Fed Chairman Warsh Speaks |
| Fri | 10:00 | High | Prelim Benchmark Payrolls Revision |
| Fri | 10:00 | Medium | Revised UoM Consumer Sentiment |
| Fri | 10:00 | Medium | Revised UoM Inflation Expectations |
| Fri | 12:15 | High | Jackson Hole Symposium |
| Sat | 12:15 | Medium | Jackson Hole Symposium |
EcoNews Summary
Wednesday’s 08:30 releases concentrate the week’s main macroeconomic risk, with Core PCE inflation and preliminary GDP arriving simultaneously. Friday features a 10:00 cluster led by remarks from Fed Chairman Warsh and the preliminary benchmark payrolls revision, followed by the high-impact Jackson Hole Symposium session.
Event Notes:
- Wednesday 08:30 – Core PCE Price Index m/m: Measures the monthly change in core personal-consumption-expenditures prices, excluding food and energy. Traders monitor it as a key inflation gauge tied to monetary-policy conditions.
- Wednesday 08:30 – Prelim GDP q/q: Measures the preliminary quarterly annualized change in U.S. economic output. Traders monitor it for evidence of changes in economic growth momentum.
- Friday 10:00 – Fed Chairman Warsh Speaks: Public remarks from the Fed Chairman. Traders monitor policy-related language, inflation discussion, and assessments of economic conditions.
- Friday 10:00 – Prelim Benchmark Payrolls Revision: Reports a preliminary annual benchmark adjustment to employment estimates using more complete source data. Traders monitor it for changes to the underlying employment picture.
- Friday 12:15 – Jackson Hole Symposium: High-impact session from the Jackson Hole Symposium, a forum involving central-bank and economic-policy discussion. Traders monitor policy communication and market-relevant economic themes.
Conclusion:
The single most important event is Wednesday’s 08:30 Core PCE Price Index release, arriving alongside preliminary GDP. Market momentum and volume often slow ahead of major events such as PCE and GDP, with increased volatility at release time. Friday’s 10:00 time cycle contains two high-impact events and acts as a catalyst for reversals or continuations.
For full details visit: Forex Factory EcoNews
Market News Summary:
U.S. index futures point lower as traders weigh Nvidia earnings, Jackson Hole policy signals, and Iran-related energy disruption.
Primary Drivers & Risks:
- Primary Driver: Nvidia earnings and Fed signals
- Primary Risk: Hormuz disruption and Iran sanctions
Tone:
Cautious, with lower futures and elevated cross-market uncertainty.
Stock Market / ETFs / Indices:
U.S. stock futures trend lower ahead of Nvidia results and a key Jackson Hole Fed speech. The S&P 500 and major ETFs have recently pulled back from highs amid U.S. debt concerns, while Japan’s Nikkei gained 0.3% after Wall Street strength despite trade-spat uncertainty. Nvidia’s market weight leaves broader technology and AI shares sensitive to its post-earnings reaction.
Geopolitical:
The U.S. is unveiling a major financial sanctions package against Iran, adding pressure on its oil, shipping, and financial sectors. Shipping data showed limited commodity-vessel traffic through the Strait of Hormuz amid Iranian and U.S. blockades, while reported oil flows through the chokepoint remain difficult to verify.
Oil / Energy:
Oil prices fell in early trading as markets awaited details of U.S. sanctions on Iran. The Hormuz traffic restriction remains a supply-chain concern, while the IEA is not discussing a second strategic-reserve release. Concerns also include low U.S. strategic petroleum reserves, potential U.S. export curbs, and proposed EU windfall-profit taxation for oil companies.
Gold / Metals:
Gold rose alongside silver as a weaker dollar, U.S. fiscal unease, Fed-pause expectations, and Iran tensions supported demand. Price action remains focused on inflation data and Jackson Hole policy signals.
Fed / Financials:
Interest-rate uncertainty remains elevated ahead of Jackson Hole, with attention on Kevin Warsh’s inflation-oriented policy history. Global bond yields declined with oil prices, while Treasury officials discussed using the roughly $950 billion Treasury General Account to support government-bond buybacks. High real yields remain a constraint for growth and equity valuations.
Macro / Other:
Concerns over U.S. national debt supported Asian currencies against the dollar and added to demand for gold. Higher fuel costs continue to pressure Southeast Asian budget airlines, alongside strained consumer budgets.
Conclusion:
Index futures are softer ahead of Nvidia earnings and Jackson Hole policy communication. Iran sanctions and Strait of Hormuz shipping conditions remain central energy-market drivers.
Falling oil prices and lower bond yields offer a partial offset to risk sentiment. Fiscal-debt concerns, elevated real yields, and uncertainty around oil transit remain important cross-currents.
Market News Sentiment
Market News Articles: 20
- Neutral: 60.00%
- Negative: 25.00%
- Positive: 15.00%
Sentiment Summary: Market news sentiment is predominantly neutral (60%), with negative coverage (25%) exceeding positive coverage (15%).
Conclusion: The news flow presents a neutral overall tone with a modest negative skew.
GLD,Gold Articles: 5
- Negative: 60.00%
- Positive: 20.00%
- Neutral: 20.00%
Sentiment Summary: GLD/Gold coverage is predominantly negative, with 60% negative, 20% positive, and 20% neutral articles.
Conclusion: Gold-related news tone is negative overall, providing a risk-sentiment data point for indices futures day traders.
USO,Oil Articles: 8
- Negative: 62.50%
- Neutral: 37.50%
Sentiment Summary: USO/Oil coverage is 63% negative and 38% neutral across 8 articles, indicating predominantly negative news tone.
Conclusion: Indices futures day traders should note that oil-related sentiment is negative, with no positive articles in the snapshot.
Market Data Snapshot
ETF Snapshot of major stock market ETFs, Mag7, and others as of: August 24, 2026 07:16
Top Movers & Losers
- IBIT 43.68 Bullish 6.02% ▲
- TSLA 362.86 Bullish 5.14% ▲
- GLD 423.36 Bullish 1.95% ▲
- AMZN 258.63 Bearish -0.57% ▼
- AAPL 309.35 Bearish -0.63% ▼
- NVDA 214.72 Bearish -0.98% ▼
Major Index ETFs: SPY, QQQ, DIA, IWM, IJH
- DIA 532.22 Bullish 0.89% ▲
- IWM 299.96 Bullish 0.77% ▲
- IJH 76.77 Bullish 0.52% ▲
- SPY 765.72 Bullish 0.41% ▲
- QQQ 713.44 Bullish 0.35% ▲
Major Index ETFs are Bullish across the group. DIA is the most bullish mover at +0.89%, followed by IWM at +0.77% and IJH at +0.52%. SPY gained +0.41%, while QQQ is the least positive mover at +0.35%.
Mag 7 Stocks: AAPL, MSFT, GOOG, AMZN, META, NVDA, TSLA
- TSLA 362.86 Bullish 5.14% ▲
- GOOG 341.75 Bullish 1.05% ▲
- META 549.90 Bullish 0.75% ▲
- MSFT 483.24 Bullish 0.43% ▲
- AMZN 258.63 Bearish -0.57% ▼
- AAPL 309.35 Bearish -0.63% ▼
- NVDA 214.72 Bearish -0.98% ▼
Mixed: TSLA is the most bullish mover at +5.14%, followed by GOOG at +1.05%. NVDA is the most bearish mover at -0.98%, with AAPL at -0.63% and AMZN at -0.57%. META at +0.75% and MSFT at +0.43% remain Bullish.
Cross-Market ETFs: TLT, GLD, USO, IBIT
- IBIT 43.68 Bullish 6.02% ▲
- GLD 423.36 Bullish 1.95% ▲
- USO 134.64 Bullish 0.07% ▲
- TLT 82.05 Bearish -0.35% ▼
Other ETFs are Mixed: IBIT is the most bullish mover at +6.02%, followed by GLD at +1.95%; USO is marginally Bullish at +0.07%. TLT is the most bearish mover at -0.35%.
ETF, Mag7, and Cross-Market ETF Insights
Overall Tone
Mixed: equity benchmarks are broadly Bullish while Mag7 participation is selective, with strong IBIT gains and a Bearish TLT move showing cross-market divergence.
Equity ETFs and Mag7:
Major Index ETFs are broadly Bullish: DIA leads at +0.89%, followed by IWM at +0.77%, IJH at +0.52%, SPY at +0.41%, and QQQ at +0.35%. Mag7 action is Mixed, led by TSLA at +5.14%, the most bullish equity mover, while NVDA is the most bearish at -0.98%; GOOG, META, and MSFT are Bullish, while AMZN and AAPL are Bearish. Equity strength is broad across the major ETFs but selective within mega-cap technology.
Cross-Market ETFs:
Cross-market ETFs are Mixed, led by IBIT at +6.02%, the most bullish mover across all groups, while GLD gains +1.95%. USO is marginally Bullish at +0.07%, while TLT is Bearish at -0.35%, making it the most bearish cross-market ETF. Bitcoin and gold strength contrasts with lower Treasury ETF pricing as equities remain broadly Bullish.
Futures Indices – Higher Time Frame Analysis
Summary of the current state of US Indices Futures based on higher time-frame (HTF) technical analysis as of: 2026-08-24: 07:16 CT.
US Indices Futures
- ES: YSFG/MSFG above F0%, WSFG below F0%; benchmarks rising; DTrend short-term; resistance 7838.50, support/pivot 7667.75/7657.75, reversal threshold 7458.00.
- NQ: YSFG/MSFG above F0%, WSFG below F0%; long benchmarks rising; daily DTrend; resistance 29986.25/31090, support 29116.75/27598/27201.5.
- YM: YSFG/MSFG above F0%, WSFG below F0%; benchmarks rising; daily DTrend; resistance 53686/54884, support 52810, weekly reversal threshold 52470.
- EMD: YSFG/MSFG above F0%; weekly UTrend, daily DTrend; benchmarks rising beyond short-term; resistance 3896.2/3941.7, support 3819.8/3804.7, next pivot 3728.1.
- RTY: YSFG/MSFG above F0%, WSFG below F0%; benchmarks rising; weekly UTrend, daily DTrend; resistance 3077.0/3079.9, support 2993.2.
- FDAX: YSFG/MSFG above F0%, WSFG above neutral; weekly UTrend, daily DTrend; benchmarks rising; resistance 26413/26665/26685, support 26130/25965/25159.
Overall State
- Short-Term: Bearish
- Intermediate-Term: Bullish
- Long-Term: Bullish
Conclusion
US index futures retain intermediate- and long-term bullish alignment through rising benchmark structures, UTrend or higher-low weekly pivots, and YSFG/MSFG readings above F0%. Daily and short-term conditions are broadly bearish, with WSFG weakness, declining short benchmarks, and DTrend pivots. FDAX is the sole weekly short-term bullish instrument, while NQ shows the weakest intermediate daily alignment. Key swing resistance remains near recent August highs; listed pivot lows and support zones frame the current pullback structure.
Note: Intra-day counter-trend pullbacks or retracements may occur, HTF is context for informational usage and market structure. Glossary: Session Fib Grids periods of YSFG:’Yearly’, MSFG:’Monthly’, WSFG:’Weekly’
For full details visit: AlphaWebTrader Technicals
ES Daily View
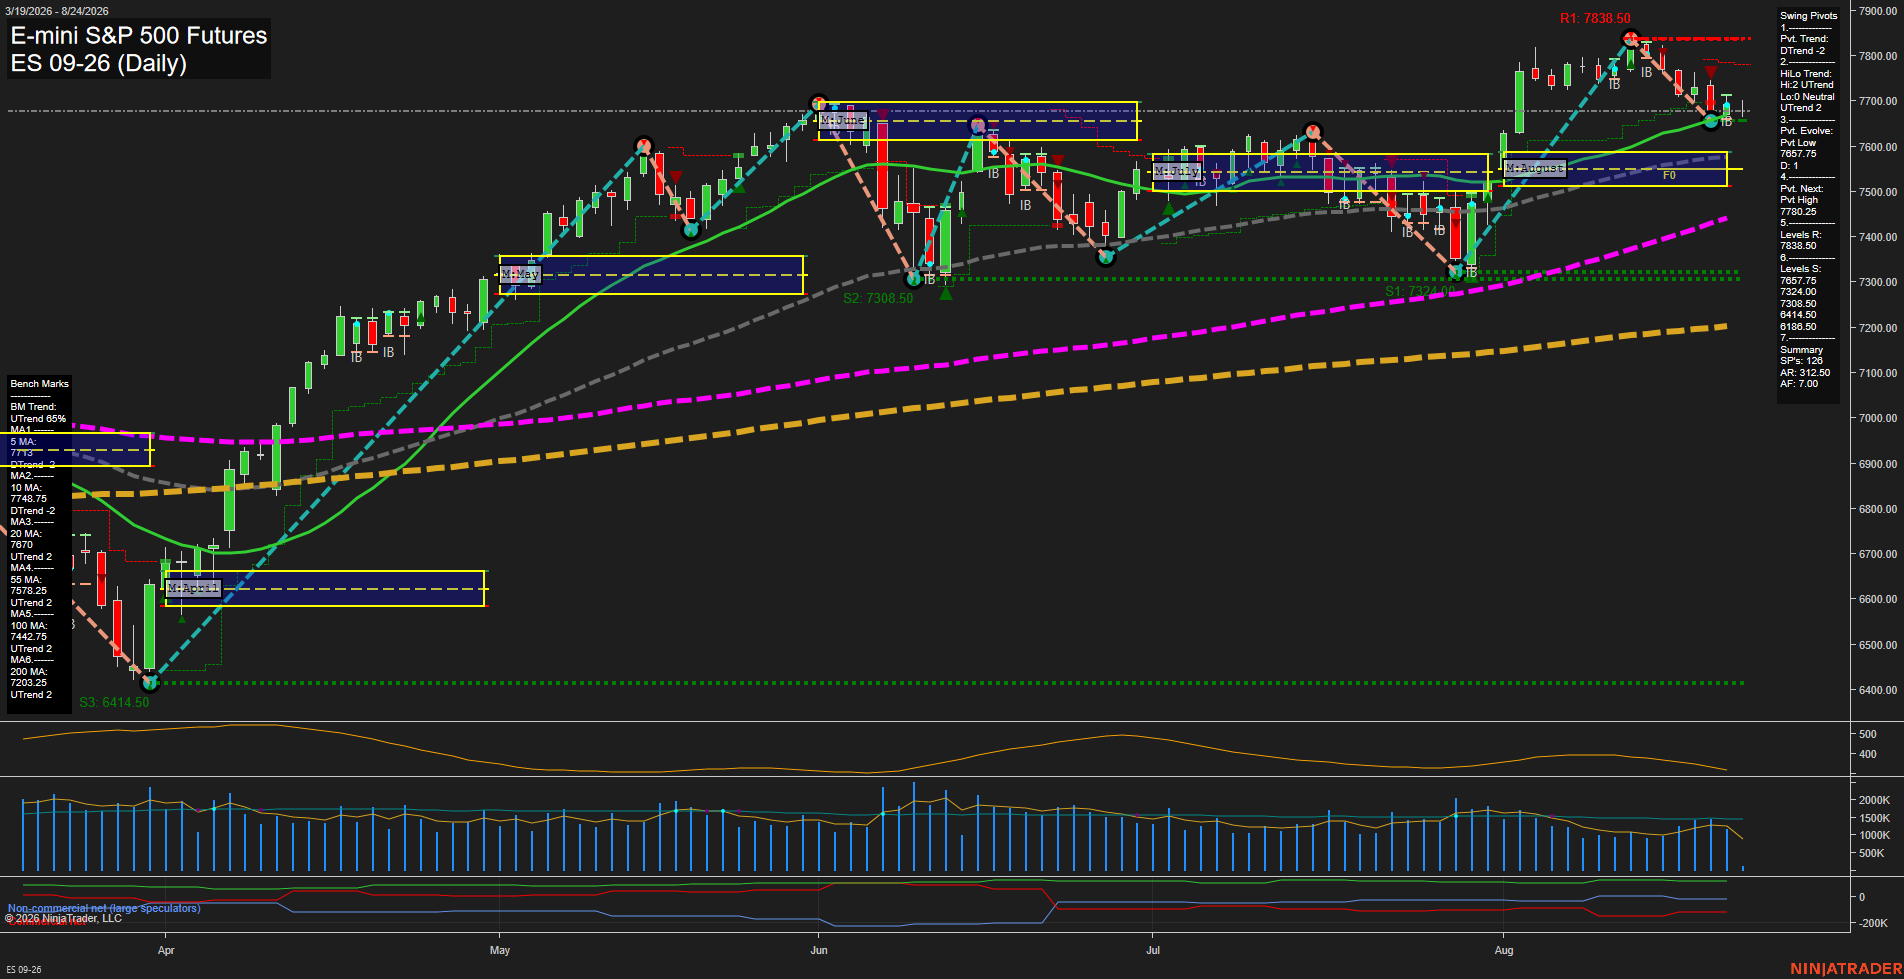
Overall Rating
- Short-Term: Bearish
- Intermediate-Term: Bullish
- Long-Term: Bullish.
Key Insights Summary
The daily structure reflects a short-term pullback within a broader intermediate- and long-term uptrend. Price is below the weekly F0%/NTZ reference and beneath the declining 5-day average, while the pivot trend remains DTrend after rejection from the 7837.75 resistance area. The 7667.75 pivot-low area and 7657.75 support define the immediate downside test zone. Intermediate and long-term alignment remains constructive, with price above the rising 20-, 55-, 100-, and 200-day benchmarks and above the monthly and yearly fib-grid references. Recent small bars and slowing momentum indicate consolidation following the August volatility expansion rather than a broad trend reversal.
View charts on: AlphaWebTrader HTF Charts
NQ Daily View
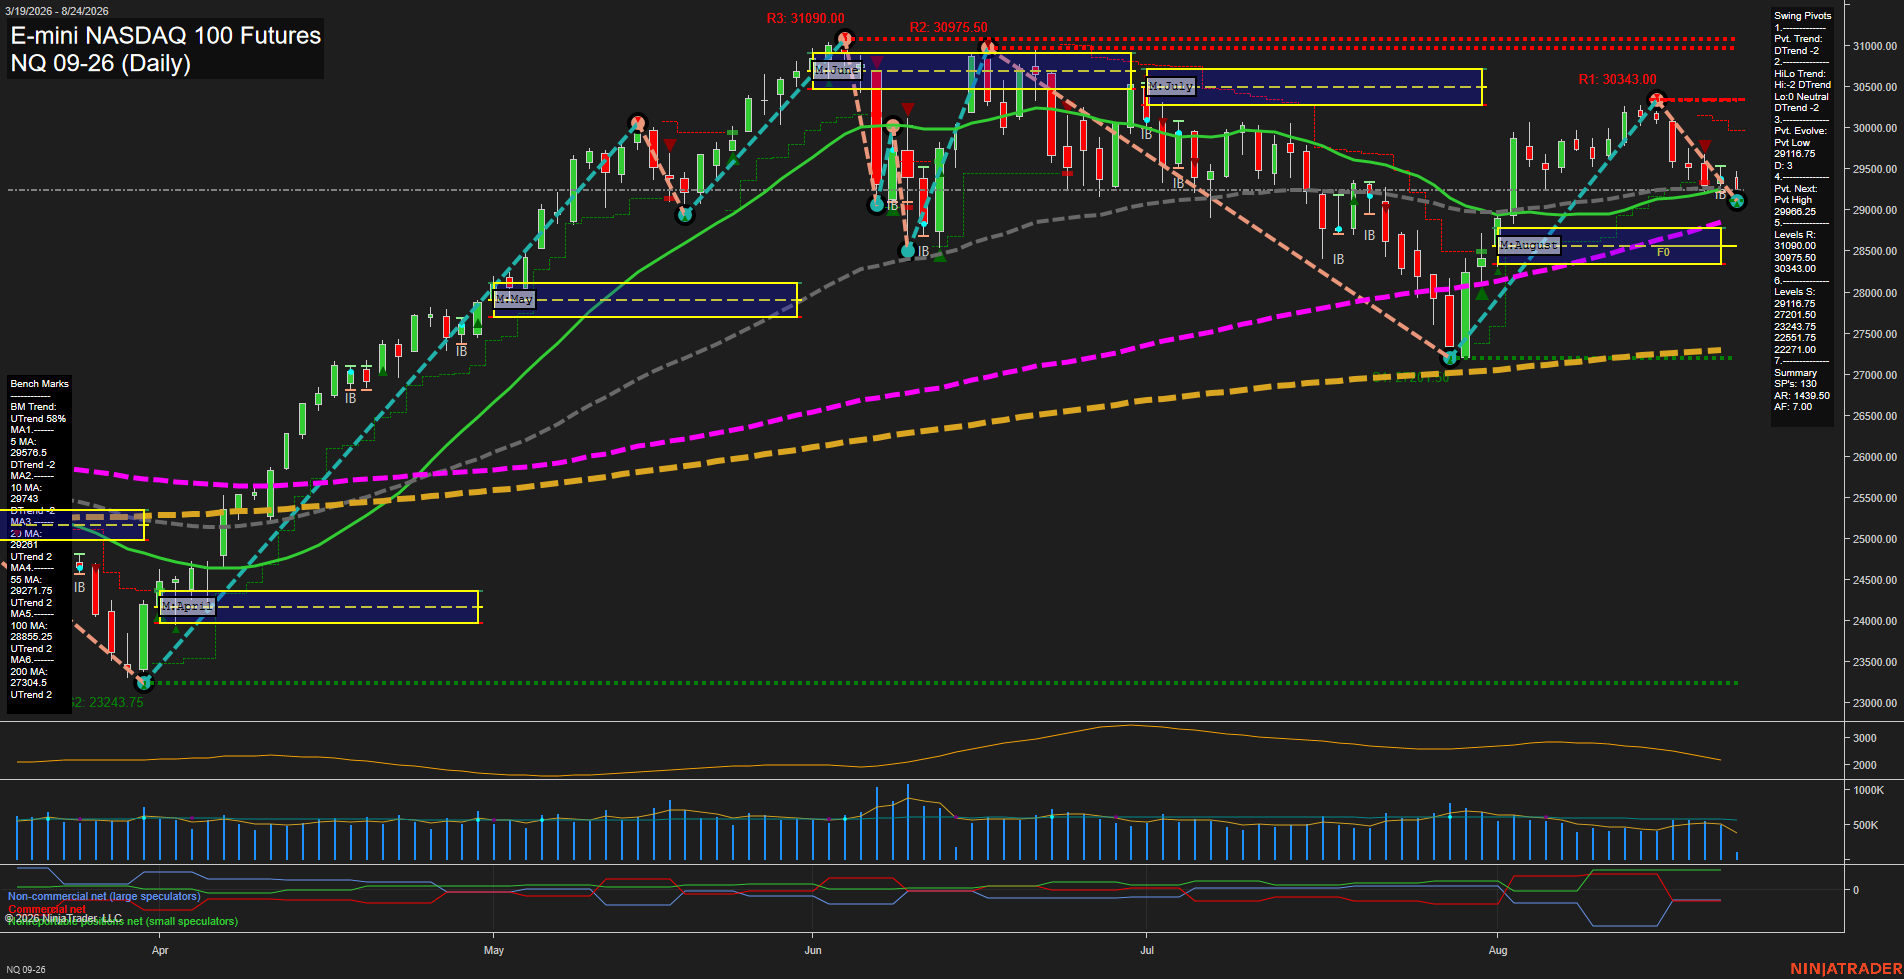
Overall Rating
- Short-Term: Bearish
- Intermediate-Term: Neutral
- Long-Term: Bullish.
Key Insights Summary
Price has retraced from the August swing high and is trading below the weekly F0% area, the short-term moving averages, and the 20/55-day benchmarks. The active pivot structure remains DTrend, with 29116.75 defining the nearby pivot-low support and 29986.25 the reversal threshold for a new pivot high. The August monthly grid and yearly grid remain positive, while the rising 100-day and 200-day averages preserve the broader bullish trend. This creates a short-term countertrend decline within a still constructive long-term structure, with compressed recent bar size and slower momentum indicating consolidation near support following the selloff.
View charts on: AlphaWebTrader HTF Charts
CL Daily View
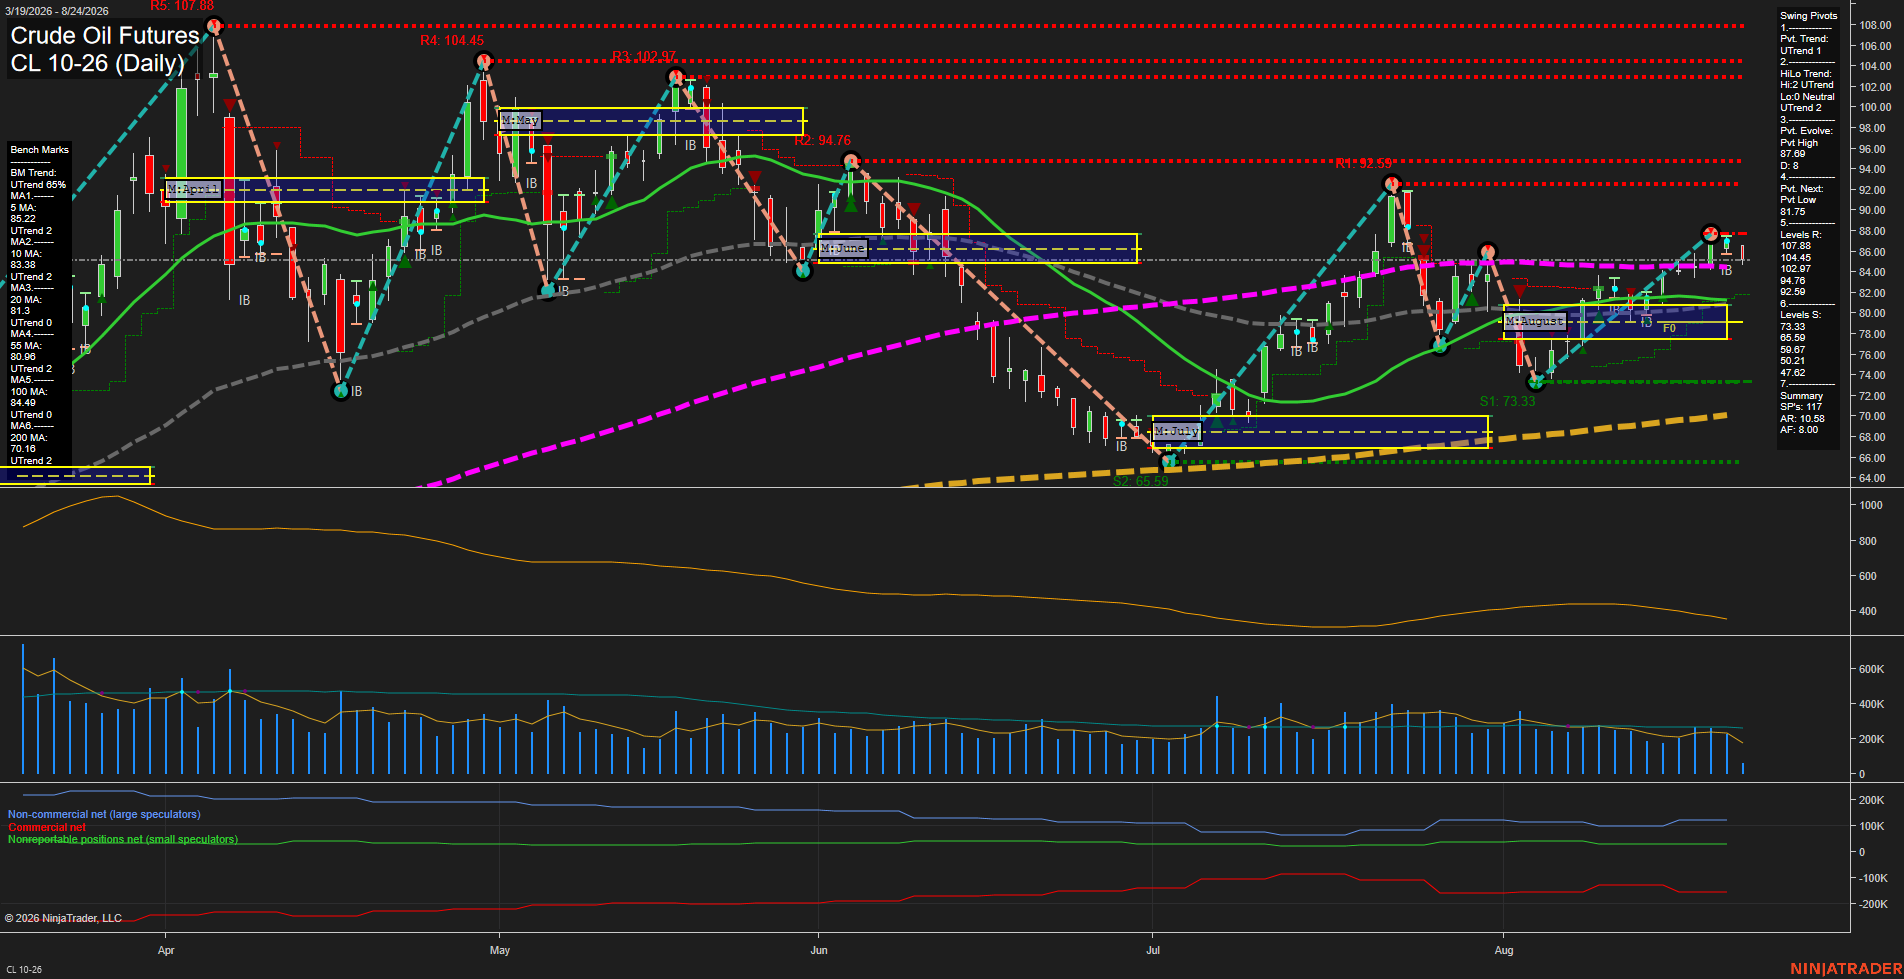
Overall Rating
- Short-Term: Bullish
- Intermediate-Term: Bullish
- Long-Term: Bullish.
Key Insights Summary
Crude maintains a broader higher-low recovery structure from the July 65.59 pivot, with price holding above all major daily benchmarks and the monthly and yearly Fib-grid trends remaining positive. Short-term action is consolidating beneath the 87.69 pivot high and near the 92.59 resistance zone, while the weekly grid remains below its F0% level, reflecting a countertrend pullback within the larger advance. Small recent bars and slowing momentum show compression after the August rally; the 81.75 pivot-reversal level and clustered 20-, 55-, and 100-day averages define the key underlying support structure.
View charts on: AlphaWebTrader HTF Charts
GC Daily View
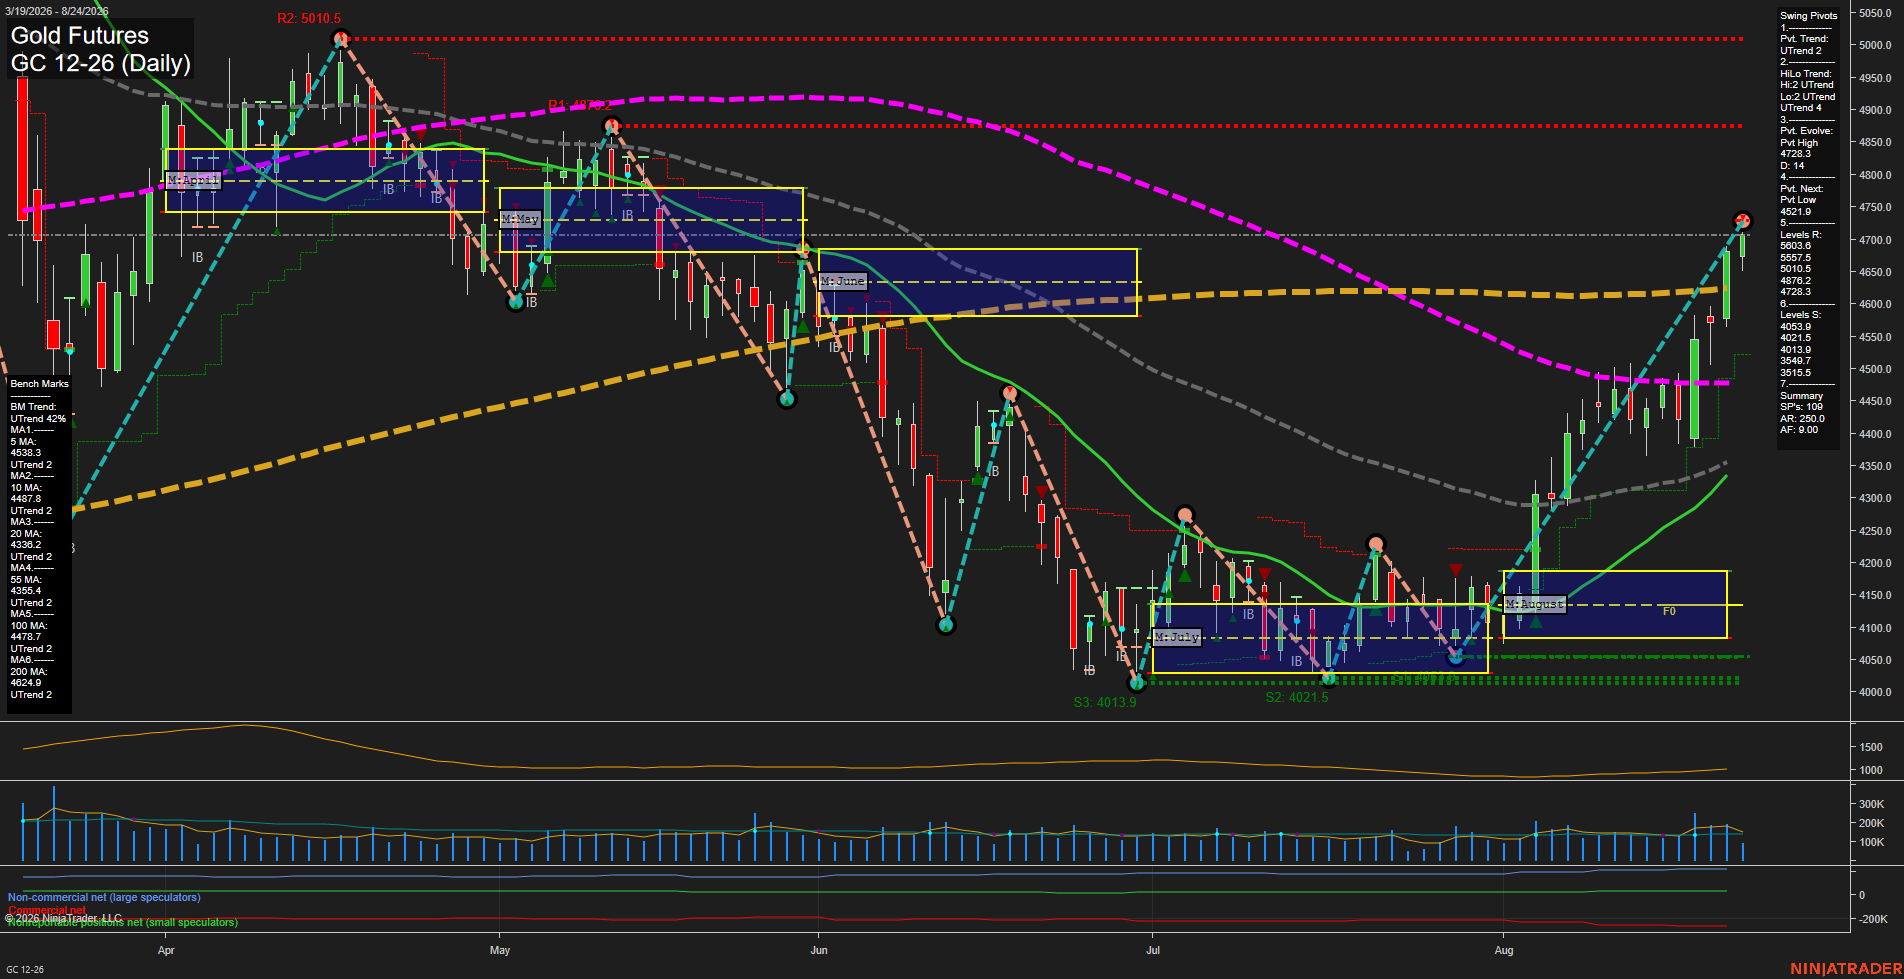
Overall Rating
- Short-Term: Bullish
- Intermediate-Term: Bullish
- Long-Term: Bullish.
Key Insights Summary
Gold has transitioned from the July base near 4,000 into a fast August upside expansion, producing higher swing lows and a new evolving pivot high at 4,728.3. Price is above every daily benchmark, while the weekly and monthly fib grids remain positive, confirming broad multi-timeframe upside alignment. The current advance is extended above the monthly NTZ and is testing the 4,728.3 pivot-high area; 4,872.2 is the next visible swing-resistance reference. The yearly fib-grid reading remains below its F0% and down, representing the remaining longer-cycle countertrend condition despite bullish daily moving-average structure.
View charts on: AlphaWebTrader HTF Charts