S&P 500, Nasdaq, Dow, Russell 2000 and DAX futures face pressure as Treasury yields, tariff risks, oil prices and valuations guide focus.
Fundamentals: U.S. index futures begin the week under pressure from elevated long-term Treasury yields, tariff uncertainty and rising energy costs. The S&P 500’s high valuation, soft housing data and fiscal concerns add caution, while WTI crude nears $87 amid Iran-related supply-route risks. Gold strength and Treasury buybacks highlight continued sensitivity to rates, inflation and policy developments.
Technicals: U.S. index futures enter the week with bearish short-term readings across the S&P 500, Nasdaq, Dow and Russell 2000, while intermediate- and long-term trend measures remain broadly positive. Key levels include ES support near 7658 and resistance at 7780-7838, with Nasdaq futures holding near 29425 after rejection below 30343. Bitcoin ETF IBIT and Tesla led prior-session gains, while Nvidia, Apple and Amazon declined.
Market Week Ahead – Trading 360° view Market Radar for: holidays, earnings, eco-news, market-news summary, news sentiment, and major ETFs, MAG7, Higher Time Frame Analysis Indices Futures Summary, and ETF SPY S&P500, QQQ Tech, USO Oil, GLD Gold Weekly Chart analysis
As of: August 23, 2026 06:15 CT
Earnings Radar
Monitoring for earnings releases by the Magnificent 7, AI-tech-related firms, and major financial institutions.
- CRM Release: 2026-08-26 T:AMC
- NVDA Release: 2026-08-26 T:AMC
Conclusion: CRM and NVDA both report after the close on Aug. 26, concentrating broad index-relevant enterprise software, AI, and semiconductor earnings risk into one session. Market momentum and volume can slow ahead of these major tech releases, with post-release index futures sensitivity centered on reported results and guidance.
For full details visit: Yahoo Earnings Calendar
EcoNews Radar U.S. Events
| Day | Time | Impact | Event |
|---|---|---|---|
| Mon | 14:00 | Medium | Treasury Sec Bessent Speaks |
| Tue | 10:00 | Medium | CB Consumer Confidence |
| Wed | 08:30 | High | Core PCE Price Index m/m |
| Wed | 08:30 | High | Prelim GDP q/q |
| Wed | 08:30 | Medium | Prelim GDP Price Index q/q |
| Wed | 10:30 | Low | Crude Oil Inventories |
| Thu | 08:30 | Medium | Unemployment Claims |
| Thu | 12:15 | Medium | Jackson Hole Symposium |
| Fri | 10:00 | High | Fed Chairman Warsh Speaks |
| Fri | 10:00 | High | Prelim Benchmark Payrolls Revision |
| Fri | 10:00 | Medium | Revised UoM Consumer Sentiment |
| Fri | 10:00 | Medium | Revised UoM Inflation Expectations |
| Fri | 12:15 | High | Jackson Hole Symposium |
| Sat | 12:15 | Medium | Jackson Hole Symposium |
EcoNews Summary
High-impact USD releases concentrate on Wednesday and Friday. Wednesday’s 08:30 Core PCE inflation and preliminary GDP reports frame the key macroeconomic release window. Friday features simultaneous 10:00 releases on the Fed Chair’s remarks and the preliminary benchmark payrolls revision, followed by a high-impact Jackson Hole Symposium session at 12:15.
Event Notes:
- Wednesday 08:30 Core PCE Price Index m/m: Measures the monthly change in personal consumption expenditures inflation excluding food and energy. Traders monitor it as a closely watched inflation gauge tied to monetary-policy conditions.
- Wednesday 08:30 Prelim GDP q/q: Measures the annualized quarterly pace of U.S. economic growth in the preliminary estimate. Traders monitor it for evidence on economic activity and demand conditions.
- Friday 10:00 Fed Chairman Warsh Speaks: Public remarks from the Federal Reserve Chair. Traders monitor policy commentary, inflation assessment, economic conditions, and interest-rate guidance.
- Friday 10:00 Prelim Benchmark Payrolls Revision: Updates prior employment estimates using more complete payroll records. Traders monitor the revision for changes to the perceived strength of the labor market.
- Friday 12:15 Jackson Hole Symposium: High-impact policy symposium involving central-bank and economic-policy participants. Traders monitor official remarks and policy discussions for shifts in monetary-policy messaging.
Conclusion:
The week’s single most important event is Wednesday 08:30 Core PCE Price Index m/m, alongside preliminary GDP. Market momentum and volume often slow ahead of major PCE and GDP releases, with increased volatility at release time. Friday’s 10:00 time cycle includes two high-impact events and acts as a potential catalyst for reversals or continuations. Crude-inventory data is also on the calendar; high oil prices directly affect markets through inflation and geopolitical concerns.
For full details visit: Forex Factory EcoNews
Market News Summary:
Index futures enter the week with elevated-rate pressure, tariff uncertainty, energy-driven geopolitical risk, and stretched equity-valuation concerns.
Primary Drivers & Risks:
- Primary Driver: Elevated long-term Treasury yields
- Primary Risk: Canada tariff escalation
Tone:
Cautious, with rate and policy concerns weighing on risk sentiment.
Stock Market / ETFs / Indices:
U.S. equities retreated from record highs as long-term yields stayed elevated. The S&P 500 Shiller CAPE ratio exceeded 40, a level previously reached only once since 1871, while AI infrastructure spending remained a key support amid weaker broader macro conditions.
Geopolitical:
The United States imposed a 50% tariff on roughly $20 billion of Canadian imports after bilateral talks broke down. Stalled Iran negotiations and sharply reduced Strait of Hormuz tanker traffic also sustained geopolitical uncertainty.
Oil / Energy:
WTI crude rose another 5% to nearly $87 per barrel as Iran-related tensions and depressed Hormuz tanker traffic tightened the focus on supply-route risk. Higher UK inflation was also linked largely to increased energy costs.
Gold / Metals:
Gold moved above its 200-day moving average as Treasury buybacks briefly reduced yields and the dollar weakened.
Fed / Financials:
Long-term Treasury yields remained elevated despite an expanded Treasury long-maturity buyback program, which briefly pushed yields lower before they rebounded. Federal debt exceeding $40 trillion intensified fiscal concerns, while Jackson Hole attention centered on inflation, volatility, and Fed independence after Treasury bond-market intervention.
Macro / Other:
Housing conditions remained soft: starts, pending sales, and builder sentiment were depressed as mortgage rates stayed near 6.7%. Weak construction continued alongside an underlying housing shortage.
Conclusion:
Elevated Treasury yields, fiscal concerns, and oil-price strength are the main macro forces affecting equity futures. Tariff developments with Canada add a direct policy-related risk.
High equity valuations and softer housing data provide additional caution signals. Treasury buybacks, dollar weakness, and gold strength reflect shifting rate and policy sensitivity.
Market News Sentiment
Market News Articles: 5
- Neutral: 80.00%
- Negative: 20.00%
Sentiment Summary: Market news sentiment is predominantly neutral (80%), with a smaller negative component (20%).
Conclusion: Indices futures day traders are facing a largely neutral news backdrop with limited negative sentiment.
GLD,Gold Articles: 1
- Negative: 100.00%
Sentiment Summary: Gold-related coverage was 100% negative across 1 article.
Conclusion: The snapshot reflects negative sentiment toward GLD and gold, with limited breadth due to a single article.
No stock-related news items found.
Sentiment Summary: No stock-related news items were identified, leaving market sentiment neutral based on the available snapshot.
Conclusion: Indices futures day traders have no news-driven equity market sentiment signal from this data.
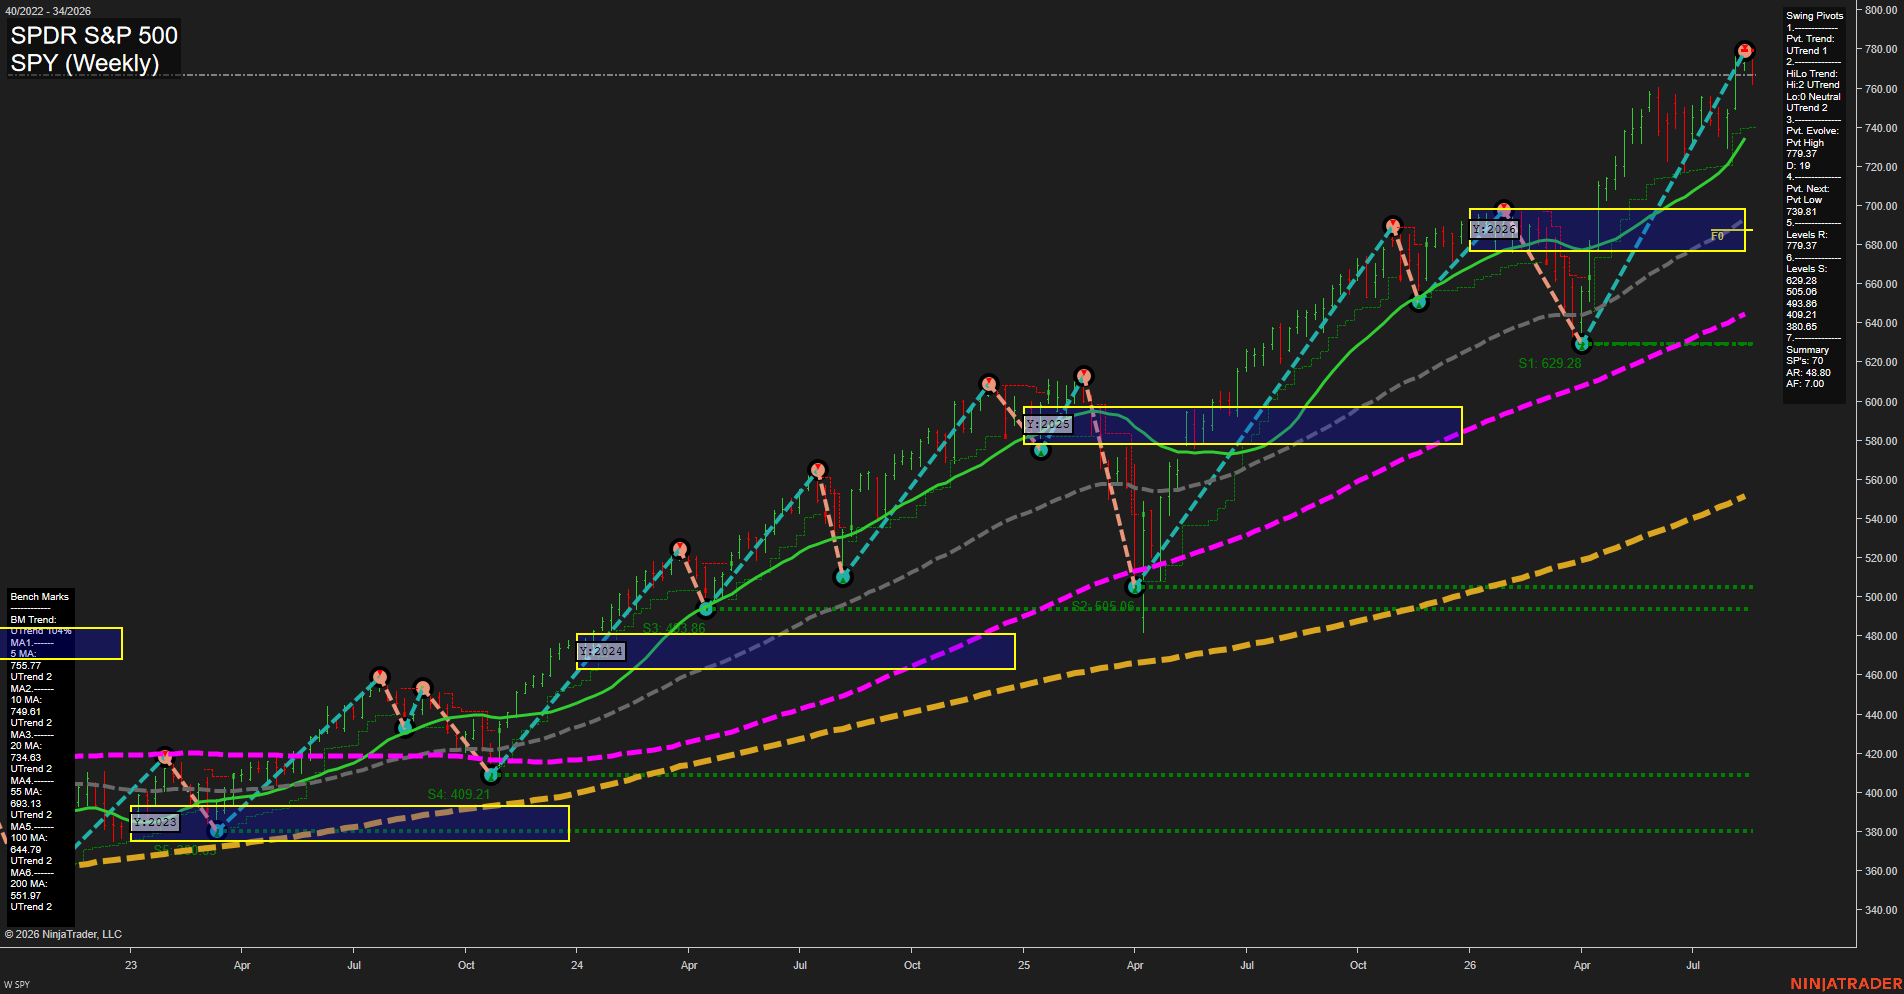
SPY Weekly View
Overall Rating
- Short-Term: Bullish
- Intermediate-Term: Bullish
- Long-Term: Bullish.
Key Insights Summary
SPY’s weekly structure is a broad, mature advance with price accelerating into a fresh pivot high at 779.37. From a futures swing-trader perspective, the trend alignment is uniformly positive: pivot trend and HiLo trend are both UTrend, while all six benchmark averages are rising and remain materially below price. The 739.81 pivot-low reversal level defines the nearest weekly structural reference beneath the current high. Price is extended above the 2026 yearly NTZ and its F0% area near the upper-680s to 700 zone, reflecting strong upside acceptance rather than consolidation. Fast momentum and medium-sized weekly bars characterize an advancing, higher-high/higher-low cycle, with the large separation from the 20-, 55-, 100-, and 200-period benchmarks indicating a strong but increasingly stretched trend phase.
View charts on: AlphaWebTrader HTF Charts
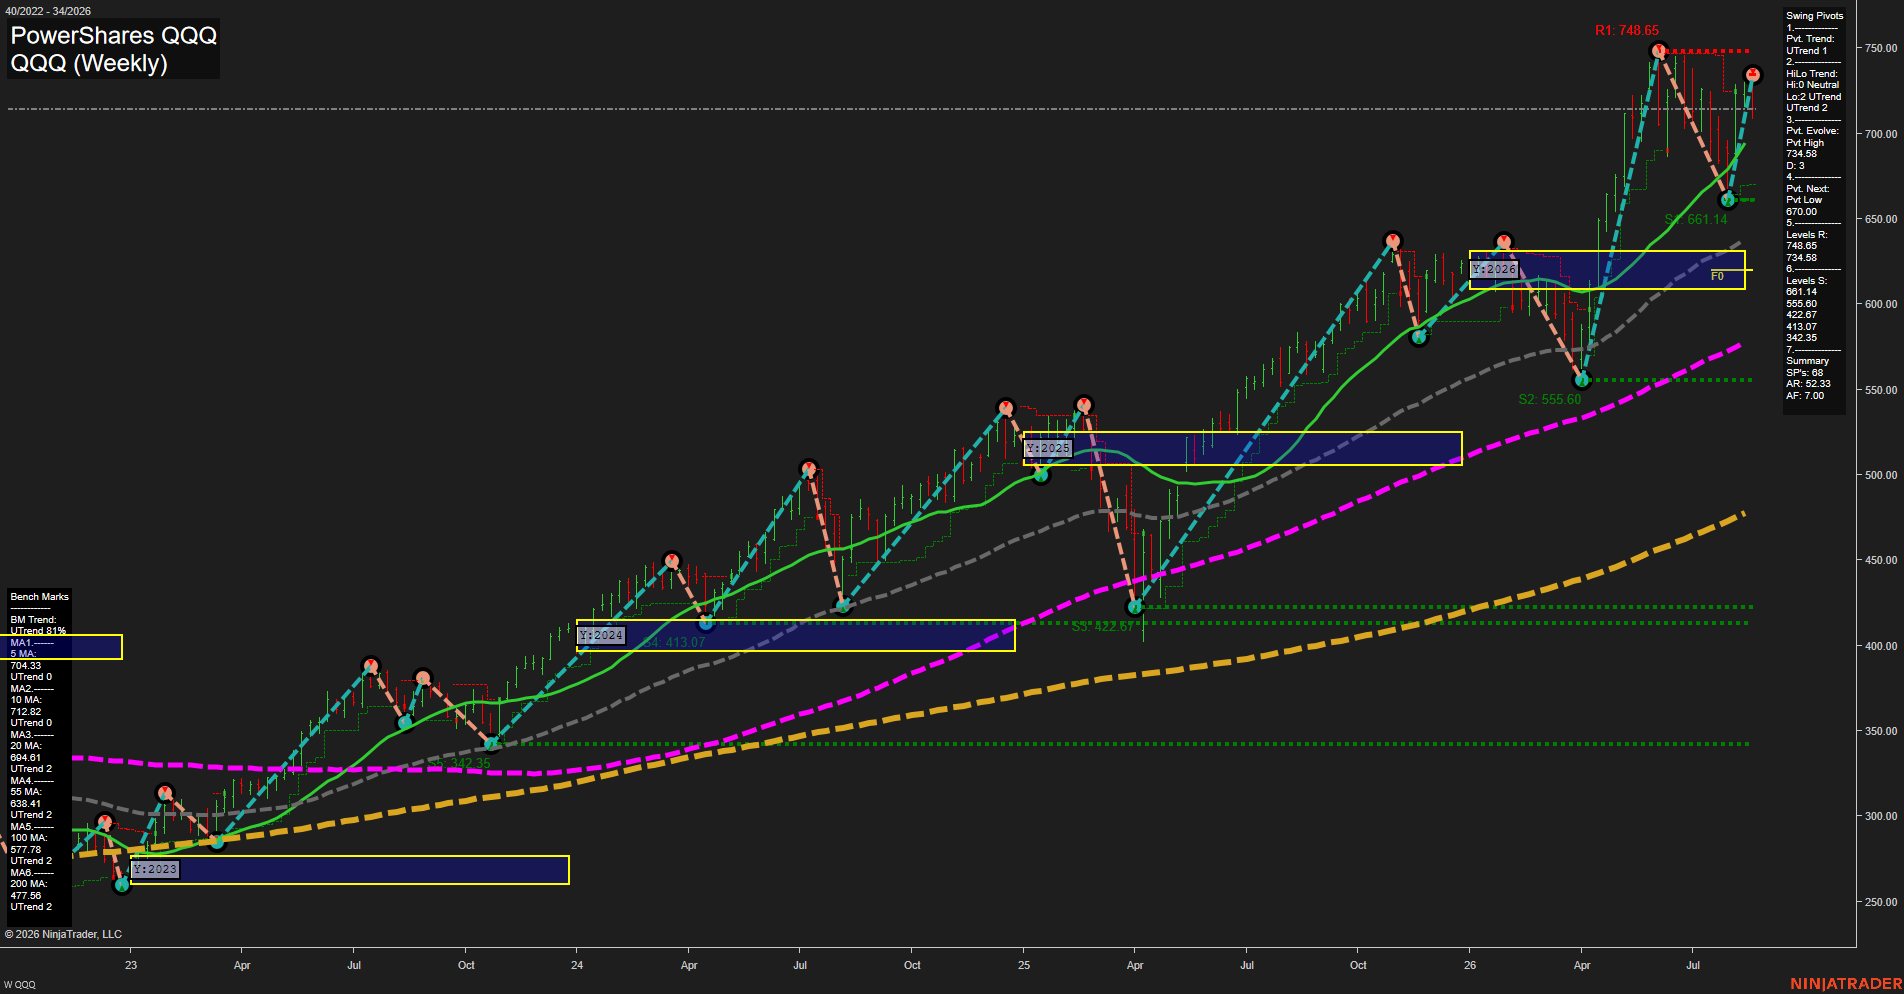
QQQ Weekly View
Overall Rating
- Short-Term: Bullish
- Intermediate-Term: Bullish
- Long-Term: Bullish.
Key Insights Summary
QQQ remains in a broad weekly uptrend, a structure that aligns with bullish Nasdaq futures swing conditions. Price is holding above every benchmark average, while the 5 and 10 period benchmarks confirm strong near-term momentum. The recent rally recovered from the 661.14 support area and is now rotating beneath the 734.58 pivot-high resistance, with 748.65 marking the higher resistance reference. The intermediate and long-term structure remains constructive through rising support and widely separated, upward-sloping moving averages; however, the proximity to prior highs indicates an extended, volatile consolidation-to-breakout environment rather than a low-volatility trend leg.
View charts on: AlphaWebTrader HTF Charts
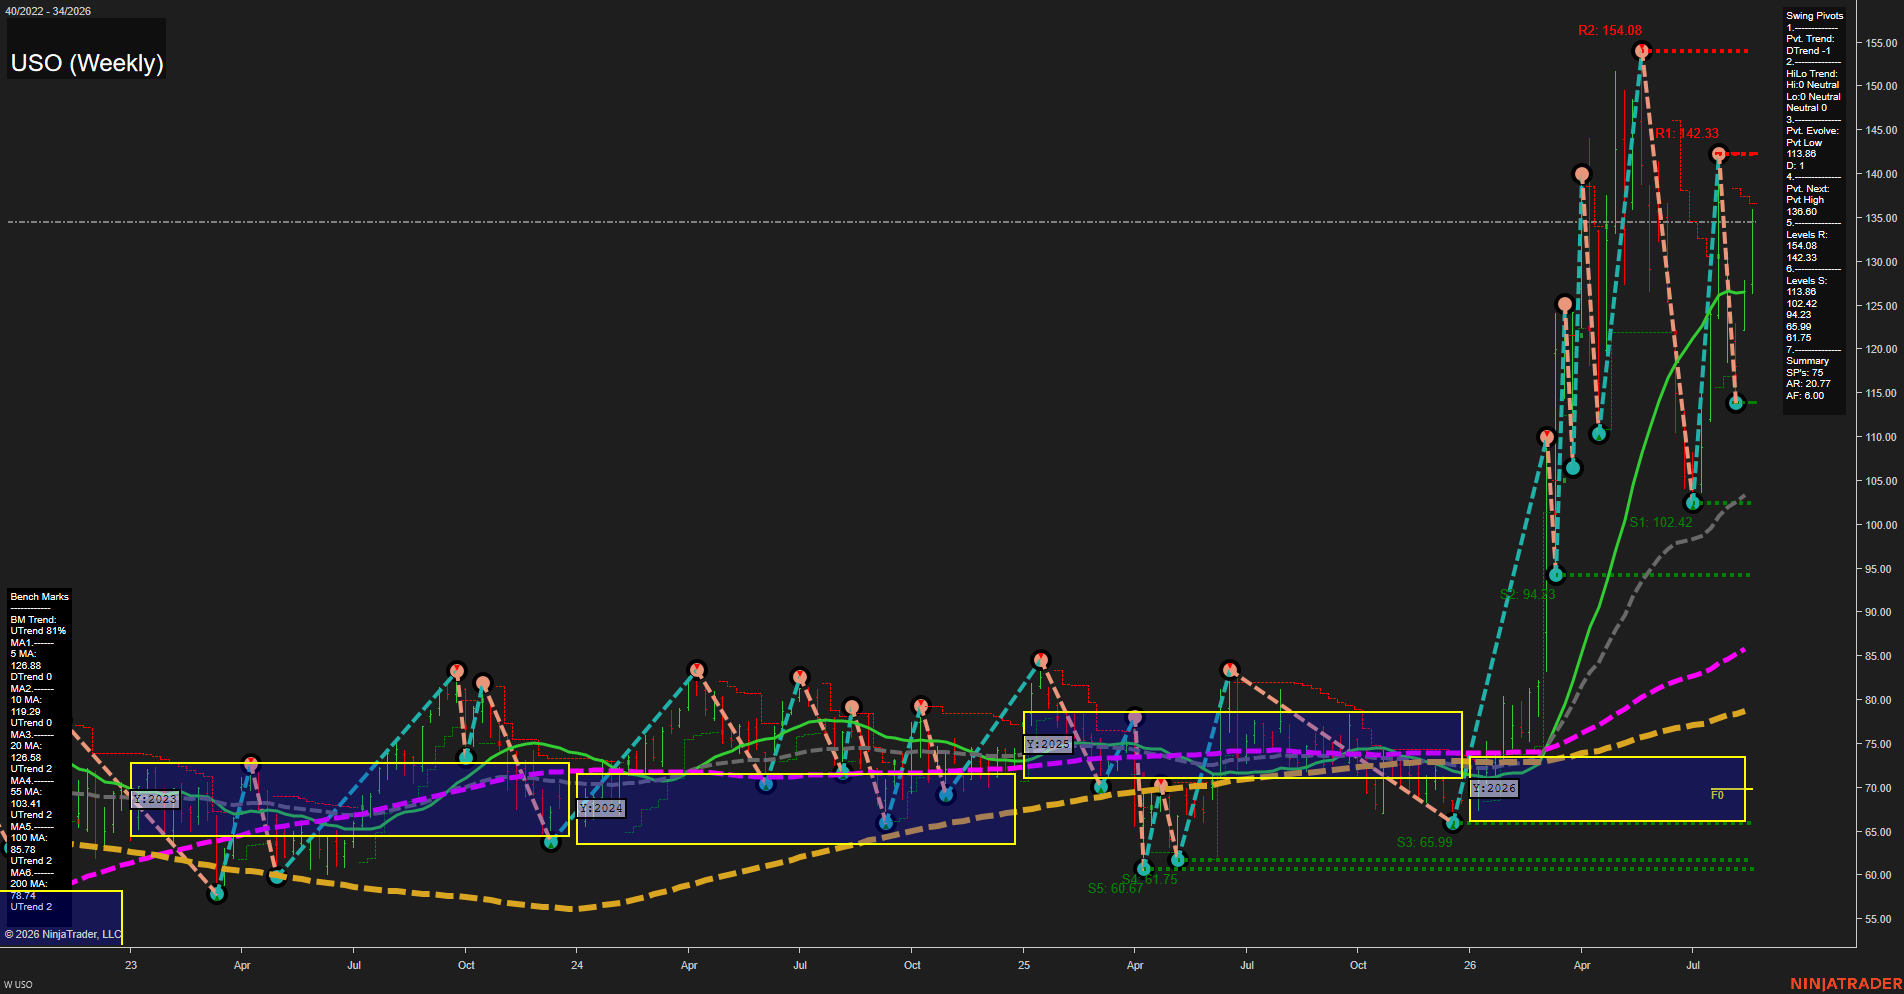
USO Weekly View
Overall Rating
- Short-Term: Neutral
- Intermediate-Term: Bullish
- Long-Term: Bullish.
Key Insights Summary
From a futures swing-trader perspective, USO remains in a powerful higher-time-frame expansion following the decisive breakout from the 2023-2026 base near the low-70s. Price is substantially above the rising 20, 55, 100, and 200-period benchmarks, confirming broad intermediate- and long-term upside structure. The short-term pivot state remains a DTrend after the sharp rejection from 154.08 and subsequent volatile retracement, while the rebound from the 113.86 pivot low has returned price to the 136.80 pivot-high threshold. This creates a high-volatility, two-sided swing environment between 113.86 support and 142.33 resistance, with 154.08 defining the major prior upside extreme. The large weekly bars and fast momentum reflect an active energy-price cycle characterized by rapid impulse moves, deep retracements, and strong countertrend rebounds.
View charts on: AlphaWebTrader HTF Charts
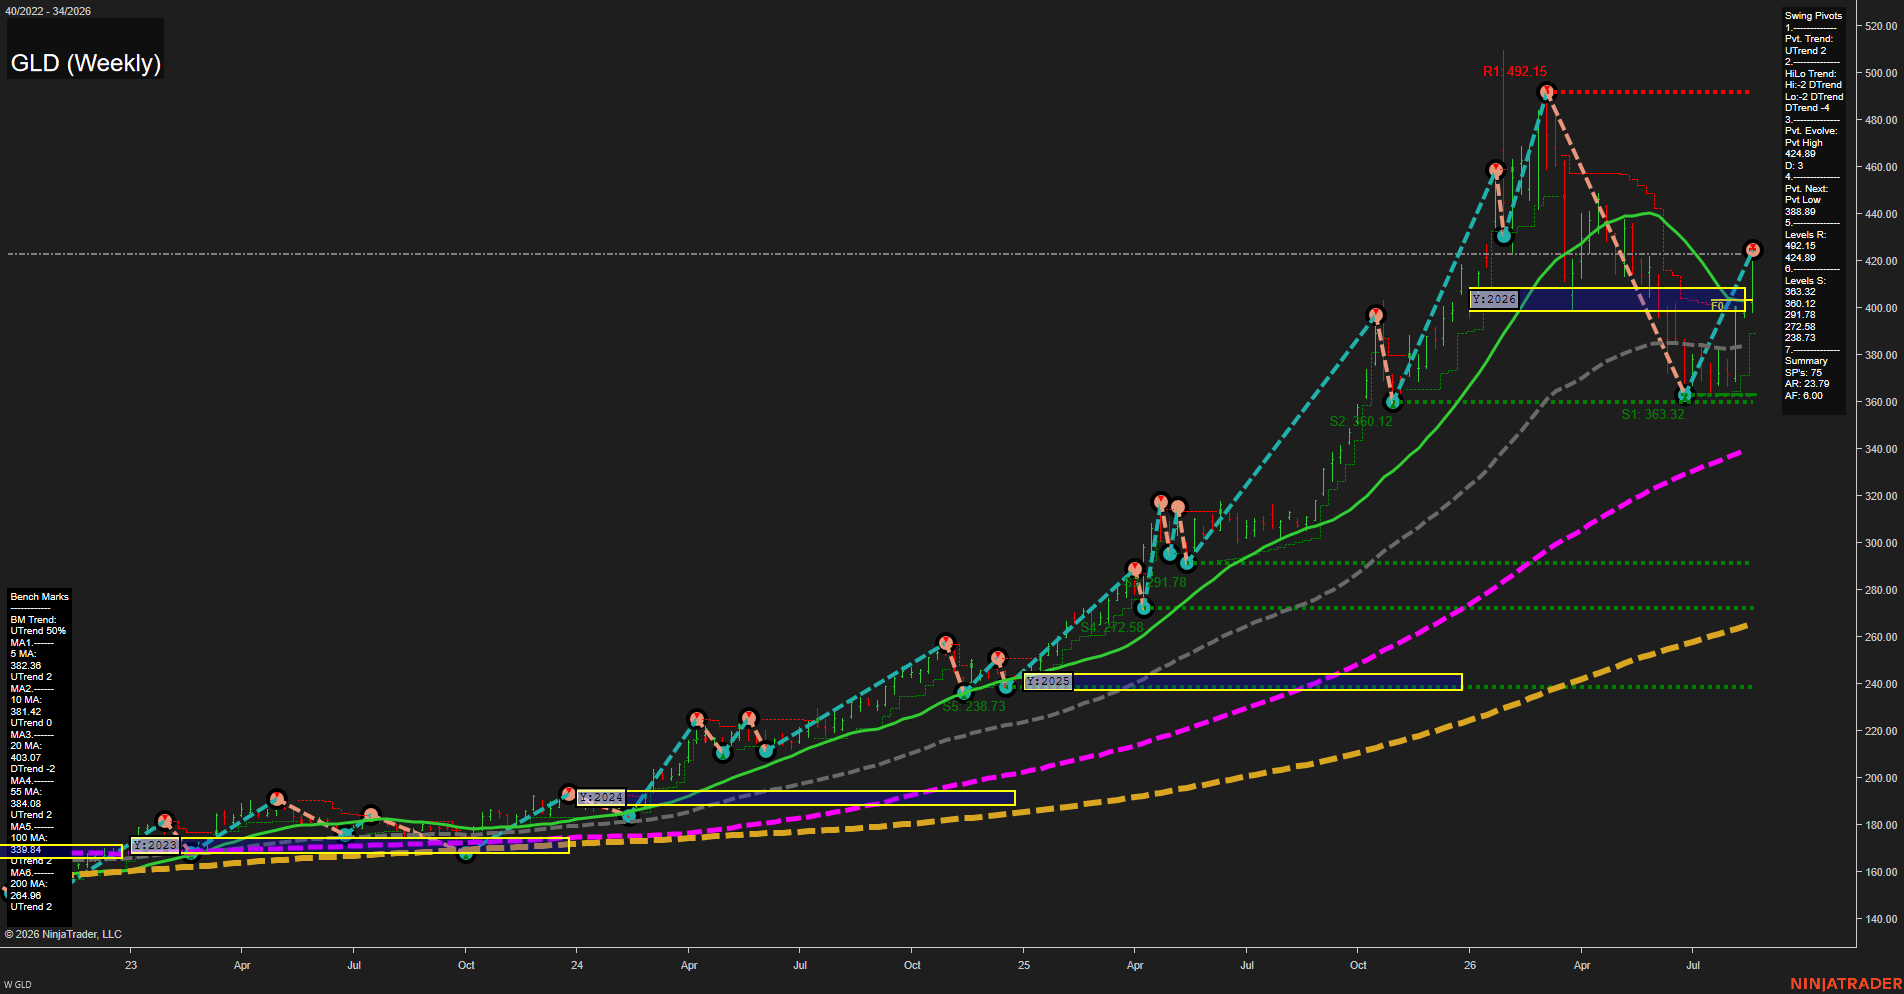
GLD Weekly View
Overall Rating
- Short-Term: Bullish
- Intermediate-Term: Bullish
- Long-Term: Bullish.
Key Insights Summary
GLD reflects a strong futures-style gold swing structure: price has rebounded sharply from the 360.12-363.32 support zone, reclaimed the 2026 yearly NTZ, and is trading above the 20, 55, 100, and 200 benchmarks. The short-term pivot sequence is in an UTrend, with 424.89 converted from a prior pivot level into the immediate reference area and 492.15 remaining the major overhead swing-high level. The intermediate pivot structure remains constructive through higher highs and higher lows, although the declining 20-period benchmark shows that the advance is recovering from a sizeable countertrend retracement rather than extending in a smooth trend. The 388.89 next-pivot level defines the current swing reversal reference, while the 360 area remains the major completed-pullback base.
View charts on: AlphaWebTrader HTF Charts