Stocks rose as tech led and Treasury yields fell, while bond-buying plans, PCE inflation, Iran-Hormuz news and elevated gold shaped market focus.
Fundamentals: Equities advanced with technology leadership as Treasury yields posted their largest decline since June, supporting broader risk appetite. Treasury plans to increase long-dated bond purchases drew scrutiny over inflation and policy credibility, while weak consumer confidence and elevated valuations remained concerns. Crude fell on Iran-Hormuz developments, while gold held near record levels.
Technicals: ETFs were mixed, with Nvidia, Meta and TLT advancing while Google, Amazon and USO declined. Futures market analysis showed bullish intermediate- and long-term structures across major U.S. and European indices, though several contracts faced short-term pullbacks or consolidation near pivot resistance. Dow futures retained the strongest near-term alignment, while Nasdaq, Russell 2000 and E-mini contracts showed softer daily momentum.
After Market Close daily snapshot: market news summary and sentiment, major ETFs, Magnificent 7 analysis, Indices Futures Higher Time Frame Analysis, and E-mini S&P500, Nasdaq 100, NYMEX Crude, Gold Futures Daily Chart analysis.
As of: August 25, 2026 05:00 CT
Market News Summary:
Equities rose with technology leadership and a sharp Treasury-yield decline, while Treasury bond-buying plans, inflation data, Iran-Hormuz developments, and elevated gold prices remained key cross-market focus points.
Primary Drivers & Risks:
- Primary Driver: Treasury yields fall, tech leads
- Primary Risk: Bond-policy credibility and inflation
Tone:
Constructive index action with notable macro and valuation caution.
Stock Market / ETFs / Indices:
Major indexes rose as technology stocks led, alongside the benchmark Treasury yield’s largest decline since June. SPX technical commentary cited pressure on 7,480 support, while earnings growth was described as concentrated in energy and AI infrastructure amid elevated valuations, weak consumer demand, and tepid GDP growth. AI exposure remains a dominant theme, though commentary noted broader fundamentals are gaining importance as liquidity tightens.
Geopolitical:
Iran-related secondary sanctions drew a muted initial market response, with equities flat and Brent crude lower earlier in the session. Iran-Oman Hormuz talks and reports that U.S. mines were removed from Hormuz added to the day’s geopolitical backdrop.
Oil / Energy:
WTI and Brent retreated as Hormuz developments and Pakistan-mediated diplomacy reduced immediate supply-risk pressure. In contrast, major midstream operators reported strong second-quarter results, higher guidance, improved Permian takeaway capacity, and sustained U.S. LNG and natural-gas-liquids export demand.
Gold / Metals:
Gold remained near record territory after its strongest month in decades, supported by inflation, policy, U.S. debt, and bond-market concerns. Intraday commentary highlighted profit-taking near $4,650-$4,700 and attention on the upcoming PCE inflation report, while bullish target commentary cited $5,000 and near-term resistance around $4,771-$4,780.
Fed / Financials:
Treasury plans to increase purchases of long-dated bonds were associated with lower yields and liquidity support. Stanley Druckenmiller criticized the approach, arguing it could fail to lower yields and damage Treasury credibility; options activity also showed substantial positioning for a bond rally.
Macro / Other:
Consumer confidence fell, adding to concerns over demand conditions. Bitcoin briefly exceeded $80,000 as crypto sentiment improved and leveraged positions were liquidated.
Conclusion:
Falling Treasury yields and technology leadership supported equity gains. Treasury liquidity and bond-buying measures were central to the cross-asset move.
Bond-policy criticism, the PCE inflation release, stretched equity valuations, and weakening consumer confidence remain key risks. Iran-Hormuz developments pressured crude while gold retained strong demand as a policy and inflation hedge.
Market News Sentiment
Market News Articles: 36
- Neutral: 41.67%
- Positive: 30.56%
- Negative: 27.78%
Sentiment Summary: Of 36 market news articles, 42% were neutral, 31% positive, and 28% negative, indicating broadly balanced coverage with a neutral tilt.
Conclusion: Indices futures day traders are facing mixed news sentiment, with neutral reporting representing the largest share.
GLD,Gold Articles: 14
- Positive: 57.14%
- Negative: 21.43%
- Neutral: 21.43%
Sentiment Summary: GLD/Gold coverage is moderately positive, with 57% positive, 21% negative, and 21% neutral articles across 14 articles.
Conclusion: Gold-related news tone is net positive, while a meaningful share of coverage remains neutral or negative.
USO,Oil Articles: 11
- Negative: 36.36%
- Positive: 36.36%
- Neutral: 27.27%
Sentiment Summary: USO and oil coverage is balanced, with 36% positive, 36% negative, and 27% neutral articles across 11 items.
Conclusion: Oil-related news sentiment presents no clear directional bias for indices futures day traders.
Market Data Snapshot
ETF Snapshot of major stock market ETFs, Mag7, and others as of: August 25, 2026 05:00
Top Movers & Losers
- NVDA 213.05 Bullish 2.19% ▲
- META 570.05 Bullish 1.97% ▲
- TLT 83.47 Bullish 1.10% ▲
- GOOG 343.34 Bearish -0.36% ▼
- AMZN 261.06 Bearish -0.39% ▼
- USO 126.15 Bearish -4.58% ▼
Major Index ETFs: SPY, QQQ, DIA, IWM, IJH
- QQQ 710.72 Bullish 0.62% ▲
- IWM 299.23 Bullish 0.42% ▲
- SPY 765.91 Bullish 0.32% ▲
- DIA 535.24 Bullish 0.30% ▲
- IJH 76.14 Bearish -0.08% ▼
Major index ETFs were Mixed: QQQ led the Bullish move at +0.62%, followed by IWM at +0.42%, SPY at +0.32%, and DIA at +0.30%. IJH was the most Bearish mover, though marginally lower at -0.08%.
Mag 7 Stocks: AAPL, MSFT, GOOG, AMZN, META, NVDA, TSLA
- NVDA 213.05 Bullish 2.19% ▲
- META 570.05 Bullish 1.97% ▲
- MSFT 491.71 Bullish 0.90% ▲
- TSLA 350.25 Bullish 0.37% ▲
- AAPL 309.90 Bearish -0.14% ▼
- GOOG 343.34 Bearish -0.36% ▼
- AMZN 261.06 Bearish -0.39% ▼
Mixed Mag7 snapshot: NVDA is the most bullish mover at +2.19%, followed by META at +1.97%. MSFT gained +0.90% and TSLA added +0.37%, while AAPL was marginally Bearish at -0.14%. AMZN is the most bearish mover at -0.39%, with GOOG down -0.36%.
Cross-Market ETFs: TLT, GLD, USO, IBIT
- TLT 83.47 Bullish 1.10% ▲
- GLD 428.07 Bullish 0.32% ▲
- IBIT 44.72 Bullish 0.18% ▲
- USO 126.15 Bearish -4.58% ▼
Mixed cross-market snapshot: TLT is the most bullish mover at +1.10%, followed by GLD at +0.32% and marginally bullish IBIT at +0.18%. USO is the most bearish mover, down -4.58%.
ETF, Mag7, and Cross-Market ETF Insights
Overall Tone
Mixed: equity benchmarks are modestly Bullish while technology leadership is selective, alongside a sharply Bearish energy move.
Equity ETFs and Mag7:
Major Index ETFs are broadly but modestly Bullish, led by QQQ at +0.62%, followed by IWM at +0.42%, SPY at +0.32%, and DIA at +0.30%; IJH is marginally Bearish at -0.08%. Mag7 action is selective: NVDA is the most bullish mover at +2.19% and META follows at +1.97%, while AMZN is the most bearish mover at -0.39%, with GOOG at -0.36% and AAPL at -0.14%.
Cross-Market ETFs:
Cross-market ETFs are Mixed, with TLT the most bullish mover at +1.10%, while GLD at +0.32% and IBIT at +0.18% are also Bullish. USO is the most bearish mover at -4.58%, creating a pronounced Bearish divergence against modestly Bullish equities and the Bullish bond ETF move.
Futures Indices – Higher Time Frame Analysis
Summary of the current state of US Indices Futures based on higher time-frame (HTF) technical analysis as of: 2026-08-25: 17:00 CT.
US Indices Futures
- ES: YSFG/MSFG rising, WSFG mixed; above longer benchmarks, daily pivot down below short benchmarks. Support 7655/7635; resistance 7747.5/7838.5.
- NQ: YSFG/MSFG rising, WSFG declining; above 100/200-day benchmarks, daily DTrend. Support 28946.75/27201.5; resistance 30343/31090.
- YM: YSFG/MSFG/WSFG rising; above all benchmarks with higher pivots. Support 52934-52812/52456; resistance 53790/54884.
- EMD: YSFG/MSFG rising, WSFG weak; above longer benchmarks and upward HiLo pivots. Support 3804.7/3793.7; resistance 3854.5-3857.9/3941.7.
- RTY: YSFG/MSFG rising, WSFG neutral; above rising benchmarks, daily DTrend below 3079.9. Support 3014.2/2992.3; resistance 3059.4/3079.9.
- FDAX: YSFG/MSFG/WSFG rising; above major benchmarks with upward intermediate pivots. Support 25985/25153; resistance 26401/26665.
Overall State
- Short-Term: Bearish
- Intermediate-Term: Bullish
- Long-Term: Bullish
Conclusion
Higher-time-frame correlations remain upward across all six contracts, supported by rising YSFG/MSFG structures and longer-term benchmark alignment. ES, NQ, EMD, and RTY show daily pullback conditions beneath short benchmarks; YM and FDAX retain firmer short-term structure. Major pivot-high resistance is limiting current advances while nearby pivot and benchmark zones define structural support.
Note: Intra-day counter-trend pullbacks or retracements may occur, HTF is context for informational usage and market structure. Glossary: Session Fib Grids periods of YSFG:’Yearly’, MSFG:’Monthly’, WSFG:’Weekly’
For full details visit: AlphaWebTrader Technicals
ES Daily View
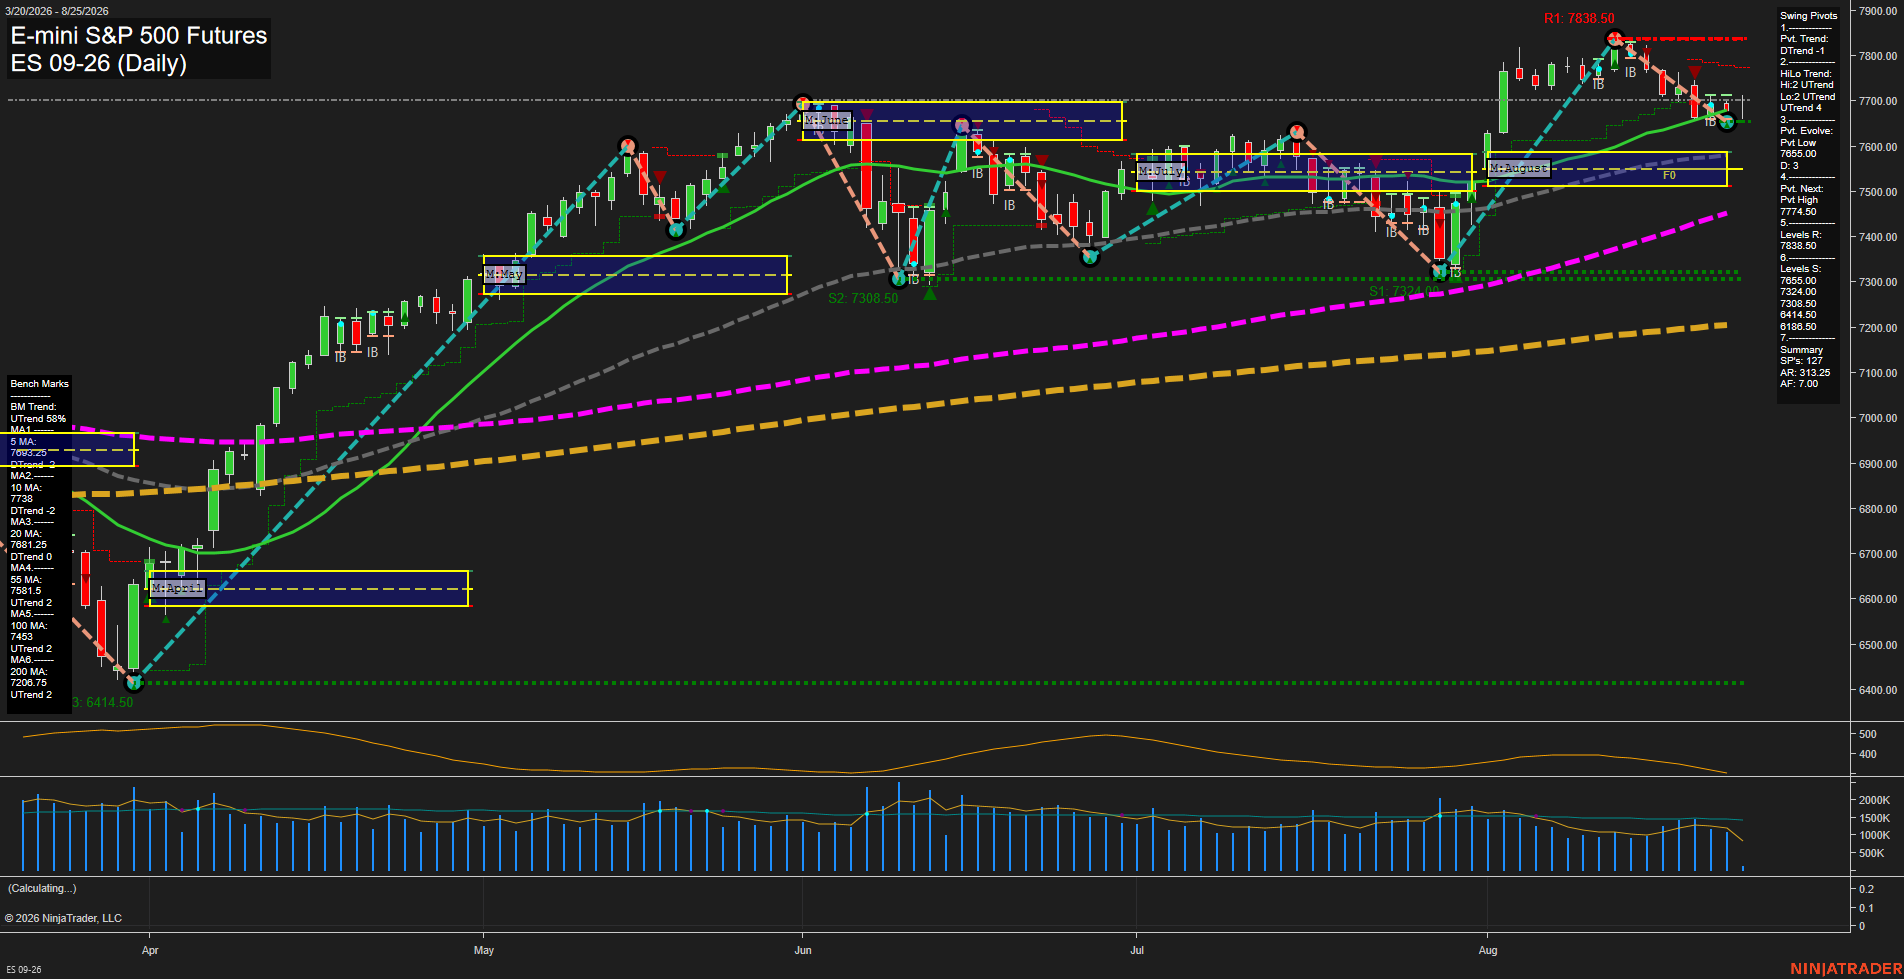
Overall Rating
- Short-Term: Bearish
- Intermediate-Term: Bullish
- Long-Term: Bullish.
Key Insights Summary
Price is consolidating after the August advance and remains above the weekly, monthly, and yearly F0% levels, preserving the broader rising structure. Short-term conditions have softened: the active pivot trend is down, price is below the 5-, 10-, and 20-day benchmarks, and recent short signals align with a pullback phase. The intermediate and long-term structure remains constructive because the HiLo pivot trend is up and price remains above the rising 55-, 100-, and 200-day benchmarks. The 7655.00 pivot low and 7635.00 support area define the nearby pullback zone, while 7747.50 is the next pivot reversal level and 7838.50 remains the major overhead swing resistance.
View charts on: AlphaWebTrader HTF Charts
NQ Daily View
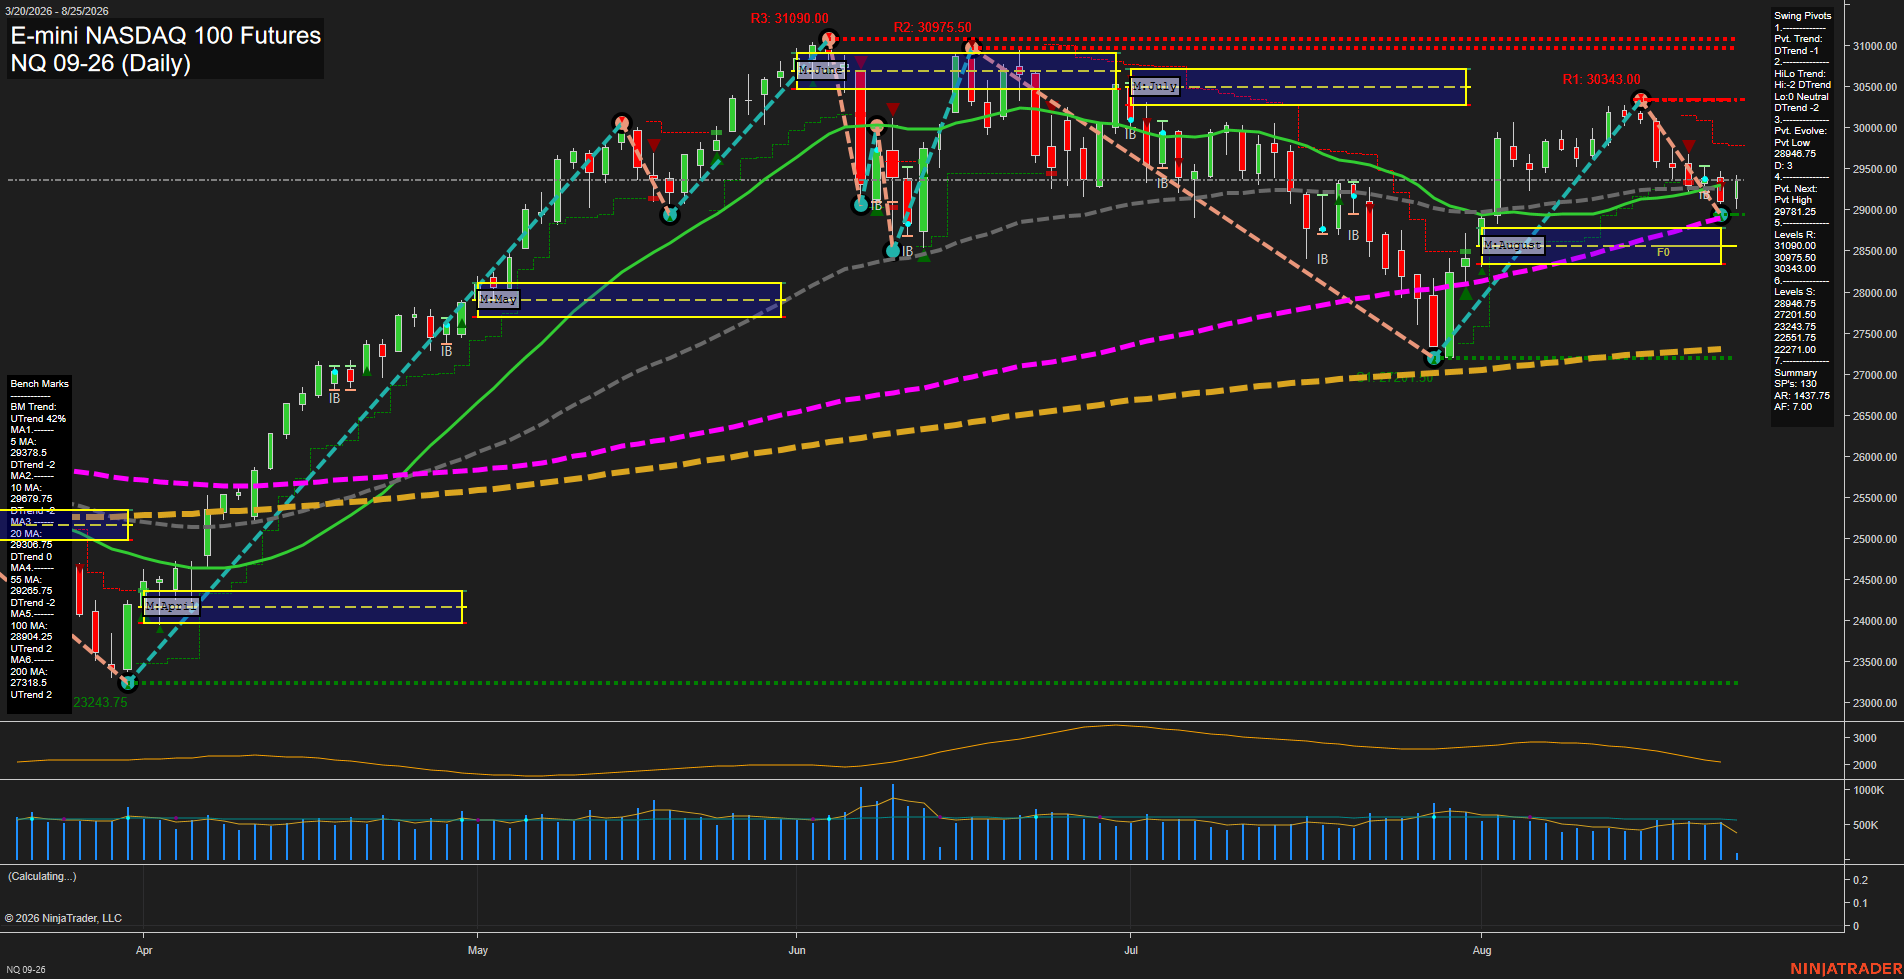
Overall Rating
- Short-Term: Bearish
- Intermediate-Term: Neutral
- Long-Term: Bullish.
Key Insights Summary
Price is consolidating near 29233.5 after a sharp August recovery from the 27201.50 swing low, but the rebound stalled beneath the 30343 resistance zone and has rolled into small, slow-momentum bars. Short-term structure remains bearish: price is below the weekly F0% level and below the declining 5-, 10-, 20-, and 55-day benchmarks, while the current pivot sequence remains a DTrend. Intermediate structure is mixed, with price still above the August monthly F0%/NTZ area but testing the 28946.75 pivot-low support region. The longer-term backdrop remains constructive because price holds above rising 100- and 200-day averages and remains well above the yearly grid midpoint. The chart reflects a countertrend pullback within the larger annual advance, with 30343 followed by 30975.50 and 31090 marking the overhead swing-resistance ladder.
View charts on: AlphaWebTrader HTF Charts
CL Daily View
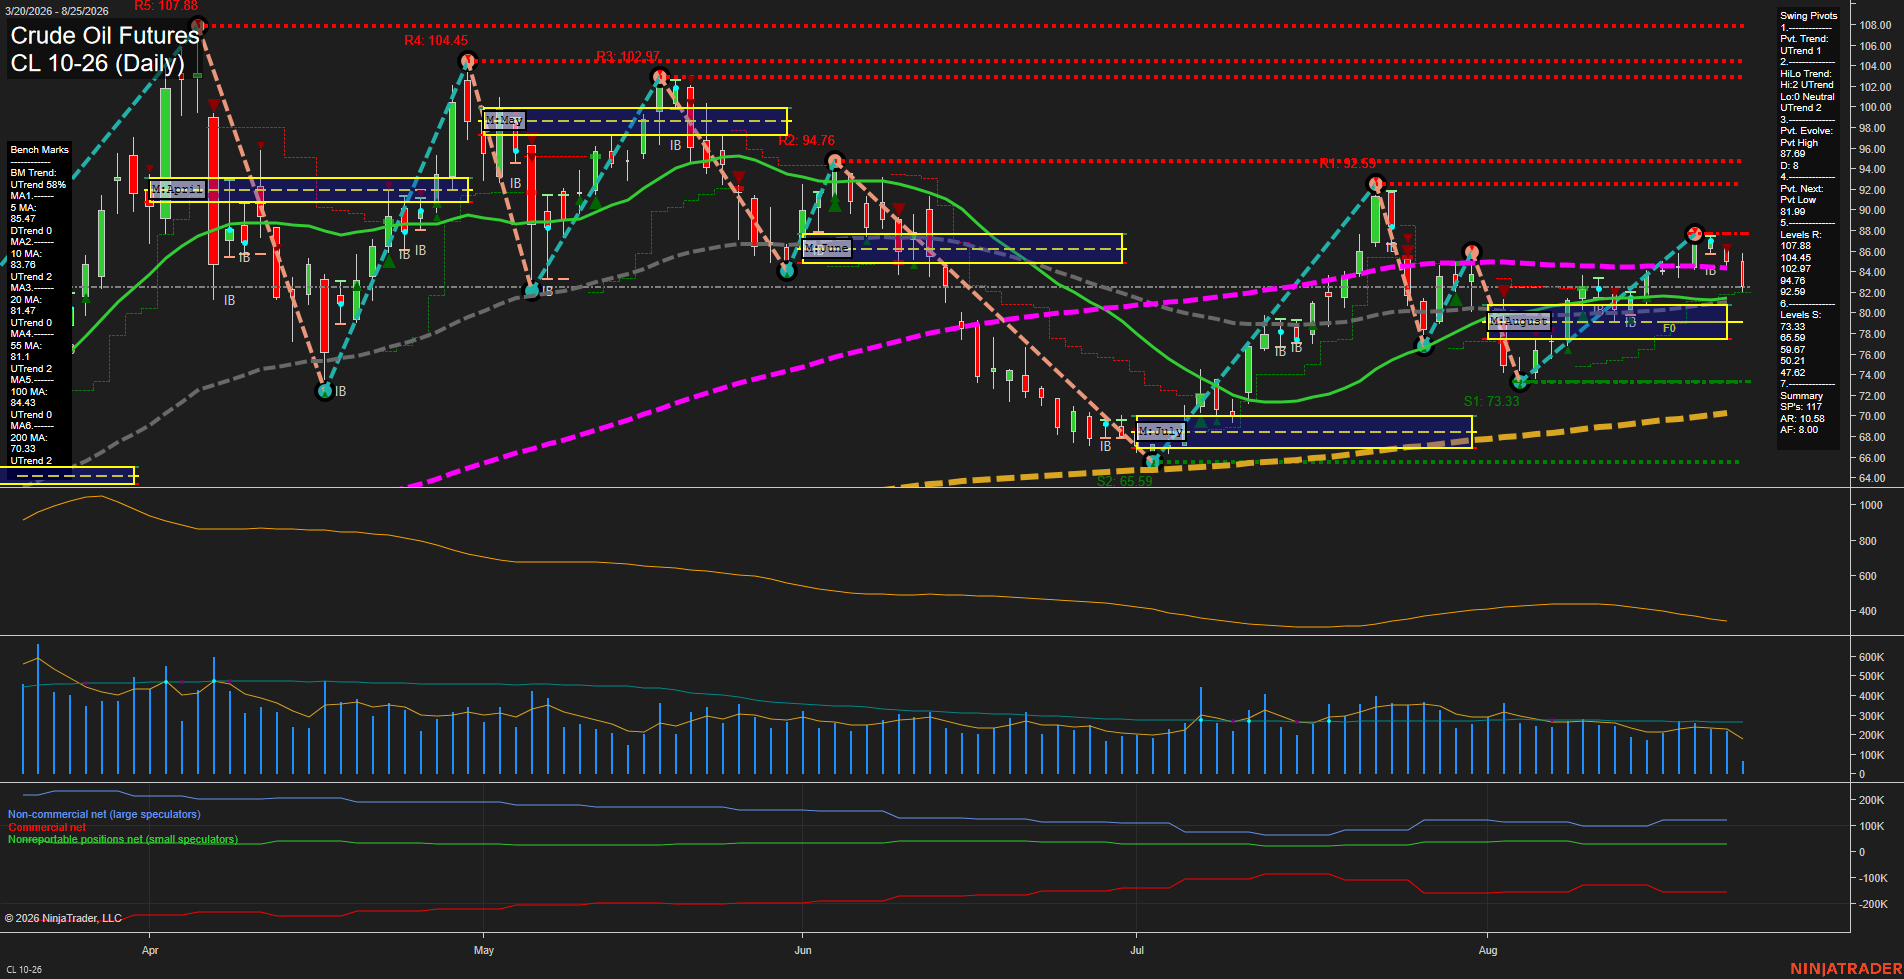
Overall Rating
- Short-Term: Bearish
- Intermediate-Term: Bullish
- Long-Term: Bullish.
Key Insights Summary
CL remains in an intermediate and long-term recovery structure, supported by rising 20, 55, 100, and 200 day benchmarks and UTrend readings in both pivot trend categories. Short-term conditions have softened following rejection beneath the 87.69 pivot-high resistance, with price below the declining 5 day average and below the weekly F0% grid. The recent candles reflect a pullback within the broader advance rather than a confirmed intermediate trend reversal. Price is consolidating above the 10, 20, and 55 day averages, while 81.99 marks the key opposite-pivot reference beneath the current range. Volume has moderated and ATR has contracted from earlier elevated levels, consistent with a choppier consolidation phase after the August rebound.
View charts on: AlphaWebTrader HTF Charts
GC Daily View
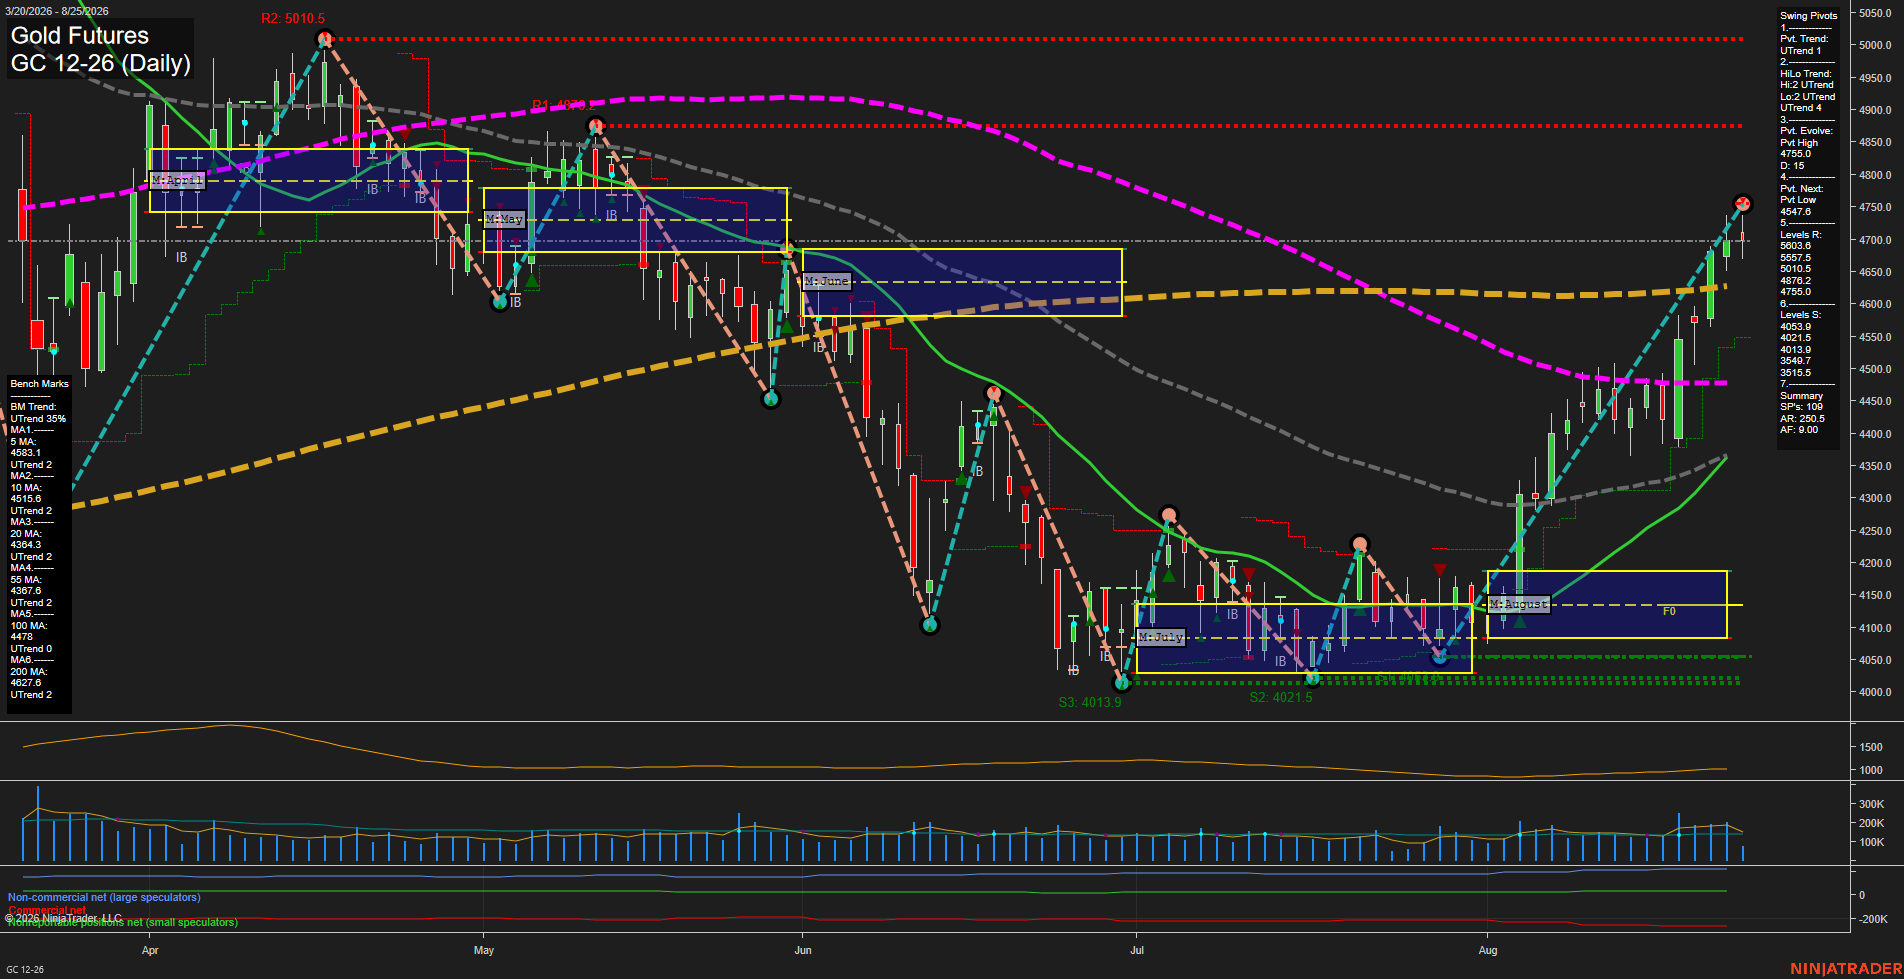
Overall Rating
- Short-Term: Bullish
- Intermediate-Term: Bullish
- Long-Term: Bullish.
Key Insights Summary
Price remains in a strong, fast upside swing following the August breakout from the 4100-area consolidation. The pivot structure is bullish across short- and intermediate-term measures, while price holds above all six rising daily benchmarks. The current pullback from the 4747.5 pivot high is occurring near the 4755 resistance zone, with 4676 identified as the next pivot-low reversal level. The monthly and weekly Fib grids remain positive, although the yearly grid remains below F0%, indicating that the broader recovery is still developing within the longer-term cycle.
View charts on: AlphaWebTrader HTF Charts