NYSE pre-market radar tracks mixed futures, ETF movers and key catalysts including Nvidia earnings, PCE inflation, Fed remarks and oil developments.
Fundamentals: U.S. index futures were mixed ahead of the NYSE pre-market session, with Nvidia earnings, Core PCE inflation and preliminary GDP data in focus. Oil prices declined after reported progress on Strait of Hormuz transit talks, though vessel traffic remained below normal levels. Fed communication, elevated equity valuations and long-bond positioning also remained key market cross-currents.
Technicals: Pre-market market radar shows mixed conditions across major futures contracts, with ES, NQ, EMD and RTY in short-term corrective phases while longer-term structures remain broadly constructive. YM and FDAX retain bullish alignment across key timeframes. Prior-session ETF movers included gains in NVDA, META and TLT, while USO posted the largest decline.
Pre-Market Trading 360° view Market Radar of: holidays, earnings, eco-news, market-news summary, news sentiment, prior session major ETFs, MAG7, Higher Time Frame Analysis Indices Futures Summary, and E-mini S&P500, Nasdaq 100, NYMEX Crude, Gold Futures Daily Chart analysis.
As of: August 26, 2026 07:16 CT
Earnings Radar
Monitoring for earnings releases by the Magnificent 7, AI-tech-related firms, and major financial institutions.
- CRM Release: 2026-08-26 T:AMC
- NVDA Release: 2026-08-26 T:AMC
Conclusion: Salesforce (CRM) and Nvidia (NVDA) report after the close on 2026-08-26, concentrating broad index-relevant earnings risk in the post-market session. NVDA places AI and semiconductor sentiment in focus, while CRM adds major enterprise-software exposure; market momentum and volume can slow ahead of these releases.
For full details visit: Yahoo Earnings Calendar
EcoNews Radar U.S. Events
| Day | Time | Impact | Event |
|---|---|---|---|
| Wed | 08:30 | High | Core PCE Price Index m/m |
| Wed | 08:30 | High | Prelim GDP q/q |
| Wed | 08:30 | Medium | Prelim GDP Price Index q/q |
| Wed | 10:30 | Low | Crude Oil Inventories |
| Thu | 08:30 | Medium | Unemployment Claims |
| Thu | 12:15 | Medium | Jackson Hole Symposium |
| Fri | 10:00 | High | Fed Chairman Warsh Speaks |
| Fri | 10:00 | High | Prelim Benchmark Payrolls Revision |
| Fri | 10:00 | Medium | Revised UoM Consumer Sentiment |
| Fri | 10:00 | Medium | Revised UoM Inflation Expectations |
| Fri | 12:15 | High | Jackson Hole Symposium |
| Sat | 12:15 | Medium | Jackson Hole Symposium |
EcoNews Summary
Wednesday features the week’s main U.S. data cluster, led by Core PCE inflation and preliminary GDP at 08:30. Friday centers on Federal Reserve communication, the preliminary benchmark payrolls revision, and the high-impact Jackson Hole Symposium session. Crude oil inventories provide the only qualifying medium-impact energy event.
Event Notes:
- Wednesday 08:30 – USD Core PCE Price Index m/m: The Federal Reserve’s preferred underlying inflation measure, excluding food and energy. Index futures traders monitor it for its influence on rate-policy expectations and broad equity-index pricing.
- Wednesday 08:30 – USD Prelim GDP q/q: An early estimate of U.S. economic growth for the quarter. It measures changes in inflation-adjusted output and informs views of economic momentum.
- Wednesday 10:30 – USD Crude Oil Inventories: Weekly change in U.S. commercial crude stockpiles. The report tracks petroleum supply conditions and affects crude prices, energy shares, and inflation-sensitive market segments.
- Friday 10:00 – USD Fed Chairman Warsh Speaks: Public remarks from the Federal Reserve Chairman. Traders monitor policy-related language, economic assessments, and inflation commentary for changes in rate-policy expectations.
- Friday 10:00 – USD Prelim Benchmark Payrolls Revision: Preliminary annual revision to payroll employment estimates. It updates the baseline level of reported employment and provides context on labor-market conditions.
- Friday 12:15 – All Jackson Hole Symposium: High-impact central-bank symposium session. Policymaker communication and economic-policy discussion receive close attention across global equity and rates markets.
Conclusion:
The single most important event is Wednesday’s 08:30 USD Core PCE Price Index m/m release. Market momentum and volume often slow ahead of major PCE and GDP events, with increased volatility at release time. Friday’s 10:00 Federal Reserve Chairman remarks and payrolls revision form a second major event window; news around the 10 AM time cycle acts as a catalyst for reversals or continuations. Crude inventory data also links petroleum supply conditions with energy prices; high oil prices directly affect markets through inflation and geopolitical concerns.
For full details visit: Forex Factory EcoNews
Market News Summary:
U.S. index futures were mixed as markets focused on Nvidia earnings, PCE inflation data, Fed communication, and Strait of Hormuz developments.
Primary Drivers & Risks:
- Primary Driver: Nvidia earnings and PCE data
- Primary Risk: Hormuz shipping disruption
Tone:
Neutral and event-driven, with lower oil easing some market pressure.
Stock Market / ETFs / Indices:
Chip stocks led Tuesday trading ahead of Nvidia’s earnings, viewed as a key test of AI-related data-center demand. The S&P 500 has risen 13% year-to-date and recorded 27 highs in 2026, while one economist said the market has used substantial capacity. Equity commentary cited resilient growth and earnings revisions but maintained a selective risk stance.
Geopolitical:
Iran and Oman reported progress toward an arrangement for safe Strait of Hormuz transit, while the U.S. emphasized economic pressure on Iran across gold, digital assets, aviation, shipping, and technology. Vessel traffic remained well below its 10-day average, and some refiners planned to avoid ships on Iran’s blacklist.
Oil / Energy:
WTI and Brent declined as Hormuz talks reduced immediate supply-disruption concerns, with Brent retreating to $85. Rising U.S. crude inventories added pressure, although constrained shipping traffic remained a supply-chain cross-current. CNOOC reported record first-half profit on higher oil prices and increased output.
Gold / Metals:
Gold slipped in Asian trading before Fed Chairman Kevin Warsh’s Jackson Hole comments and the PCE release. Lower Treasury yields supported gold and silver, while reduced Iran-risk concerns reshaped the metals backdrop.
Fed / Financials:
Markets were focused on Warsh’s inflation-policy comments at Jackson Hole and July PCE data. Bond-market attention included Bessent’s Treasury bond-buyback strategy and warnings that concentrated short positioning in long-term bonds creates unwind risk. Vanguard agreed to buy wealth-management platform Altruist for $4 billion.
Macro / Other:
Asian currencies consolidated against the dollar, with Middle East talks supporting broader risk appetite. Utility-scale solar and grid infrastructure activity reflected demand linked to data centers and grid upgrades, alongside labor, regulatory, and customer-concentration risks.
Conclusion:
Nvidia earnings, PCE inflation data, and Fed communication are the central near-term market catalysts. Falling oil prices following Hormuz talks have reduced one source of immediate market stress.
Strait shipping remains materially below normal levels despite diplomatic progress. Elevated equity valuations, AI-demand sensitivity, and bond-positioning risks remain important cross-currents.
Market News Sentiment
Market News Articles: 29
- Neutral: 44.83%
- Positive: 34.48%
- Negative: 20.69%
Sentiment Summary: Market news sentiment is 45% neutral, 34% positive, and 21% negative across 29 articles.
Conclusion: Coverage is predominantly neutral, with positive articles outnumbering negative articles.
GLD,Gold Articles: 12
- Positive: 41.67%
- Negative: 33.33%
- Neutral: 25.00%
Sentiment Summary: Gold-related coverage is mixed, with 42% positive, 33% negative, and 25% neutral across 12 articles.
Conclusion: The sentiment balance shows a modest positive tilt in gold news, without a dominant directional tone.
USO,Oil Articles: 10
- Negative: 50.00%
- Neutral: 30.00%
- Positive: 20.00%
Sentiment Summary: Oil-related coverage is predominantly negative at 50%, with 30% neutral and 20% positive.
Conclusion: The oil news tone is net negative, which may be a relevant cross-market sentiment input for indices futures day traders.
Market Data Snapshot
ETF Snapshot of major stock market ETFs, Mag7, and others as of: August 26, 2026 07:16
Top Movers & Losers
- NVDA 213.05 Bullish 2.19% ▲
- META 570.05 Bullish 1.97% ▲
- TLT 83.47 Bullish 1.10% ▲
- GOOG 343.34 Bearish -0.36% ▼
- AMZN 261.06 Bearish -0.39% ▼
- USO 126.15 Bearish -4.58% ▼
Major Index ETFs: SPY, QQQ, DIA, IWM, IJH
- QQQ 710.72 Bullish 0.62% ▲
- IWM 299.23 Bullish 0.42% ▲
- SPY 765.91 Bullish 0.32% ▲
- DIA 535.24 Bullish 0.30% ▲
- IJH 76.14 Bearish -0.08% ▼
Major index ETFs are Mixed: QQQ leads the Bullish move at +0.62%, followed by IWM at +0.42%, SPY at +0.32%, and DIA at +0.30%. IJH is the most Bearish mover but remains marginal at -0.08%.
Mag 7 Stocks: AAPL, MSFT, GOOG, AMZN, META, NVDA, TSLA
- NVDA 213.05 Bullish 2.19% ▲
- META 570.05 Bullish 1.97% ▲
- MSFT 491.71 Bullish 0.90% ▲
- TSLA 350.25 Bullish 0.37% ▲
- AAPL 309.90 Bearish -0.14% ▼
- GOOG 343.34 Bearish -0.36% ▼
- AMZN 261.06 Bearish -0.39% ▼
Mixed: NVDA is the most bullish mover at +2.19%, followed by META at +1.97%. MSFT gained +0.90% and TSLA added +0.37%, while AMZN is the most bearish mover at -0.39%, followed by GOOG at -0.36%. AAPL was marginally Bearish at -0.14%.
Cross-Market ETFs: TLT, GLD, USO, IBIT
- TLT 83.47 Bullish 1.10% ▲
- GLD 428.07 Bullish 0.32% ▲
- IBIT 44.72 Bullish 0.18% ▲
- USO 126.15 Bearish -4.58% ▼
Mixed cross-market snapshot: TLT is the most bullish mover at +1.10%, with GLD +0.32% and IBIT +0.18% also Bullish. USO is the most bearish mover at -4.58%, marking the clearest downside move.
ETF, Mag7, and Cross-Market ETF Insights
Overall Tone
Mixed: major equity ETFs are modestly Bullish, led by technology, while the sharp Bearish move in oil contrasts with firmer bonds, gold, and bitcoin.
Equity ETFs and Mag7:
Major Index ETFs are broadly but modestly Bullish: QQQ leads at +0.62%, followed by IWM at +0.42%, SPY at +0.32%, and DIA at +0.30%; IJH is marginally Bearish at -0.08%. Mag7 action is selective, with NVDA the most bullish mover at +2.19% and META up +1.97%, while AMZN is the most bearish mover at -0.39%, just below GOOG at -0.36%. AAPL is near-flat Bearish at -0.14%, while MSFT and TSLA remain modestly Bullish.
Cross-Market ETFs:
Cross-market ETFs are Mixed: TLT is the most bullish mover at +1.10%, with GLD up +0.32% and IBIT up +0.18%. USO is the most bearish mover at -4.58%, creating a pronounced divergence from the modestly Bullish equity, bond, gold, and bitcoin ETF moves.
Futures Indices – Higher Time Frame Analysis
Summary of the current state of US Indices Futures based on higher time-frame (HTF) technical analysis as of: 2026-08-26: 07:16 CT.
US Indices Futures
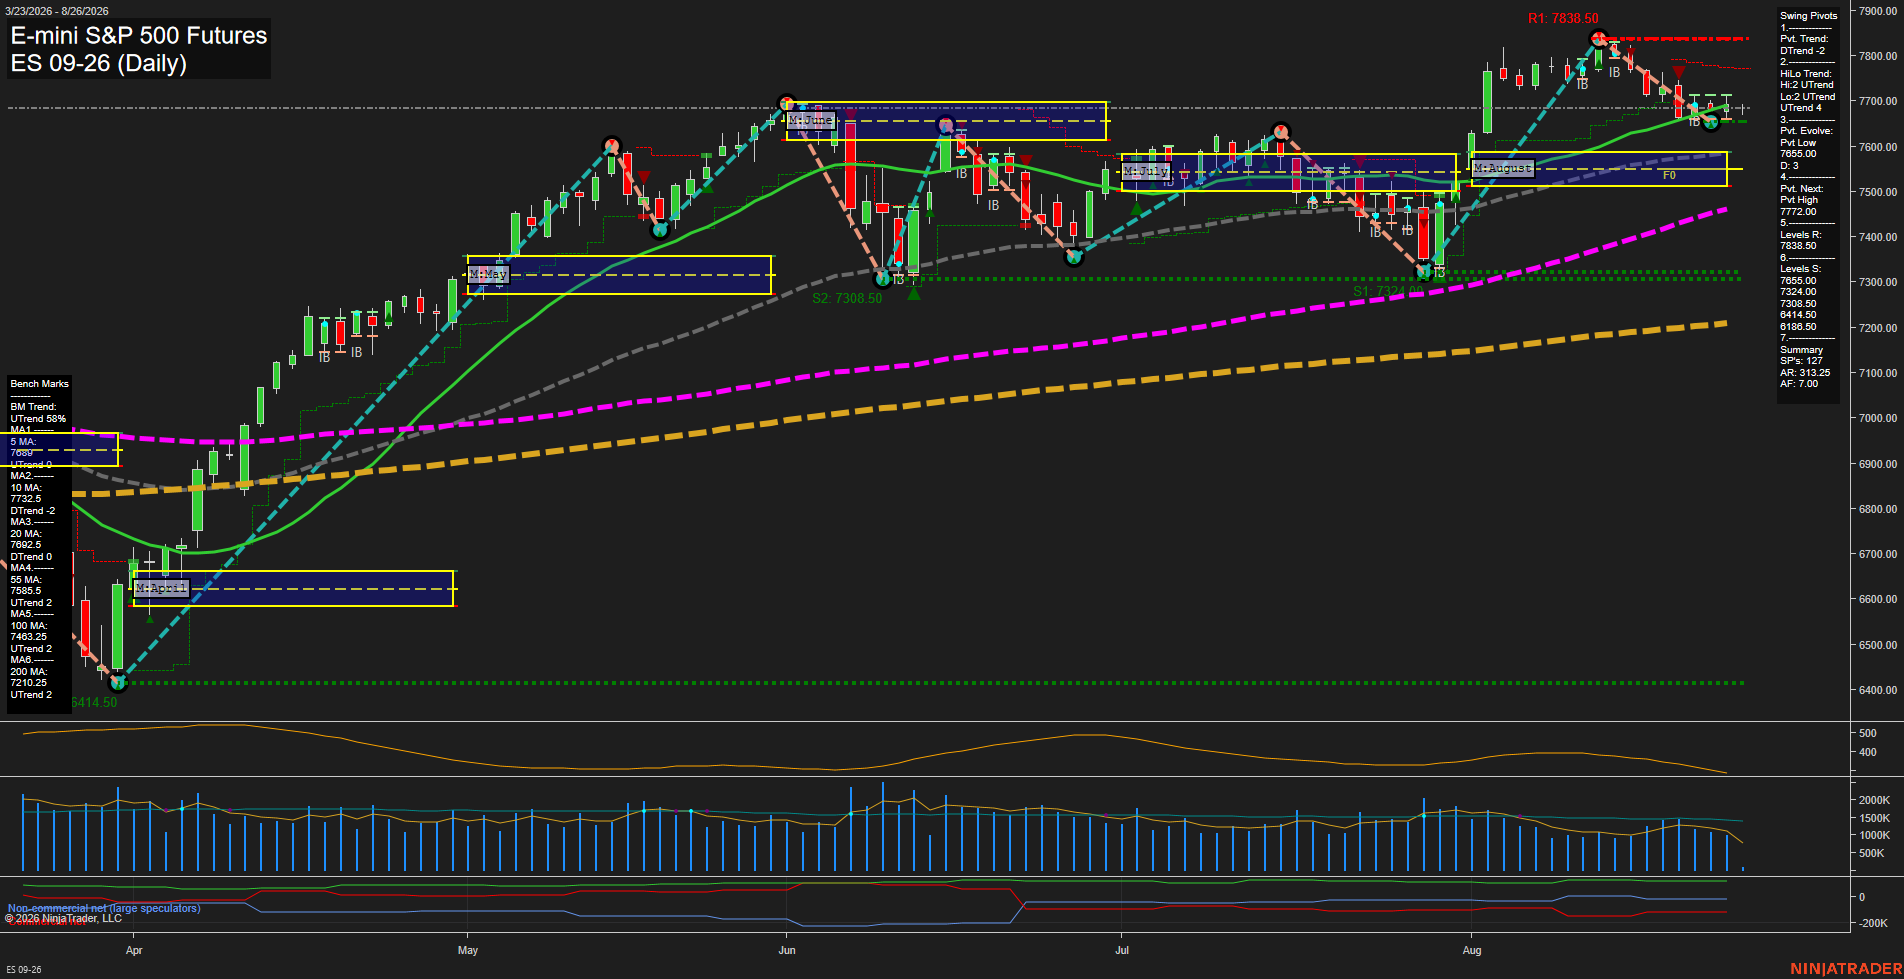
- ES: YSFG/MSFG up, WSFG down; above 55–200-day benchmarks, DTrend short-term; support 7665–7688, resistance 7772/7838.50.
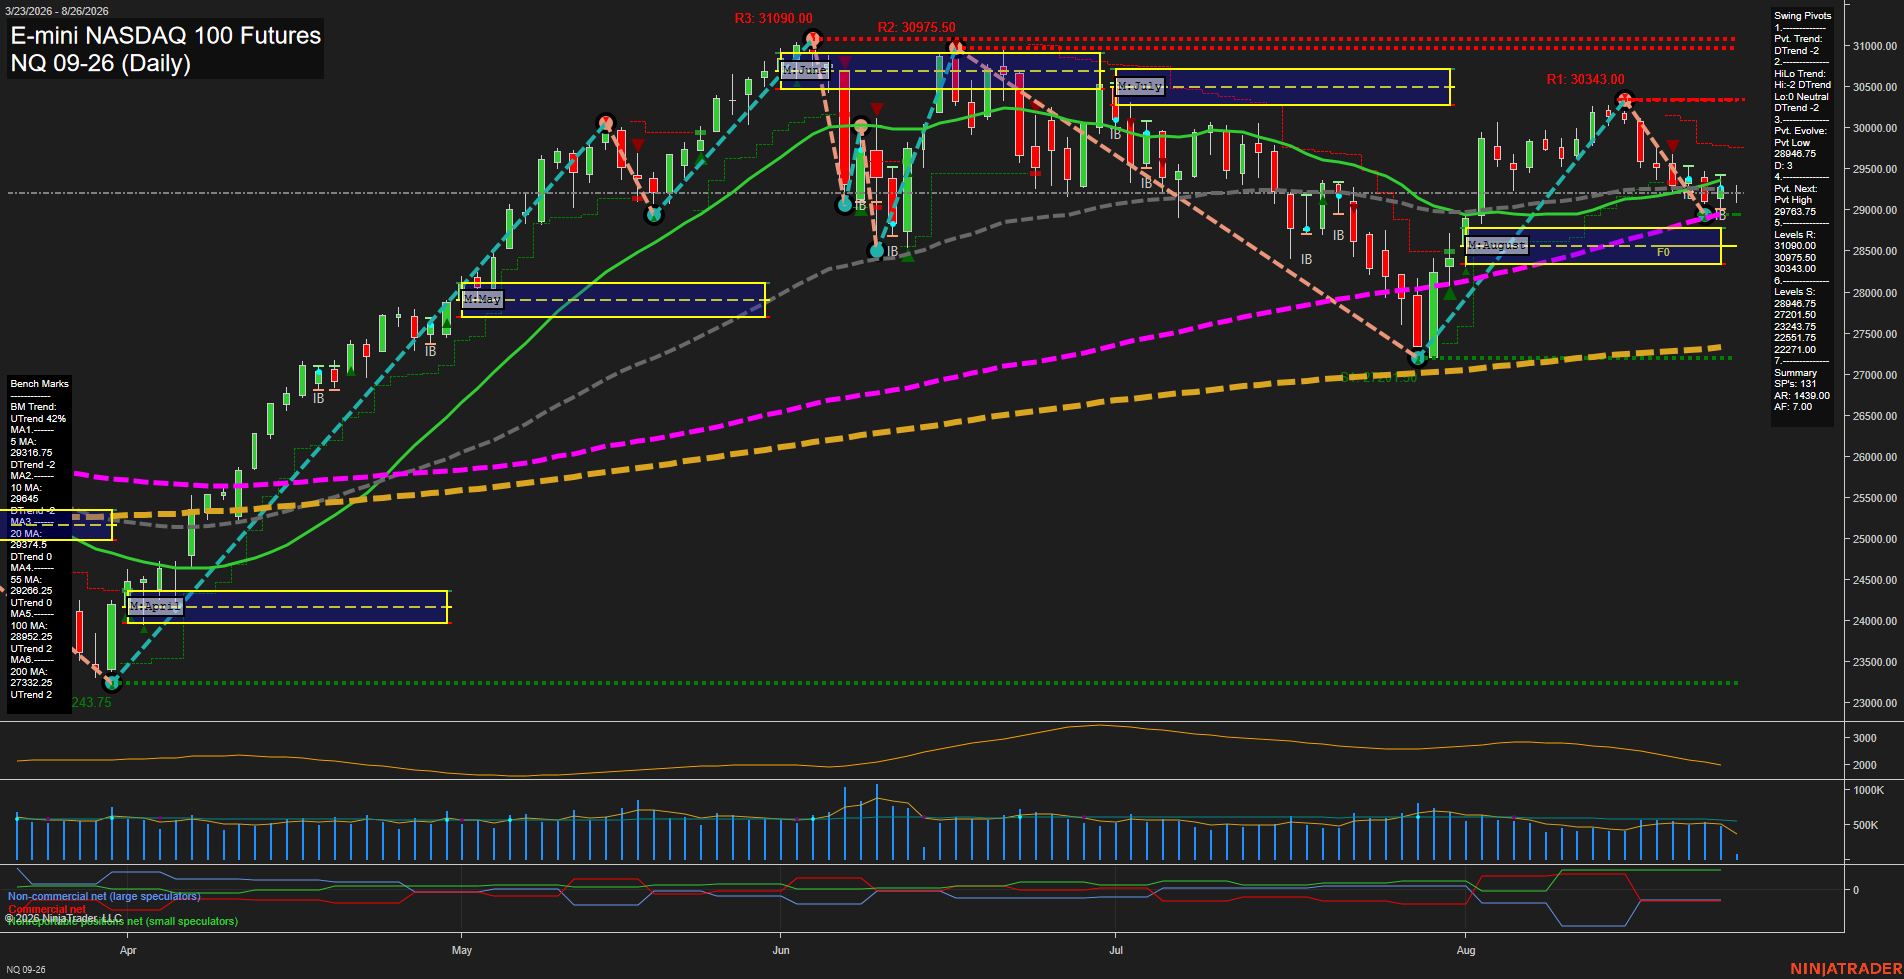
- NQ: YSFG/MSFG up, WSFG down; below short benchmarks, above major weekly averages; support 28946.75/27201.50, resistance 29367.50/30343.
- YM: YSFG/MSFG/WSFG above F0%; all benchmarks rising, UTrend pivots; support 52961/52812, resistance 53797/54384/54884.
- EMD: YSFG/MSFG up, WSFG below F0%; below 5–55-day benchmarks, above 100/200-day; support 3792.8/3730.5, resistance 3867.2/3941.7.
- RTY: YSFG/MSFG up, WSFG down below F0%; daily DTrend against rising 55–200-day benchmarks; support 2993.8, resistance 3058.0/3079.9.
- FDAX: YSFG/MSFG/WSFG above F0%; all benchmarks rising, higher-order UTrend; support 25965/25153, resistance 26389/26665.
Overall State
- Short-Term: Bearish
- Intermediate-Term: Bullish
- Long-Term: Bullish
Conclusion
ES, NQ, EMD, and RTY retain short-term corrective structures, led by declining WSFG conditions and daily DTrend readings. YM and FDAX maintain aligned bullish Fib grids, benchmarks, and pivots. Across the group, YSFG and MSFG trends remain upward, with intermediate and long-term benchmark alignment supporting the broader higher-high, higher-low structure. Key resistance remains concentrated near recent pivot highs, while listed pivot lows and benchmark clusters define structural support.
Note: Intra-day counter-trend pullbacks or retracements may occur, HTF is context for informational usage and market structure. Glossary: Session Fib Grids periods of YSFG:’Yearly’, MSFG:’Monthly’, WSFG:’Weekly’
For full details visit: AlphaWebTrader Technicals
ES Daily View
Overall Rating
- Short-Term: Bearish
- Intermediate-Term: Bullish
- Long-Term: Bullish.
Key Insights Summary
Price is consolidating near 7689 after a sharp August advance and retracement, with small daily bars and slowing momentum reflecting reduced directional participation. The short-term pivot structure remains in DTrend, price is below the weekly F0% area, and the 10-day and 20-day benchmarks are declining. Intermediate and long-term structure remains constructive: the HiLo pivot trend is UTrend, price remains above the rising 55-day, 100-day, and 200-day averages, and both monthly and yearly fib-grid bias remain above F0%. The 7665 to 7688 area is the immediate pivot-support zone, while 7772 and 7838.50 define the nearby pivot and major resistance sequence.
View charts on: AlphaWebTrader HTF Charts
NQ Daily View
Overall Rating
- Short-Term: Bearish
- Intermediate-Term: Neutral
- Long-Term: Bullish.
Key Insights Summary
Price is consolidating beneath the 5, 20, and 55 day benchmarks following the August rebound, while the short-term pivot structure remains in a DTrend. The 28946.75 pivot low and nearby 100 day average define the current support zone, whereas 29367.50 is the next pivot reversal level and 30343.00 is the principal overhead swing resistance. ATR and volume participation have moderated from earlier summer expansion, reflecting slower momentum and a compressed, choppy daily range. The monthly and yearly Fib structures remain positive, preserving the broader bullish trend backdrop despite the current short-term pullback.
View charts on: AlphaWebTrader HTF Charts
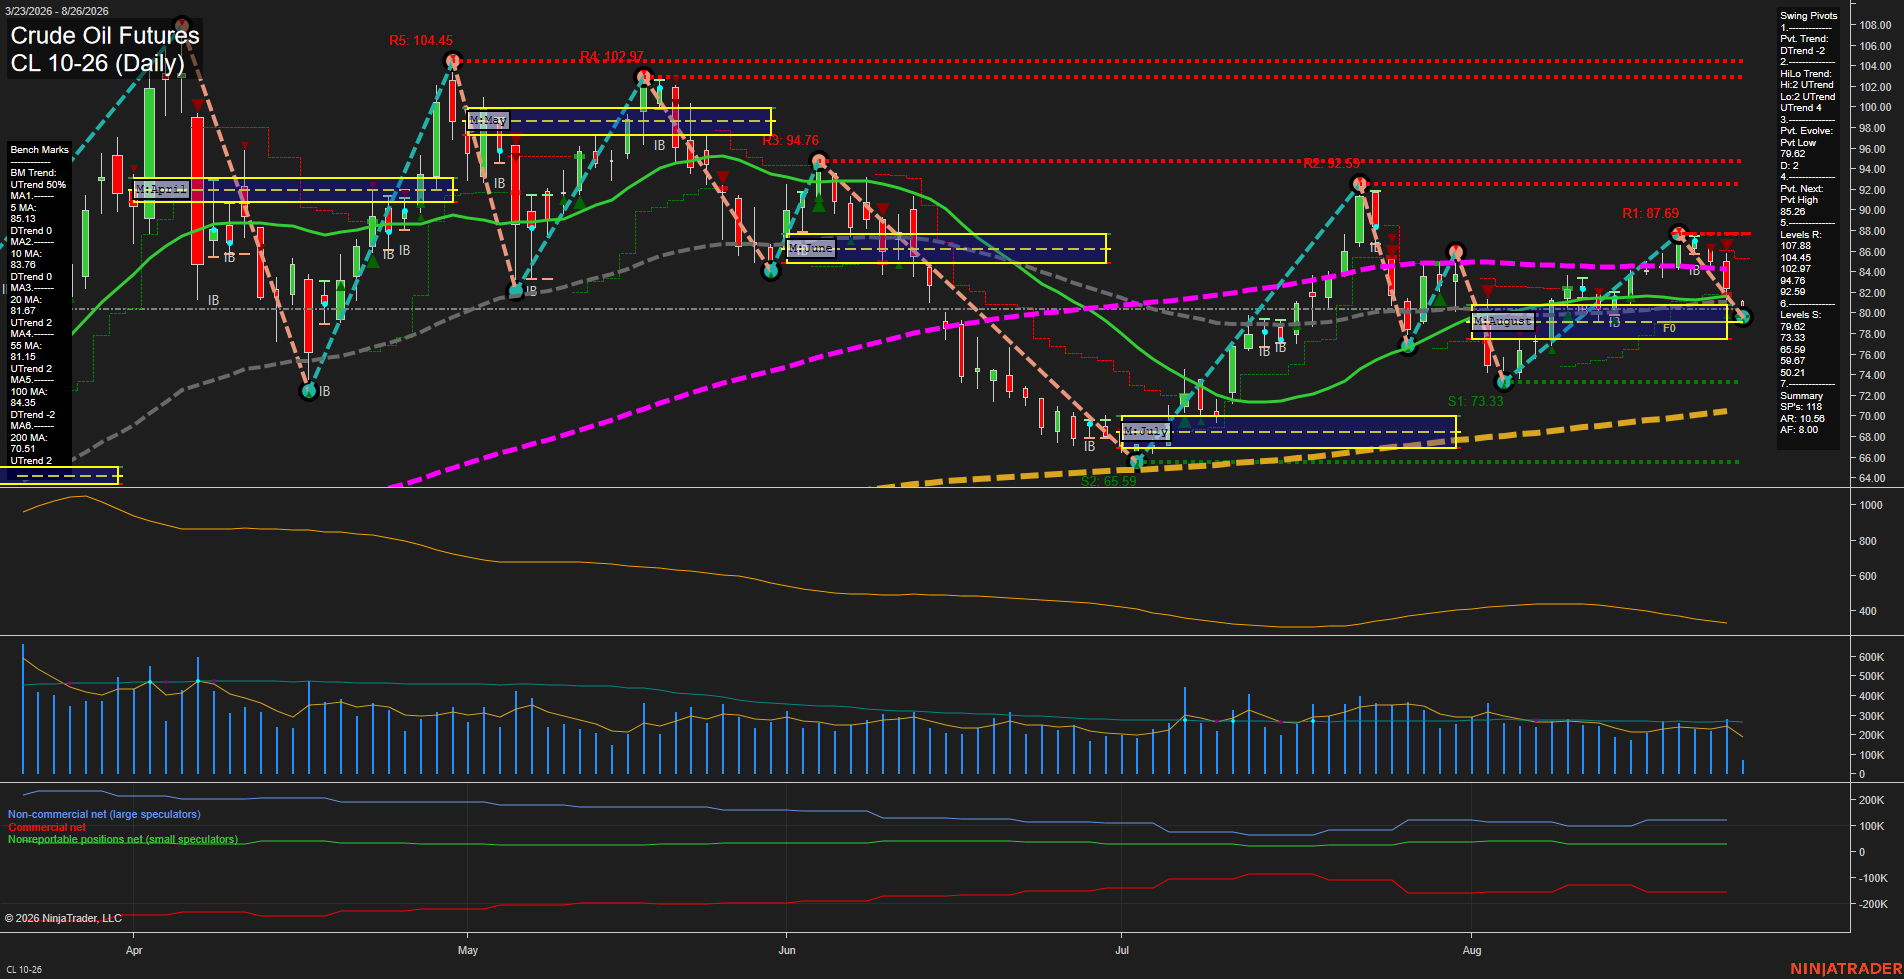
CL Daily View
Overall Rating
- Short-Term: Bearish
- Intermediate-Term: Neutral
- Long-Term: Bullish.
Key Insights Summary
CL has shifted into a fast short-term selloff, with a large decline to 79.62 completing a new pivot low and placing price below the 5, 10, 20, 55, and 100-day benchmarks. The weekly grid is decisively below F0%, confirming near-term downside pressure, while the 79.62 pivot-low area is the immediate support reference. The intermediate structure remains mixed: the monthly grid and HiLo pivot trend are still positive, but the current decline is a countertrend retracement below intermediate moving-average levels. The yearly grid and rising 200-day benchmark preserve the longer-term recovery structure, although the 100-day average remains in a down trend. Overhead pivot resistance is concentrated at 87.69, then 92.59 and 94.76, while a break beneath the current low would expose 73.33 as the next major support zone.
View charts on: AlphaWebTrader HTF Charts
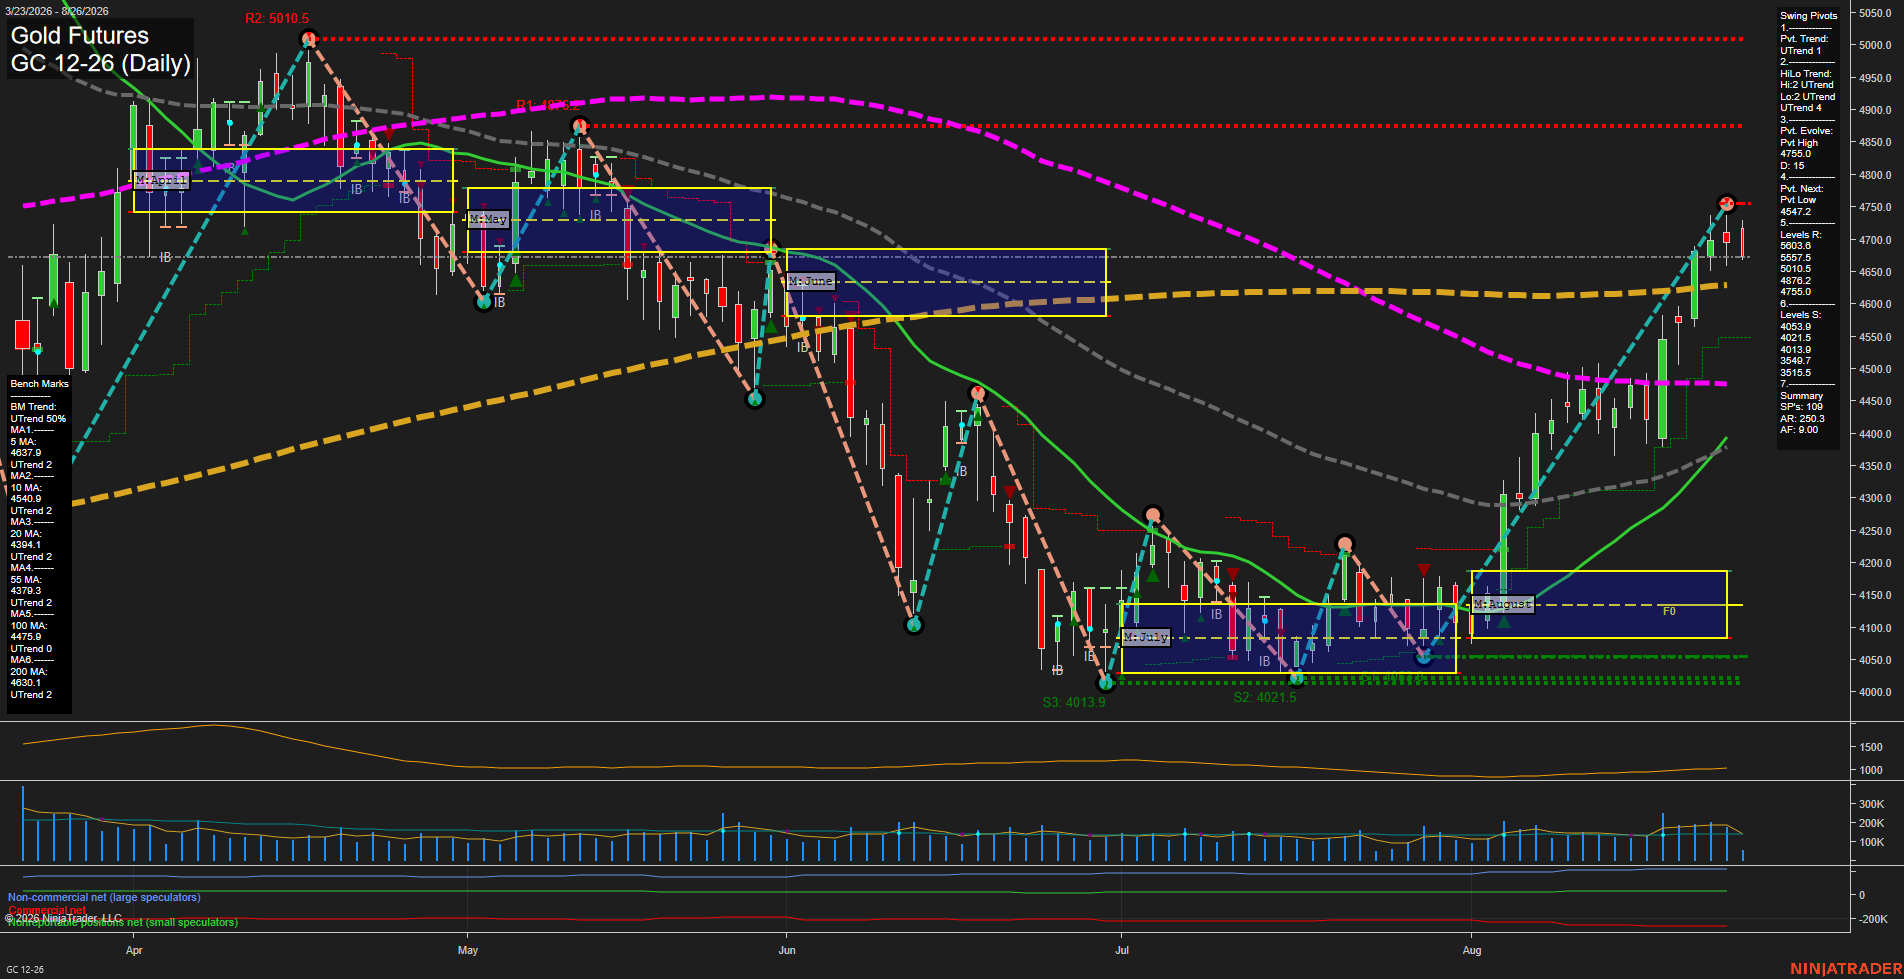
GC Daily View
Overall Rating
- Short-Term: Bullish
- Intermediate-Term: Bullish
- Long-Term: Bullish.
Key Insights Summary
Gold remains in a strong swing advance following the August breakout from the monthly grid near 4100-4170. Price is above all daily benchmarks, while both the short-term pivot trend and intermediate HiLo trend remain positive. The rally has reached the active 4755 pivot-high resistance area and is consolidating just beneath it with smaller bars after a fast directional move. The 4547.2 pivot-low reversal level defines the current short-term structural boundary, while the 4630-4638 area clusters the 200-day and 5-day benchmarks beneath price. The broader benchmark alignment is constructive, although the yearly fib-grid reading remains below F0%, leaving the longer-cycle backdrop in recovery rather than fully aligned with the current daily uptrend.
View charts on: AlphaWebTrader HTF Charts