NYSE pre-market radar tracks ETF movers and futures as Nvidia optimism supports equities while inflation, yields and Hormuz risks temper sentiment.
Fundamentals: U.S. equity futures moved higher after Nvidia results and durable-goods strength reinforced AI-related optimism. Investors remained focused on sticky PCE inflation, elevated long-dated Treasury yields and hawkish Fed commentary. Oil declined on Strait of Hormuz diplomacy, though tanker-security incidents and tight diesel inventories preserved energy-market uncertainty.
Technicals: Prior-session ETF leaders included AAPL, META and USO, while TSLA, GLD and NVDA declined. Futures analysis shows broadly bullish intermediate- and long-term structures across major equity indices, though daily conditions are mixed as ES and NQ consolidate, EMD and RTY remain in short-term pullbacks, and FDAX extends toward prior resistance.
Pre-Market Trading 360° view Market Radar of: holidays, earnings, eco-news, market-news summary, news sentiment, prior session major ETFs, MAG7, Higher Time Frame Analysis Indices Futures Summary, and E-mini S&P500, Nasdaq 100, NYMEX Crude, Gold Futures Daily Chart analysis.
As of: August 27, 2026 07:16 CT
EcoNews Radar U.S. Events
| Day | Time | Impact | Event |
|---|---|---|---|
| Thu | 08:30 | Medium | Unemployment Claims |
| Thu | 12:15 | Medium | Jackson Hole Symposium |
| Fri | 10:00 | High | Fed Chairman Warsh Speaks |
| Fri | 10:00 | High | Prelim Benchmark Payrolls Revision |
| Fri | 10:00 | Medium | Revised UoM Consumer Sentiment |
| Fri | 10:00 | Medium | Revised UoM Inflation Expectations |
| Fri | 12:15 | High | Jackson Hole Symposium |
| Sat | 12:15 | Medium | Jackson Hole Symposium |
EcoNews Summary
Friday contains the week’s listed high-impact U.S. events, concentrated at 10:00, followed by a high-impact Jackson Hole Symposium session at 12:15. This timing concentrates policy communication and labor-market benchmark data into a narrow window, placing focus on index-futures reaction around the 10 AM time cycle.
Event Notes:
- Friday 10:00 – Fed Chairman Warsh Speaks: Remarks from the Federal Reserve Chair provide direct insight into monetary-policy views, inflation assessment, and economic conditions. Traders monitor the language for changes in perceived policy direction.
- Friday 10:00 – Prelim Benchmark Payrolls Revision: A preliminary revision to prior payroll estimates based on more complete employment records. It measures whether the reported employment level has been overstated or understated and informs assessment of labor-market conditions.
- Friday 12:15 – Jackson Hole Symposium: A high-impact policy symposium featuring central-bank and economic-policy discussion. Traders monitor official remarks for monetary-policy and macroeconomic signals.
Conclusion:
The single most important listed event is Friday at 10:00, Fed Chairman Warsh Speaks. Friday’s simultaneous high-impact payroll benchmark revision and the 12:15 Jackson Hole Symposium session add to the day’s policy and labor-market focus. News events around the 10 AM time cycle act as catalysts for reversals or continuations.
For full details visit: Forex Factory EcoNews
Market News Summary:
Equity futures firmed on AI enthusiasm and Nvidia results, while inflation, bond yields, and Hormuz disruptions remained key cross-currents.
Primary Drivers & Risks:
- Primary Driver: Nvidia results and AI demand
- Primary Risk: Sticky inflation and elevated yields
Tone:
Constructive for equities, tempered by policy and geopolitical risks.
Stock Market / ETFs / Indices:
U.S. stock futures trended higher early Thursday following Nvidia earnings, strong durable-goods data, and renewed Middle East diplomacy. Japanese equities rose 0.7%, led by chip shares, while the Nasdaq’s 50-day moving average was identified as a near-term technical focus. AI capital spending remained a central theme across semiconductors, networking, memory, grid infrastructure, and power equipment.
Geopolitical:
Diplomatic efforts involving Iran and Qatar supported hopes of reopening the Strait of Hormuz. A tanker fire after an unidentified projectile strike and reports questioning mine-clearance claims underscored continued security risks in the waterway. The six-month Middle East conflict has disrupted global energy supplies and affected financial markets.
Oil / Energy:
WTI and Brent extended losses as Hormuz talks eased immediate supply concerns. Oil remained range-bound amid slowly recovering flows, low volumes through the strait, and tight diesel inventories. Additional South Sudan crude entered marine-fuel blending as Chinese refining demand eased.
Gold / Metals:
Gold rose in Asian trading as dollar-debasement demand attracted buyers, although sticky PCE inflation kept Fed-policy risk in focus. Copper reached a fresh record, with strong hard-asset interest alongside AI demand, bond-market concerns, and tariff threats.
Fed / Financials:
PCE inflation showed a 3.7% annual increase, leaving markets focused on the Fed’s policy path. Kansas City Fed President Jeff Schmid cited demand pressures and said policy might be accommodative rather than restrictive, raising the prospect of a September rate increase. Long-dated Treasury yields remained a source of concern, with bond yields described as a more relevant risk gauge than traditional volatility measures.
Macro / Other:
The Bank of Korea raised its policy rate 25 basis points to 3% as core inflation remained elevated. AI was cited as supporting a significant share of economic growth, while productivity gains had not yet clearly appeared.
Conclusion:
AI spending and Nvidia-related sentiment supported equity futures and chip shares. Durable-goods strength added to the constructive equity backdrop.
Sticky inflation, higher long-term yields, and hawkish Fed commentary constrained the broader risk environment. Hormuz negotiations pressured oil prices, while tanker-security incidents and tight diesel supplies maintained energy-market uncertainty.
Market News Sentiment
Market News Articles: 19
- Positive: 47.37%
- Neutral: 42.11%
- Negative: 10.53%
Sentiment Summary: Market news sentiment is moderately positive, with 47% positive, 42% neutral, and 11% negative coverage across 19 articles.
Conclusion: Indices futures headlines show a positive-to-neutral tone, with negative coverage representing a smaller share of reported news.
GLD,Gold Articles: 4
- Positive: 50.00%
- Negative: 50.00%
Sentiment Summary: GLD and gold coverage is evenly split, with 50% positive and 50% negative articles across 4 articles.
Conclusion: Gold-related news tone is neutral overall, providing no clear directional sentiment signal for indices futures day traders.
USO,Oil Articles: 7
- Negative: 42.86%
- Neutral: 42.86%
- Positive: 14.29%
Sentiment Summary: USO/Oil coverage is 43% negative, 43% neutral, and 14% positive across 7 articles, indicating predominantly neutral-to-negative tone.
Conclusion: Oil-related news sentiment provides a mildly negative but largely balanced backdrop for indices futures day traders.
Market Data Snapshot
ETF Snapshot of major stock market ETFs, Mag7, and others as of: August 27, 2026 07:16
Top Movers & Losers
- AAPL 313.45 Bullish 1.15% ▲
- META 576.14 Bullish 1.07% ▲
- USO 127.35 Bullish 0.95% ▲
- TSLA 345.82 Bearish -1.26% ▼
- GLD 421.32 Bearish -1.58% ▼
- NVDA 209.66 Bearish -1.59% ▼
Major Index ETFs: SPY, QQQ, DIA, IWM, IJH
- IJH 76.62 Bullish 0.63% ▲
- QQQ 711.37 Bullish 0.09% ▲
- SPY 766.08 Bullish 0.02% ▲
- IWM 298.93 Bearish -0.10% ▼
- DIA 534.23 Bearish -0.19% ▼
Mixed major-index ETF action: IJH is the most bullish mover at +0.63%, while DIA is the most bearish mover at -0.19%. QQQ +0.09% and SPY +0.02% are marginally Bullish, while IWM -0.10% is near-flat Bearish.
Mag 7 Stocks: AAPL, MSFT, GOOG, AMZN, META, NVDA, TSLA
- AAPL 313.45 Bullish 1.15% ▲
- META 576.14 Bullish 1.07% ▲
- MSFT 496.37 Bullish 0.95% ▲
- AMZN 260.28 Bearish -0.30% ▼
- GOOG 339.10 Bearish -1.23% ▼
- TSLA 345.82 Bearish -1.26% ▼
- NVDA 209.66 Bearish -1.59% ▼
Mixed Mag7 snapshot: AAPL is the most bullish mover at +1.15%, followed by META at +1.07% and MSFT at +0.95%. NVDA is the most bearish mover at -1.59%, with TSLA at -1.26% and GOOG at -1.23%; AMZN is modestly Bearish at -0.30%.
Cross-Market ETFs: TLT, GLD, USO, IBIT
- USO 127.35 Bullish 0.95% ▲
- TLT 83.30 Bearish -0.20% ▼
- IBIT 44.46 Bearish -0.58% ▼
- GLD 421.32 Bearish -1.58% ▼
Mixed: USO is the most bullish mover at +0.95%, while GLD is the most bearish mover at -1.58%. IBIT is Bearish at -0.58%, and TLT is marginally Bearish at -0.20%.
ETF, Mag7, and Cross-Market ETF Insights
Overall Tone
Mixed conditions: major equity ETFs are marginal to mixed, while Mag7 and cross-market performance show notable dispersion.
Equity ETFs and Mag7:
Major Index ETFs are mixed and near-flat, with IJH the most bullish index ETF at +0.63%, while DIA is the most bearish at -0.19%; SPY at +0.02% and QQQ at +0.09% are marginally positive, while IWM is marginally bearish at -0.10%. Mag7 performance is selective: AAPL leads at +1.15%, followed by META at +1.07% and MSFT at +0.95%. NVDA is the most bearish Mag7 mover at -1.59%, with TSLA at -1.26% and GOOG at -1.23%, signaling uneven large-cap technology participation.
Cross-Market ETFs:
Cross-market ETFs are mixed, led by USO at +0.95%, while GLD is the most bearish mover at -1.58%. TLT is modestly bearish at -0.20% and IBIT is bearish at -0.58%, contrasting with USO strength and marginally positive broad equity benchmarks. The divergence between oil strength and declines in gold, Treasuries, and bitcoin remains mixed.
Futures Indices – Higher Time Frame Analysis
Summary of the current state of US Indices Futures based on higher time-frame (HTF) technical analysis as of: 2026-08-27: 07:16 CT.
US Indices Futures
- ES YSFG/MSFG/WSFG up, benchmarks aligned higher, daily pullback; 7838.50 resistance, 7665.00/7634.00 support, 7700.00 pivot threshold.
- NQ YSFG/MSFG/WSFG above F0%, benchmarks rising; 30343.00 resistance, 31090.00 overhead, 28946.75 support, 29763.75 pivot threshold.
- YM YSFG/MSFG/WSFG rising, benchmarks aligned, UTrend recovery; 54884 resistance, 53811 pivot, 52975-52812 and 52456 support.
- EMD MSFG/YSFG rising, WSFG pullback, benchmarks broadly higher; 3941.7 resistance, 3900.5 overhead, 3804.7/3792.4 support, 3868.2 reversal threshold.
- RTY MSFG/YSFG up, WSFG downturn, benchmarks rising; 3079.9 resistance, 3057.4 pivot threshold, 2993.5 support, 2926.0/2887.3 lower support.
- FDAX YSFG/MSFG/WSFG aligned higher, all benchmarks rising; 26665 resistance, 26513 nearby resistance, 26095 support, 25149 reversal reference.
Overall State
- Short-Term: Neutral
- Intermediate-Term: Bullish
- Long-Term: Bullish
Conclusion
HTF alignment remains bullish across all contracts through rising YSFG and MSFG positions and broadly rising benchmark averages. ES, NQ, YM, and FDAX retain stronger short-term structure, while EMD and RTY remain in corrective daily pivot phases. ES, NQ, YM, RTY, and FDAX are testing or consolidating beneath major swing-high resistance; EMD holds below its weekly grid center. Support and pivot thresholds define the current retracement structure.
Note: Intra-day counter-trend pullbacks or retracements may occur, HTF is context for informational usage and market structure. Glossary: Session Fib Grids periods of YSFG:’Yearly’, MSFG:’Monthly’, WSFG:’Weekly’
For full details visit: AlphaWebTrader Technicals
ES Daily View
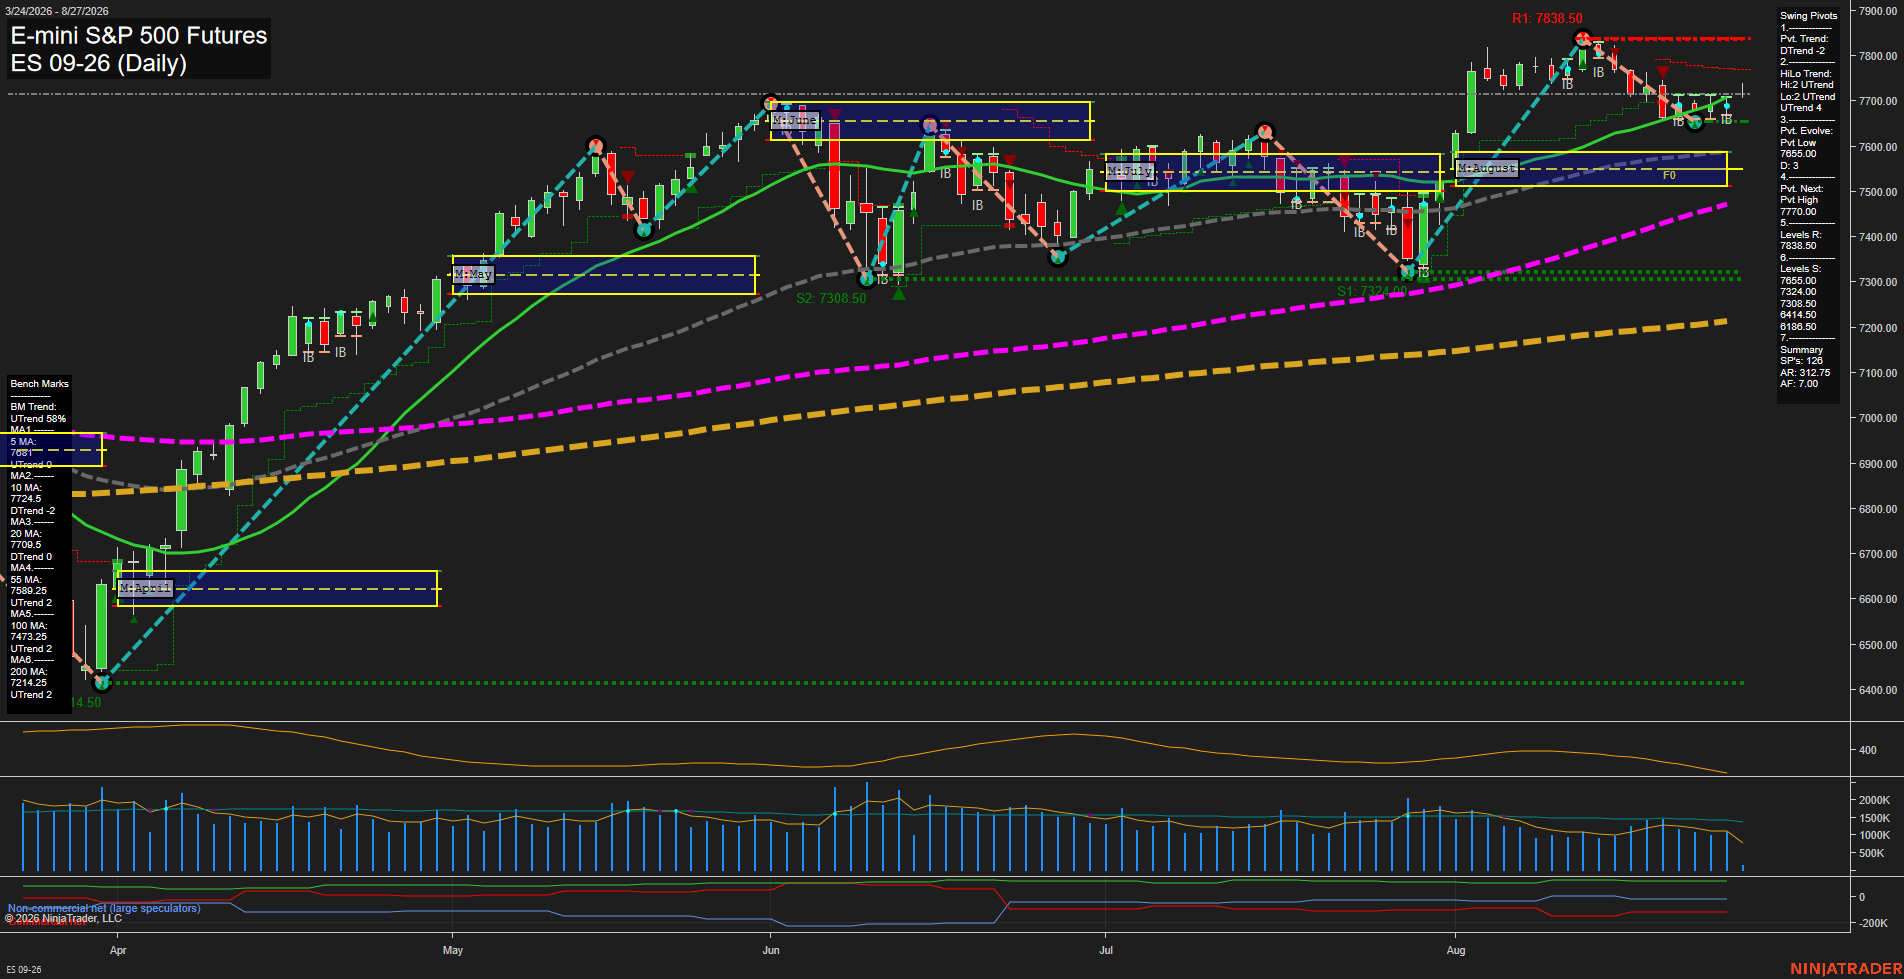
Overall Rating
- Short-Term: Neutral
- Intermediate-Term: Bullish
- Long-Term: Bullish.
Key Insights Summary
The daily structure remains bullish across the intermediate and long-term horizons, with price holding above the rising 55, 100, and 200-day benchmarks and remaining above the monthly and yearly F0% zones. Short-term action is mixed: the pivot trend is down and the 10 and 20-day averages are declining, reflecting a pullback from the 7838.50 swing-high resistance area. The 7665.00 developing pivot low and clustered 7634.00 support identify the near-term retracement structure, while a recovery through the 7700.00 pivot threshold would indicate renewed upside swing evolution. Volume and ATR have moderated versus earlier expansion phases, consistent with consolidation following the August rally rather than a broad intermediate-trend reversal.
View charts on: AlphaWebTrader HTF Charts
NQ Daily View
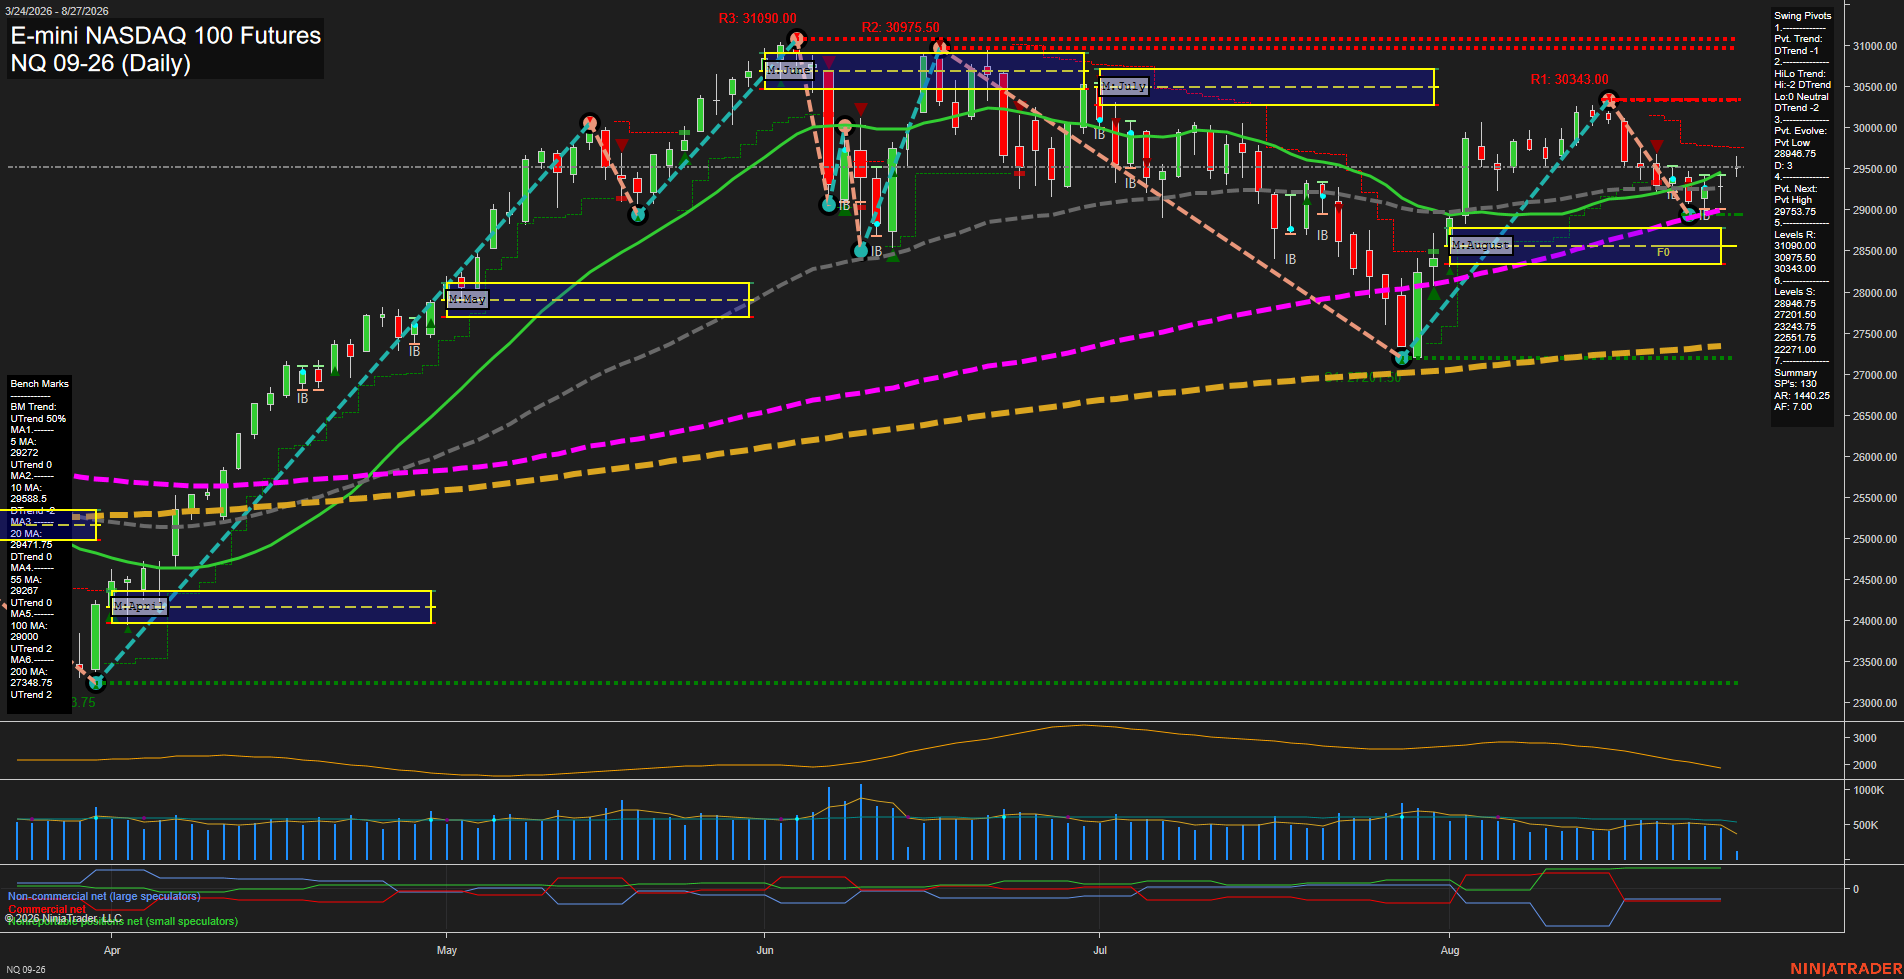
Overall Rating
- Short-Term: Neutral
- Intermediate-Term: Bullish
- Long-Term: Bullish.
Key Insights Summary
Price is holding above the weekly and monthly F0% areas and remains above the rising 55-, 100-, and 200-day benchmarks, preserving the broader recovery structure from the early-August low. Short-term swing pivots remain in DTrend/LoLo status following rejection from the 30343 resistance area, while the developing pivot low at 28946.75 defines the nearby structural floor. The 20-day average remains in a down trend and price is consolidating around the 5- and 10-day benchmarks, reflecting a choppy short-term retracement within a still-positive intermediate and long-term trend. A sustained move through 29763.75 would improve the immediate pivot structure, while 30343.00 remains the principal overhead swing resistance.
View charts on: AlphaWebTrader HTF Charts
CL Daily View
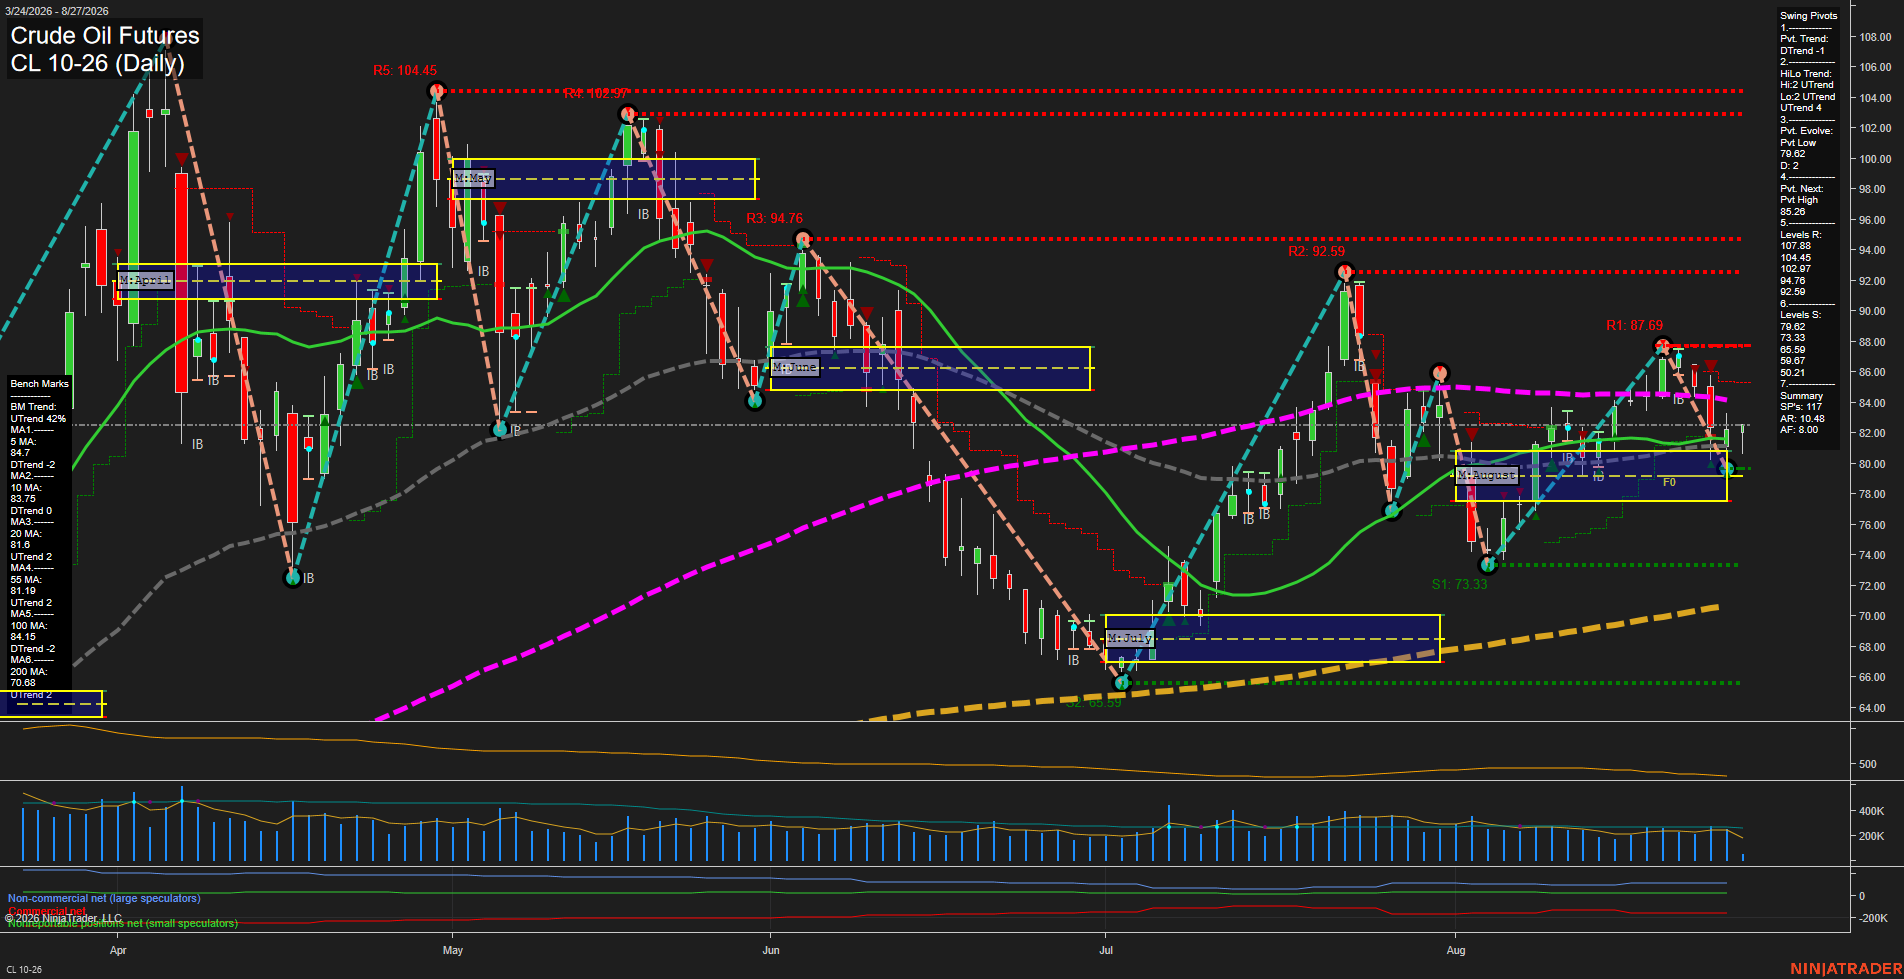
Overall Rating
- Short-Term: Bearish
- Intermediate-Term: Bullish
- Long-Term: Bullish.
Key Insights Summary
Price is consolidating near 80.48 after a sharp rejection from the 87.69 swing high and is trading below the weekly F0% level, with the short-term pivot structure and both 5- and 10-day benchmarks still down. The recent small bars show slowing downside momentum around the 79.62 pivot-low support area. Intermediate structure remains constructive: price holds above the August monthly F0% region, the HiLo trend is up, and the 20- and 55-day averages retain upward trends. The broader yearly structure remains positive above the rising 200-day benchmark, although the declining 100-day average and 85.26 pivot-high reversal level define overhead recovery pressure.
View charts on: AlphaWebTrader HTF Charts
GC Daily View
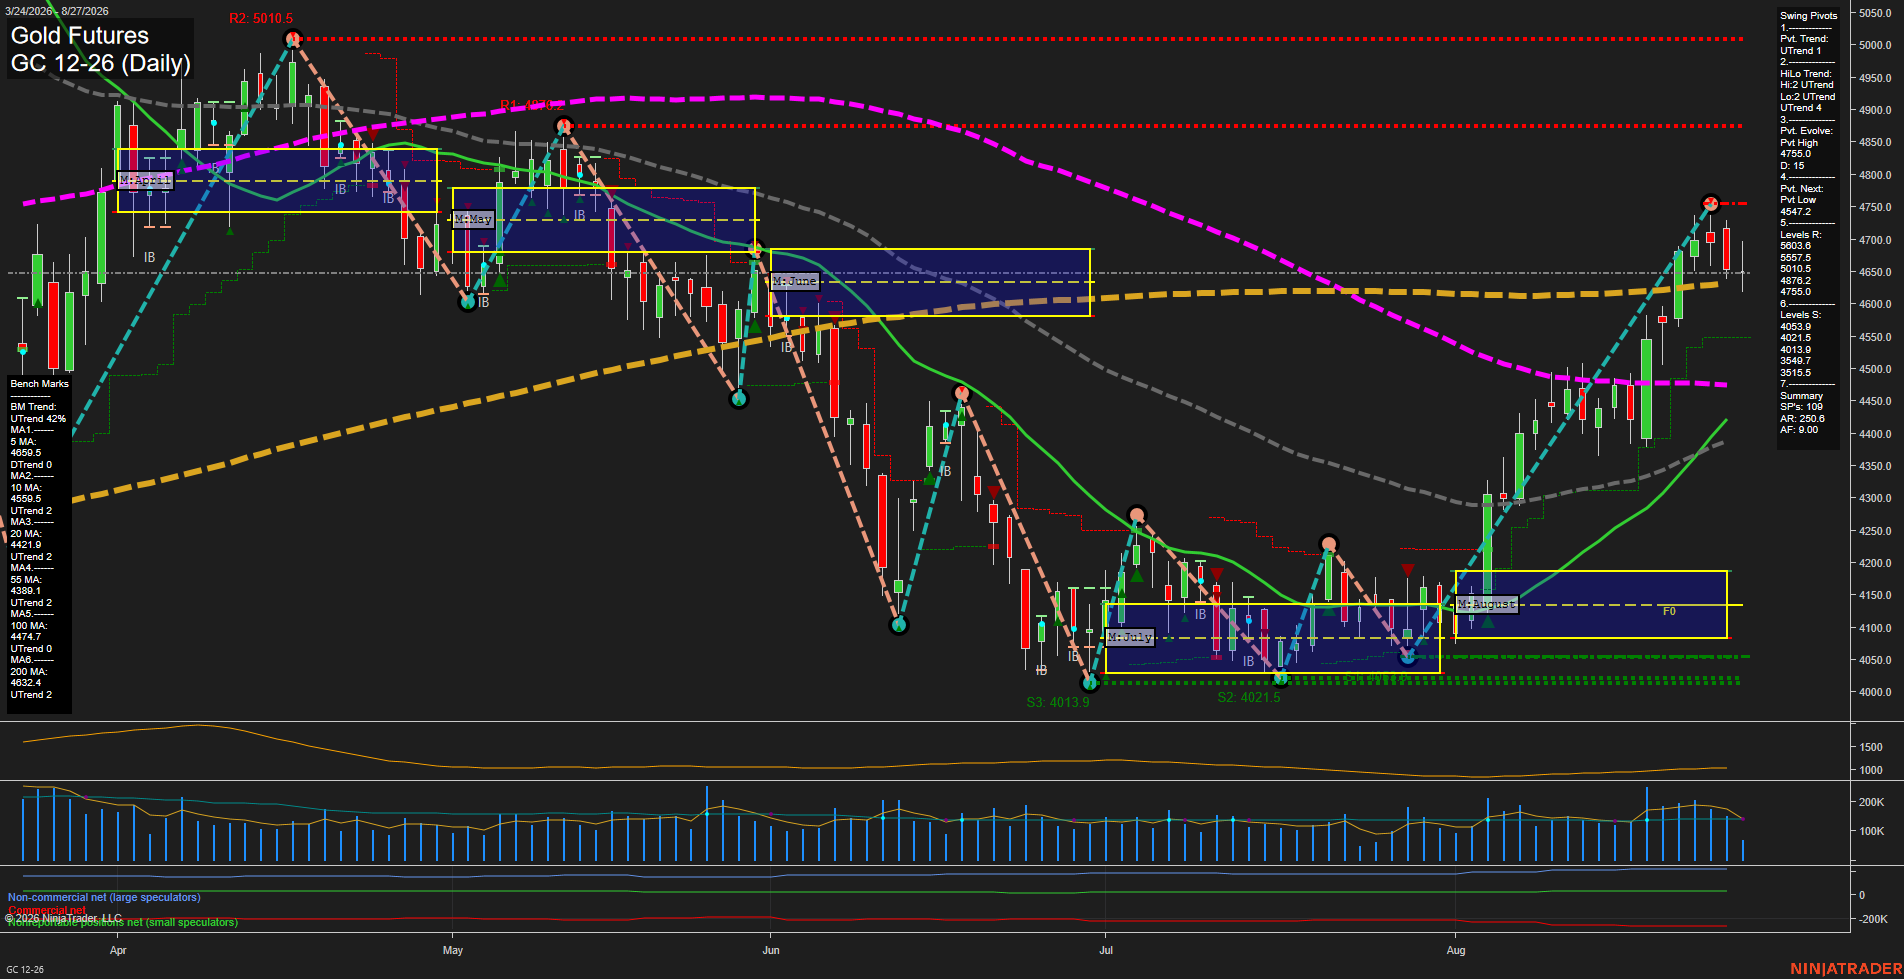
Overall Rating
- Short-Term: Neutral
- Intermediate-Term: Bullish
- Long-Term: Bullish.
Key Insights Summary
Gold remains in a broad recovery structure, with price holding above the rising 10, 20, 55, 100, and 200-day benchmarks and the intermediate pivot structure still registering UTrend. The late-August advance reached the 4755 pivot resistance area and was rejected, creating a short-term pullback while price trades below the weekly F0% level. This leaves the short-term condition mixed: fast momentum has cooled from the rally high, yet the larger sequence of higher lows and positive benchmark alignment remains intact. The 4547.2 reversal-pivot level is the key nearby structural reference beneath current price, while 4755.0 is the immediate overhead swing resistance.
View charts on: AlphaWebTrader HTF Charts