U.S. stocks eased as hotter inflation lifted yields before Nvidia earnings, while oil rebounded and gold fell amid Fed, election and policy risks.
Fundamentals: U.S. equities edged lower as stronger-than-expected inflation lifted Treasury yields and investors awaited Nvidia earnings. Gold retreated below $4,600 as the dollar firmed, while oil prices rebounded amid inventory, Iran and energy-policy developments. Earnings upgrades supported the broader outlook, but AI financing concerns, election uncertainty and debt risks remained in focus.
Technicals: U.S. markets ended with a constructive long-term backdrop but uneven near-term momentum. The Dow maintained bullish alignment across major time frames, while S&P 500 and Nasdaq futures consolidated under short-term resistance despite positive intermediate trends. Small caps and E-mini futures showed corrective pressure, while DAX futures retained broad upside structure.
After Market Close daily snapshot: market news summary and sentiment, major ETFs, Magnificent 7 analysis, Indices Futures Higher Time Frame Analysis, and E-mini S&P500, Nasdaq 100, NYMEX Crude, Gold Futures Daily Chart analysis.
As of: August 26, 2026 05:00 CT
Market News Summary:
Equity sentiment softened as hotter inflation lifted yields ahead of Nvidia earnings, while strong earnings expectations and AI-related risks pulled in opposite directions.
Primary Drivers & Risks:
- Primary Driver: Hotter inflation and Nvidia earnings
- Primary Risk: AI leverage and election uncertainty
Tone:
Cautious, with inflation and event risk restraining risk appetite.
Stock Market / ETFs / Indices:
U.S. stocks edged lower as traders assessed stronger-than-anticipated inflation data and awaited Nvidia results. UBS raised its S&P 500 target to 8,100, citing broader earnings upgrades and projected 25% S&P 500 earnings growth this year. Barclays cited macro volatility, AI capital-supply constraints, and midterm uncertainty as risks despite fresh-high potential.
Geopolitical:
Midterm elections are gaining market attention, including risks around delayed or contested results and a divided Congress. Iran-related developments drew attention in oil markets, while China’s gold strategy was described as part of its national-security and de-dollarization agenda.
Oil / Energy:
WTI and Brent rebounded as attention centered on EIA data, low Strategic Petroleum Reserve levels, and the U.S. response to an Iran-Oman agreement. U.S. commercial crude inventories rose 95,000 barrels in the latest week. The administration pursued refinery biofuel waivers, eased review requirements for some Alaska drilling, and restricted some foreign equipment from the electricity grid.
Gold / Metals:
Gold retreated below $4,600 after hotter PCE inflation firmed Treasury yields and the dollar, triggering profit-taking. The pullback followed a breakout from a nine-week range; longer-term gold commentary remained supported by sovereign-debt concerns and strategic demand themes.
Fed / Financials:
Higher-than-anticipated PCE inflation reduced dovish-Fed positioning and pressured precious metals. Elevated yields remained a bond-market risk, while scrutiny of U.S. interest costs intensified alongside discussion of the $40 trillion national debt. Markets also awaited the Fed chair’s Jackson Hole keynote.
Macro / Other:
Inflation was reported at 3.3%, while consumer confidence fell to 89.4, its lowest reading since the start of the year. Economic commentary characterized growth as stable despite a soft 1.5% second-quarter annualized pace, while employment weakness was framed as a labor-supply issue amid low layoffs and plentiful job openings.
Conclusion:
Hotter inflation, firmer yields, and Nvidia earnings were the immediate index-market focus. Broad earnings upgrades remained a counterweight to the session’s softer equity tone.
AI hyperscaler lease obligations, large capex commitments, and vendor-financing concerns added pressure to technology valuations. Midterm uncertainty, sovereign-debt concerns, and energy-policy changes remained additional cross-currents.
Market News Sentiment
Market News Articles: 38
- Neutral: 55.26%
- Negative: 26.32%
- Positive: 18.42%
Sentiment Summary: Market news sentiment is predominantly neutral (55%), with negative coverage (26%) exceeding positive coverage (18%).
Conclusion: The news backdrop for indices futures day traders is neutral overall, with a moderate negative skew in non-neutral articles.
GLD,Gold Articles: 11
- Neutral: 36.36%
- Negative: 36.36%
- Positive: 27.27%
Sentiment Summary: Gold coverage is balanced to cautious, with 36% neutral, 36% negative, and 27% positive sentiment across 11 articles.
Conclusion: For indices futures day traders, gold-related news tone is slightly negative relative to positive coverage, while neutral and negative articles jointly represent 73% of sentiment.
USO,Oil Articles: 12
- Neutral: 41.67%
- Negative: 33.33%
- Positive: 25.00%
Sentiment Summary: USO/Oil coverage is neutral-leaning, with 42% neutral, 33% negative, and 25% positive articles.
Conclusion: For indices futures day traders, oil-related news tone is mixed with a modest neutral majority and more negative than positive coverage.
Market Data Snapshot
ETF Snapshot of major stock market ETFs, Mag7, and others as of: August 26, 2026 05:00
Top Movers & Losers
- AAPL 313.45 Bullish 1.15% ▲
- META 576.14 Bullish 1.07% ▲
- USO 127.35 Bullish 0.95% ▲
- TSLA 345.82 Bearish -1.26% ▼
- GLD 421.32 Bearish -1.58% ▼
- NVDA 209.66 Bearish -1.59% ▼
Major Index ETFs: SPY, QQQ, DIA, IWM, IJH
- IJH 76.62 Bullish 0.63% ▲
- QQQ 711.37 Bullish 0.09% ▲
- SPY 766.08 Bullish 0.02% ▲
- IWM 298.93 Bearish -0.10% ▼
- DIA 534.23 Bearish -0.19% ▼
Major index ETFs were Mixed: IJH was the most bullish mover at +0.63%, while DIA was the most bearish mover at -0.19%. QQQ +0.09% and SPY +0.02% were marginally Bullish, while IWM -0.10% was near-flat Bearish.
Mag 7 Stocks: AAPL, MSFT, GOOG, AMZN, META, NVDA, TSLA
- AAPL 313.45 Bullish 1.15% ▲
- META 576.14 Bullish 1.07% ▲
- MSFT 496.37 Bullish 0.95% ▲
- AMZN 260.28 Bearish -0.30% ▼
- GOOG 339.10 Bearish -1.23% ▼
- TSLA 345.82 Bearish -1.26% ▼
- NVDA 209.66 Bearish -1.59% ▼
Mixed Mag7 snapshot: AAPL is the most bullish mover at +1.15%, followed by META at +1.07% and MSFT at +0.95%. NVDA is the most bearish mover at -1.59%, with TSLA at -1.26% and GOOG at -1.23% also Bearish. AMZN is modestly Bearish at -0.30%.
Cross-Market ETFs: TLT, GLD, USO, IBIT
- USO 127.35 Bullish 0.95% ▲
- TLT 83.30 Bearish -0.20% ▼
- IBIT 44.46 Bearish -0.58% ▼
- GLD 421.32 Bearish -1.58% ▼
Other ETFs were Mixed: USO was the most bullish mover at +0.95%, while GLD was the most bearish mover at -1.58%. IBIT declined -0.58%, and TLT was marginally Bearish at -0.20%.
ETF, Mag7, and Cross-Market ETF Insights
Overall Tone
Mixed conditions: broad index ETFs were marginal to Bearish while leadership was selective in parts of Mag7, alongside Bearish hedging and digital-asset proxies.
Equity ETFs and Mag7:
Major Index ETFs were Mixed: IJH led at +0.63%, while QQQ +0.09% and SPY +0.02% were near-flat; IWM fell -0.10% and DIA declined -0.19%. Mag7 action was selective, with AAPL the most bullish mover at +1.15%, followed by META at +1.07% and MSFT at +0.95%. NVDA was the most bearish mover at -1.59%, with TSLA -1.26% and GOOG -1.23% also Bearish.
Cross-Market ETFs:
Cross-market ETFs were Mixed, led by USO at +0.95%, indicating commodity strength against broadly marginal equity-index movement. GLD was the most bearish mover at -1.58%, while IBIT declined -0.58% and TLT was marginally Bearish at -0.20%. The combination of USO strength with Bearish GLD, IBIT, and TLT reflected divergence across non-equity markets.
Futures Indices – Higher Time Frame Analysis
Summary of the current state of US Indices Futures based on higher time-frame (HTF) technical analysis as of: 2026-08-26: 17:00 CT.
US Indices Futures
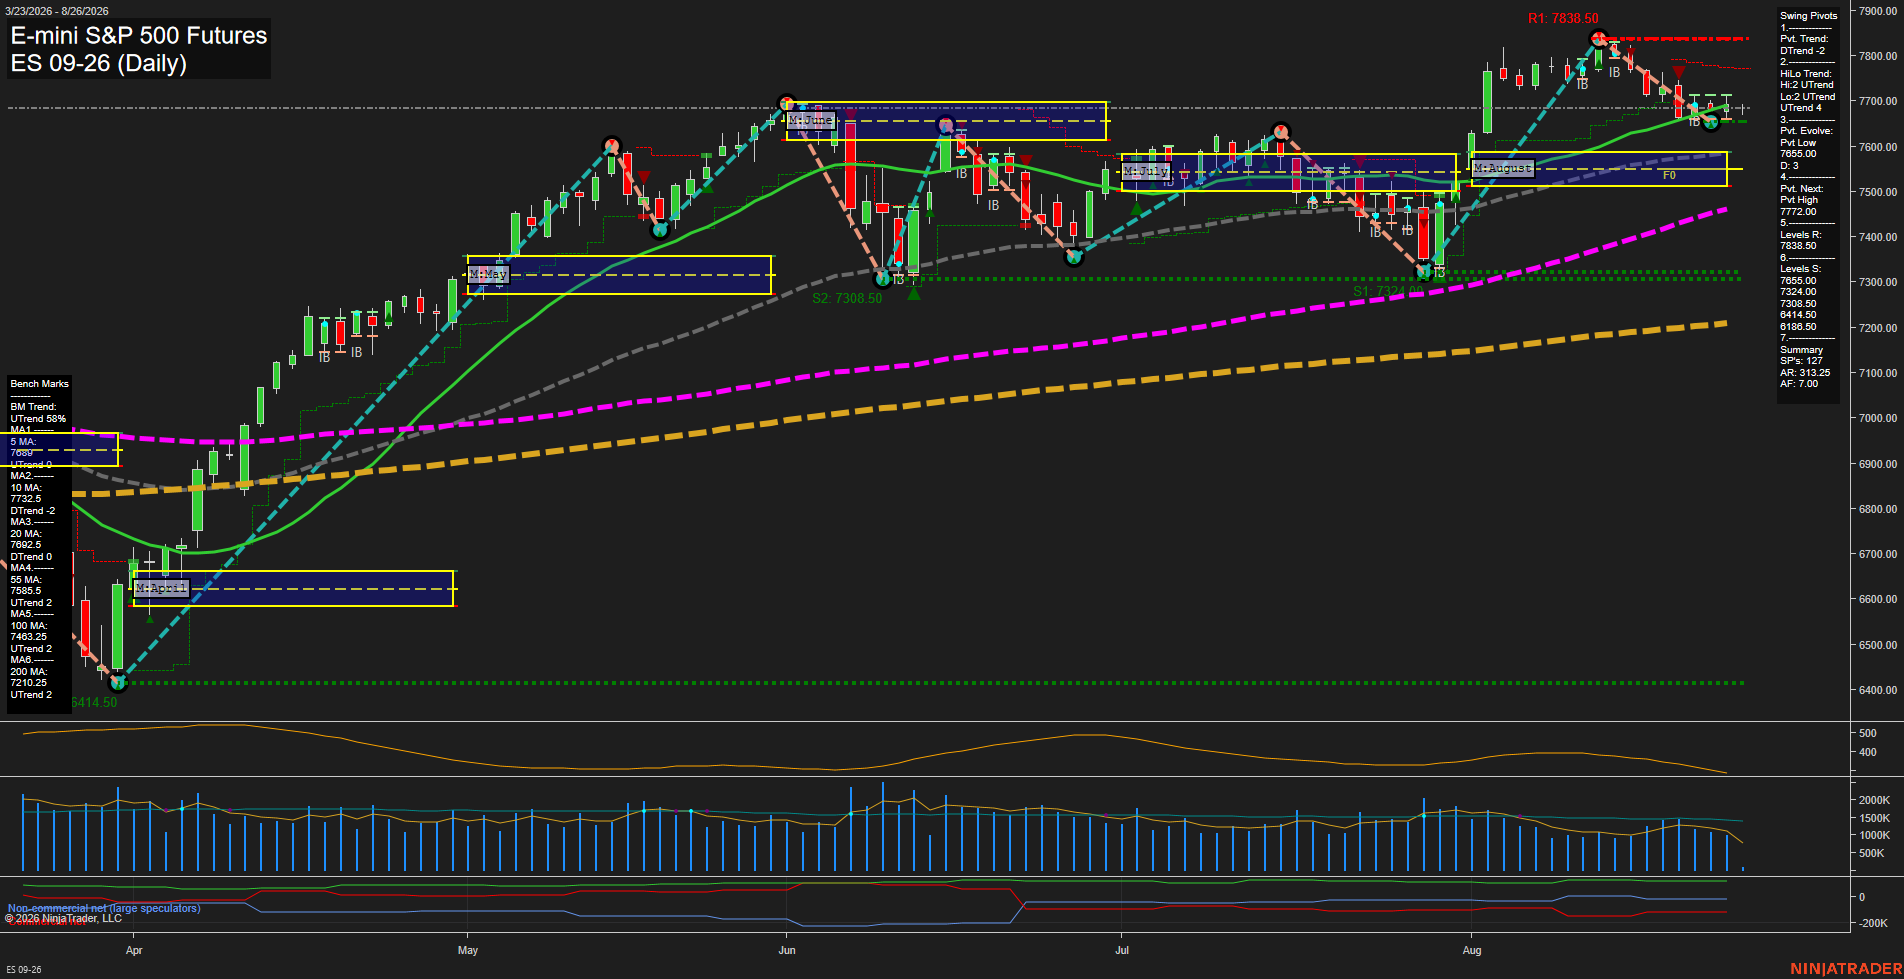
- ES: YSFG/MSFG up, WSFG down; above long benchmarks, DTrend short pivots; support 7665-7688/7457, resistance 7772/7838.50.
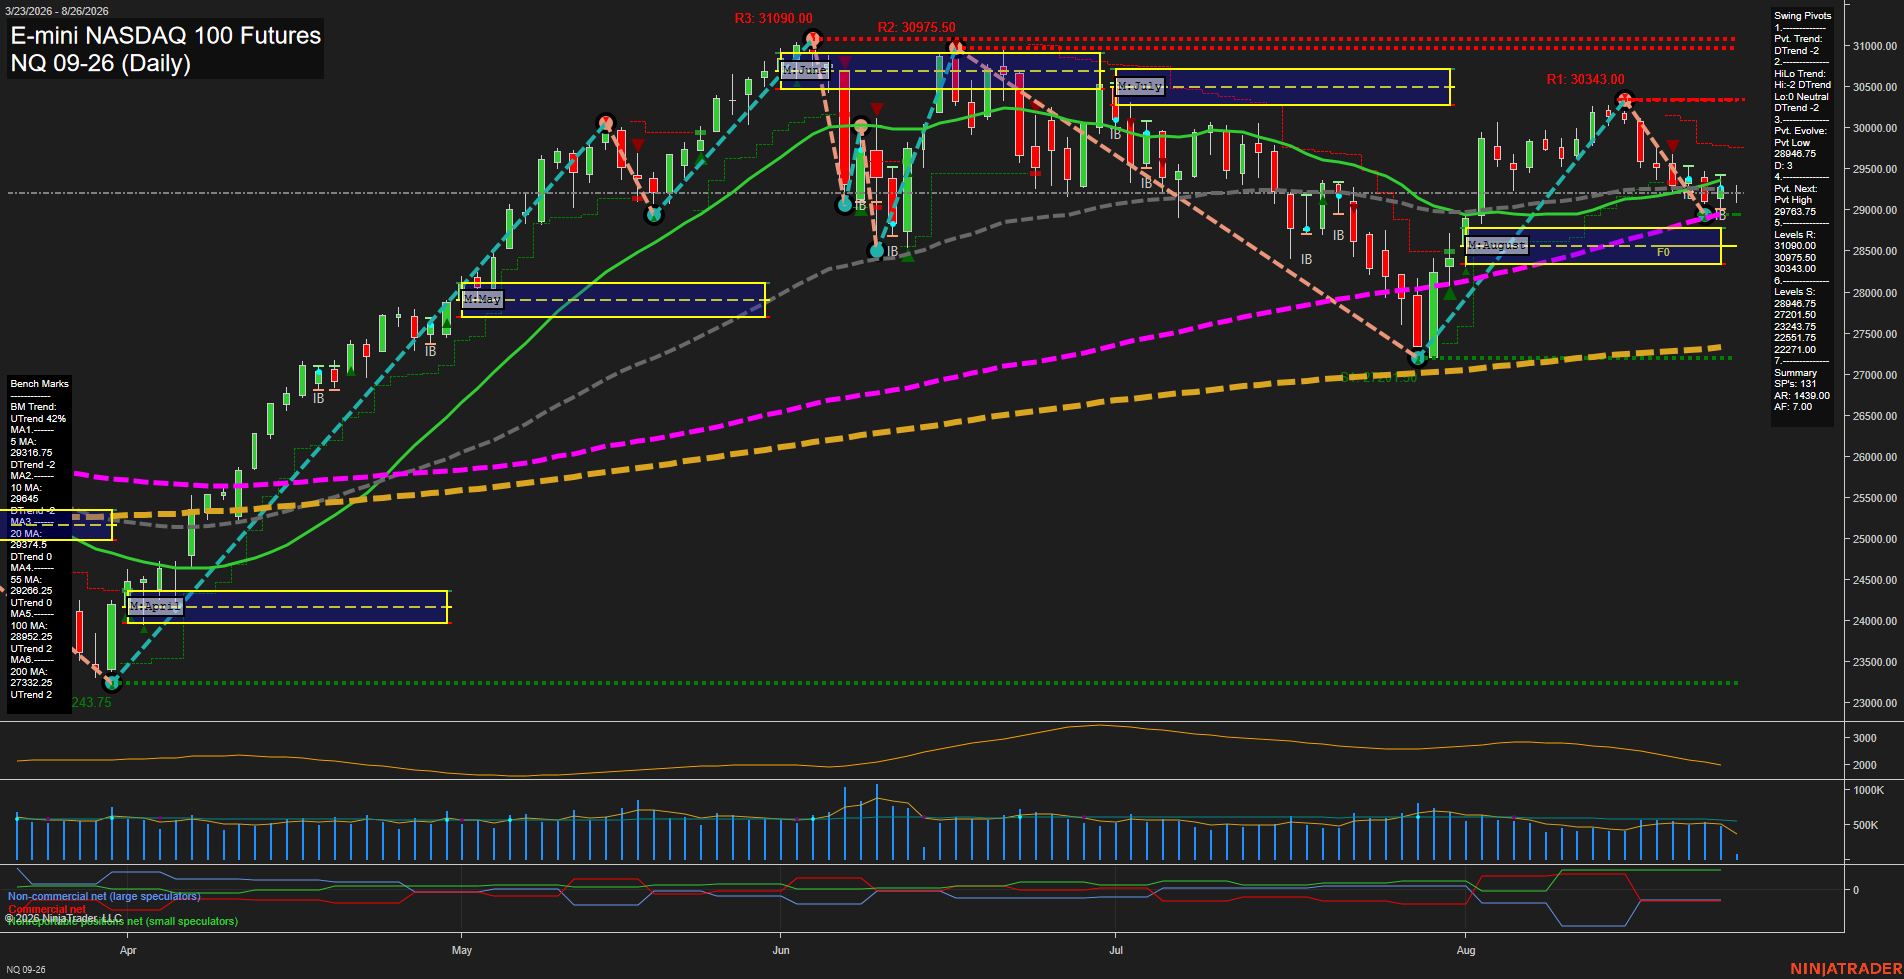
- NQ: YSFG/MSFG up, WSFG down; long benchmarks rising, short DTrend; support 28946.75/27201.50, resistance 29367.50/30343.
- YM: YSFG/MSFG/WSFG above F0%; aligned rising benchmarks and UTrend pivots; support 52961/52812, resistance 53797/54384/54884.
- EMD: YSFG/MSFG up, WSFG below F0%; below short benchmarks, higher-order trend up; support 3792.8/3730.5-3692.9, resistance 3867.2/3941.7.
- RTY: YSFG/MSFG up, WSFG down below F0%; benchmarks broadly rising, daily DTrend; support 2993.8, resistance 3058.0/3079.9.
- FDAX: YSFG/MSFG/WSFG above F0%; all benchmarks rising, higher-order pivots up; support 25965/25153, resistance 26389/26665.
Overall State
- Short-Term: Bearish
- Intermediate-Term: Bullish
- Long-Term: Bullish
Conclusion
ES, NQ, EMD, and RTY daily structures retain short-term corrective conditions, with WSFG weakness or below-F0% positioning contrasting with rising MSFG and YSFG trends. YM and FDAX maintain aligned bullish Fib-grid, benchmark, and pivot structures. Across the group, intermediate and long-term benchmarks and higher-order pivots remain upward; nearby pivot support and resistance define current consolidation and retracement boundaries.
Note: Intra-day counter-trend pullbacks or retracements may occur, HTF is context for informational usage and market structure. Glossary: Session Fib Grids periods of YSFG:’Yearly’, MSFG:’Monthly’, WSFG:’Weekly’
For full details visit: AlphaWebTrader Technicals
ES Daily View
Overall Rating
- Short-Term: Bearish
- Intermediate-Term: Bullish
- Long-Term: Bullish.
Key Insights Summary
Price is consolidating near 7689 after a sharp August advance and retracement, with small daily bars and slowing momentum reflecting reduced directional participation. The short-term pivot structure remains in DTrend, price is below the weekly F0% area, and the 10-day and 20-day benchmarks are declining. Intermediate and long-term structure remains constructive: the HiLo pivot trend is UTrend, price remains above the rising 55-day, 100-day, and 200-day averages, and both monthly and yearly fib-grid bias remain above F0%. The 7665 to 7688 area is the immediate pivot-support zone, while 7772 and 7838.50 define the nearby pivot and major resistance sequence.
View charts on: AlphaWebTrader HTF Charts
NQ Daily View
Overall Rating
- Short-Term: Bearish
- Intermediate-Term: Neutral
- Long-Term: Bullish.
Key Insights Summary
Price is consolidating beneath the 5, 20, and 55 day benchmarks following the August rebound, while the short-term pivot structure remains in a DTrend. The 28946.75 pivot low and nearby 100 day average define the current support zone, whereas 29367.50 is the next pivot reversal level and 30343.00 is the principal overhead swing resistance. ATR and volume participation have moderated from earlier summer expansion, reflecting slower momentum and a compressed, choppy daily range. The monthly and yearly Fib structures remain positive, preserving the broader bullish trend backdrop despite the current short-term pullback.
View charts on: AlphaWebTrader HTF Charts
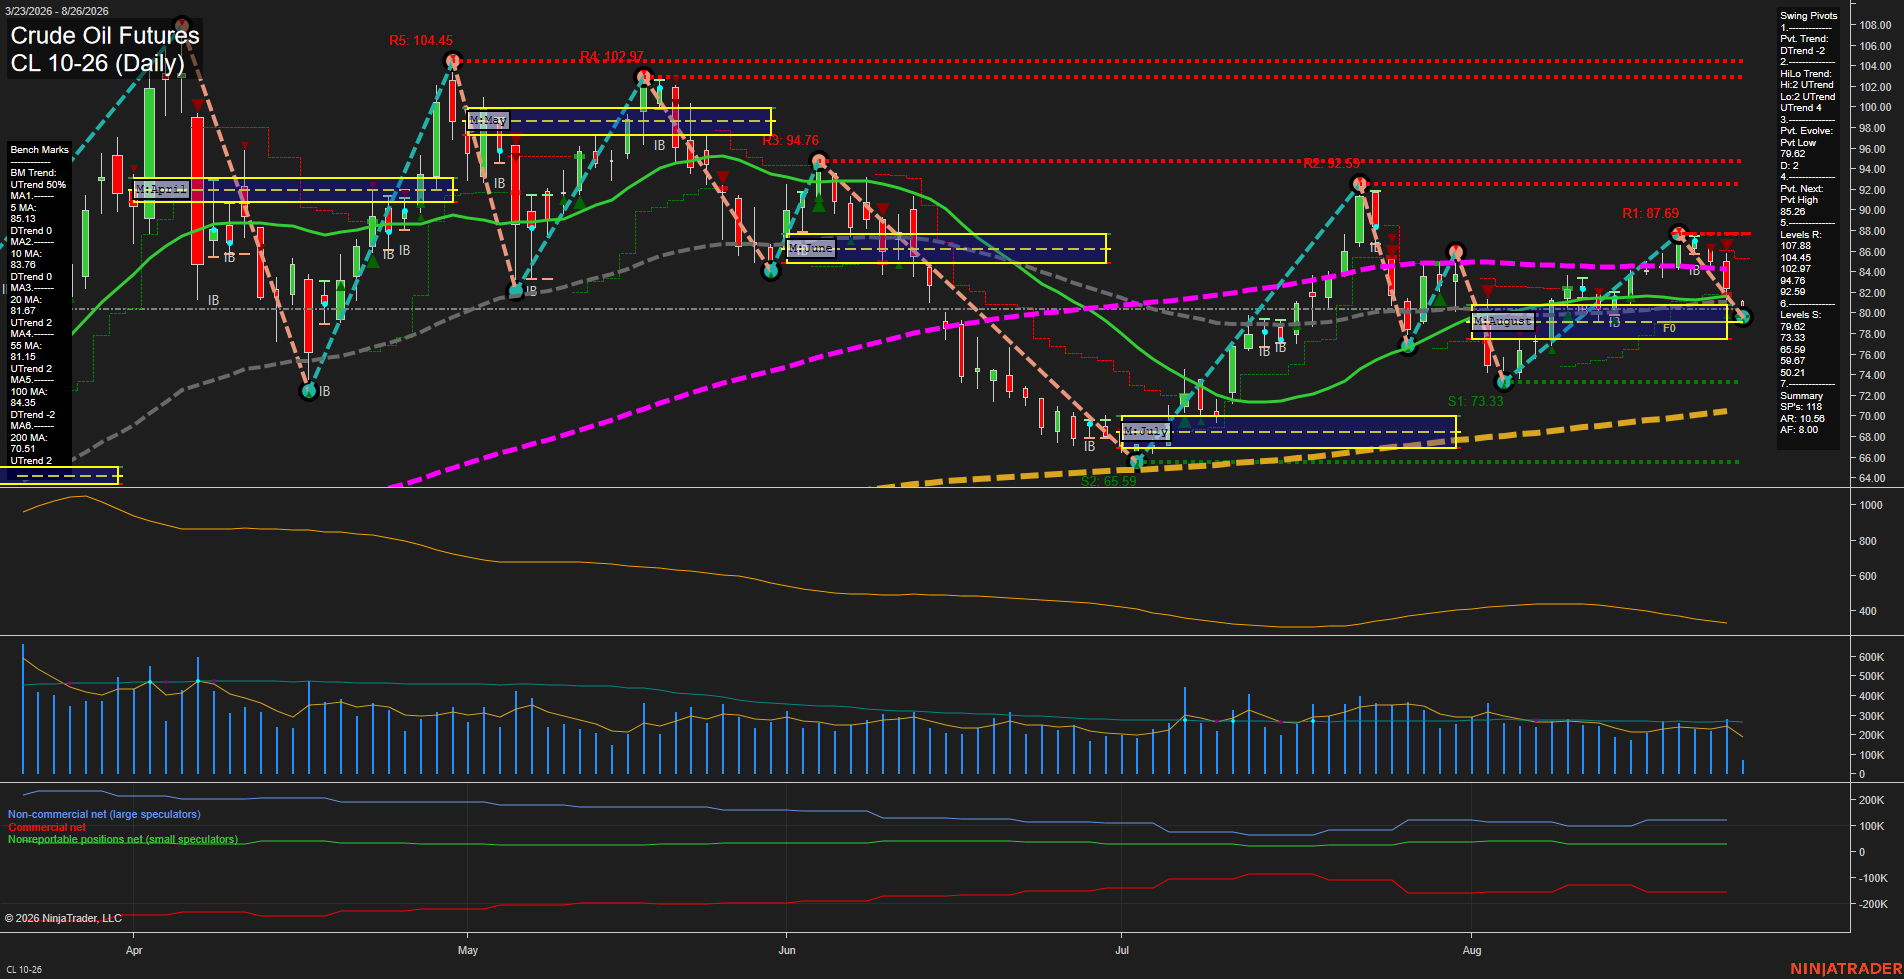
CL Daily View
Overall Rating
- Short-Term: Bearish
- Intermediate-Term: Neutral
- Long-Term: Bullish.
Key Insights Summary
CL has shifted into a fast short-term selloff, with a large decline to 79.62 completing a new pivot low and placing price below the 5, 10, 20, 55, and 100-day benchmarks. The weekly grid is decisively below F0%, confirming near-term downside pressure, while the 79.62 pivot-low area is the immediate support reference. The intermediate structure remains mixed: the monthly grid and HiLo pivot trend are still positive, but the current decline is a countertrend retracement below intermediate moving-average levels. The yearly grid and rising 200-day benchmark preserve the longer-term recovery structure, although the 100-day average remains in a down trend. Overhead pivot resistance is concentrated at 87.69, then 92.59 and 94.76, while a break beneath the current low would expose 73.33 as the next major support zone.
View charts on: AlphaWebTrader HTF Charts
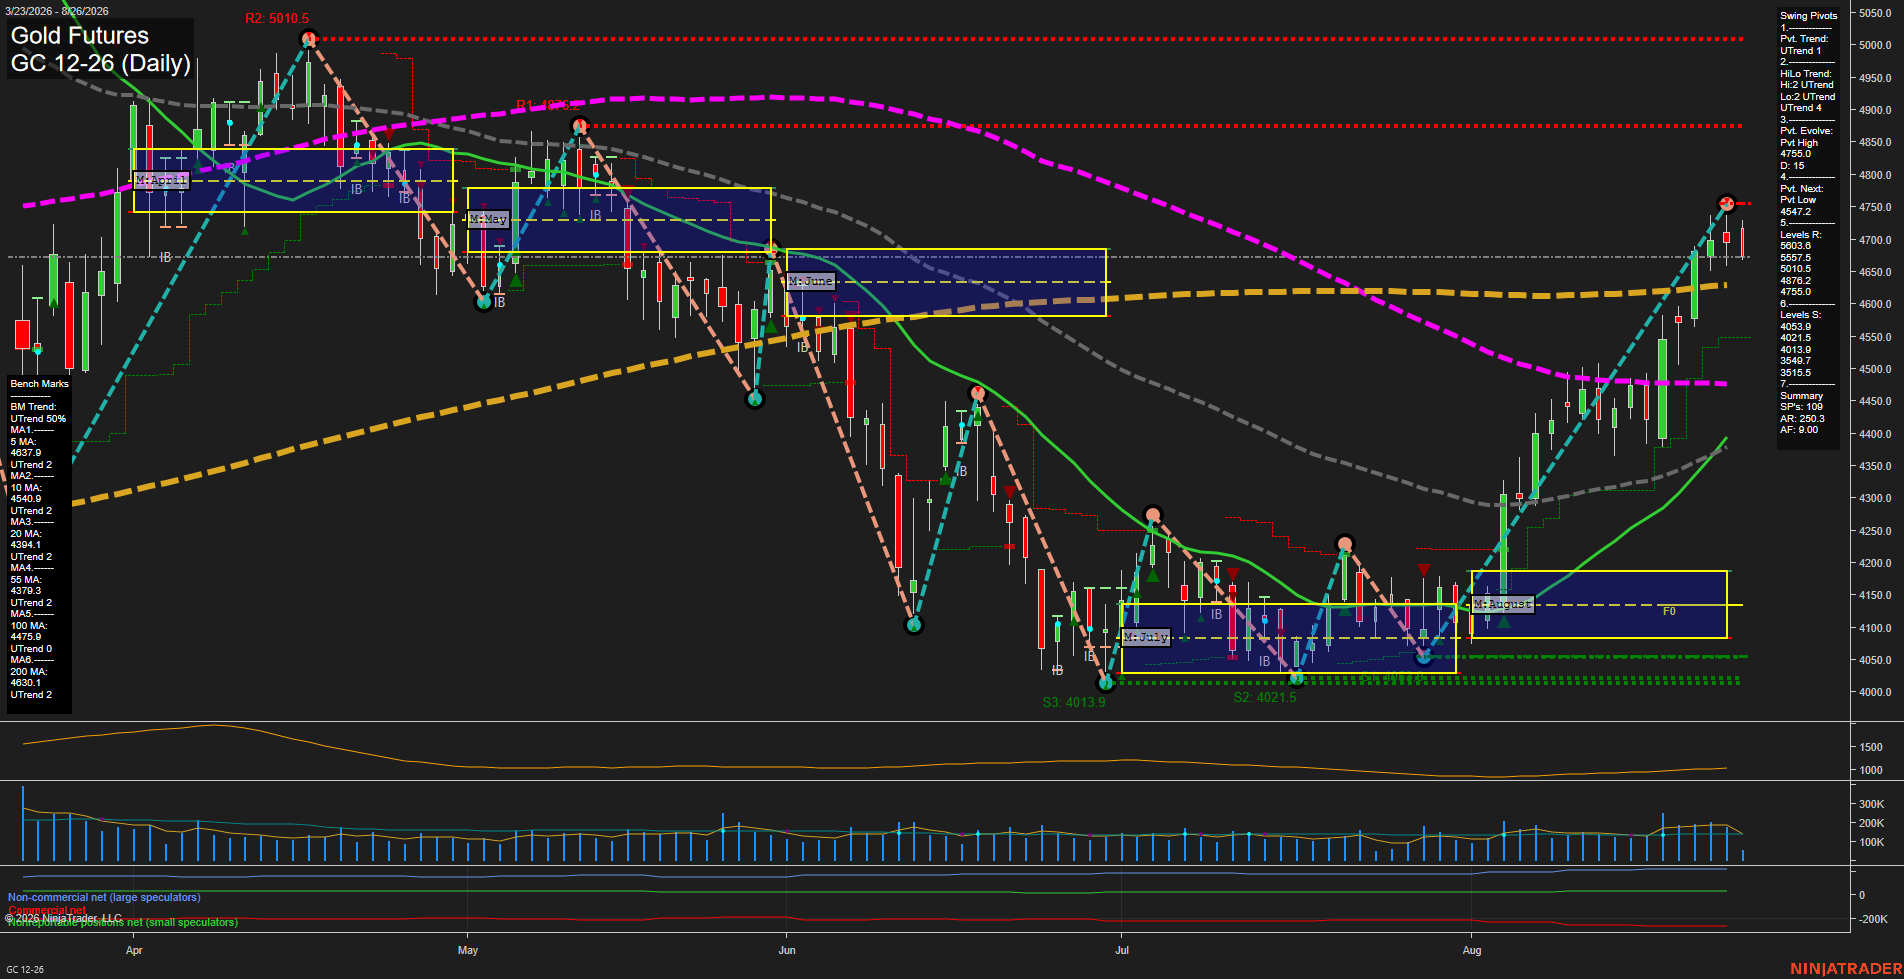
GC Daily View
Overall Rating
- Short-Term: Bullish
- Intermediate-Term: Bullish
- Long-Term: Bullish.
Key Insights Summary
Gold remains in a strong swing advance following the August breakout from the monthly grid near 4100-4170. Price is above all daily benchmarks, while both the short-term pivot trend and intermediate HiLo trend remain positive. The rally has reached the active 4755 pivot-high resistance area and is consolidating just beneath it with smaller bars after a fast directional move. The 4547.2 pivot-low reversal level defines the current short-term structural boundary, while the 4630-4638 area clusters the 200-day and 5-day benchmarks beneath price. The broader benchmark alignment is constructive, although the yearly fib-grid reading remains below F0%, leaving the longer-cycle backdrop in recovery rather than fully aligned with the current daily uptrend.
View charts on: AlphaWebTrader HTF Charts