NYSE pre-market radar tracks ETF movers and mixed U.S. futures as bullish weekly index trends meet Fed, Treasury and Strait of Hormuz risks.
Fundamentals: U.S. index futures are mixed after a technology-led equity advance, with AI spending and semiconductor commentary supporting risk sentiment. Markets are focused on Fed Chair Kevin Warsh's Jackson Hole remarks, benchmark payroll revisions and consumer sentiment data. Strait of Hormuz shipping constraints, Iran tensions, Treasury conditions and U.S.-China rhetoric remain key cross-currents.
Technicals: Pre-market analysis shows NVDA, TSLA and USO leading prior-session ETF-related movers, while GOOG, META and AMZN declined. Weekly futures trends remain broadly bullish across ES, NQ, YM and FDAX, with daily charts showing consolidation near resistance. EMD and RTY retain longer-term positive structures despite short-term corrective pressure.
Pre-Market Trading 360° view Market Radar of: holidays, earnings, eco-news, market-news summary, news sentiment, prior session major ETFs, MAG7, Higher Time Frame Analysis Indices Futures Summary, and E-mini S&P500, Nasdaq 100, NYMEX Crude, Gold Futures Daily Chart analysis.
As of: August 28, 2026 07:16 CT
Earnings Radar
Monitoring for earnings releases by the Magnificent 7, AI-tech-related firms, and major financial institutions.
- AVGO Release: 2026-09-02 T:AMC
- SNOW Release: 2026-09-02 T:AMC
Conclusion: AVGO and SNOW report after the close on 2026-09-02, concentrating semiconductor/AI-linked and enterprise software earnings risk in the same session. Index futures activity can reflect positioning around these releases, with market momentum and volume often slowing ahead of major AI, semiconductor, and related tech earnings.
For full details visit: Yahoo Earnings Calendar
EcoNews Radar U.S. Events
| Day | Time | Impact | Event |
|---|---|---|---|
| Fri | 10:00 | High | Fed Chairman Warsh Speaks |
| Fri | 10:00 | High | Prelim Benchmark Payrolls Revision |
| Fri | 10:00 | Medium | Revised UoM Consumer Sentiment |
| Fri | 10:00 | Medium | Revised UoM Inflation Expectations |
| Fri | 12:15 | High | Jackson Hole Symposium |
| Sat | 12:15 | Medium | Jackson Hole Symposium |
EcoNews Summary
Friday features a concentrated high-impact U.S. event window at 10:00, followed by the high-impact Jackson Hole Symposium at 12:15. The payroll benchmark revision provides an updated view of employment data, while Fed Chairman Warsh’s remarks focus attention on monetary-policy communication. The Jackson Hole Symposium extends the policy and macroeconomic focus into the afternoon.
Event Notes:
- Friday 10:00 – Fed Chairman Warsh Speaks: Public remarks from the Federal Reserve Chairman. Traders monitor Fed communication for information on monetary-policy views, inflation, economic conditions, and interest-rate policy.
- Friday 10:00 – Prelim Benchmark Payrolls Revision: A preliminary revision to prior payroll estimates based on more complete administrative data. It measures whether historical employment growth was overstated or understated, affecting assessments of labor-market conditions.
- Friday 12:15 – Jackson Hole Symposium: A high-level central-banking and economic-policy symposium. Traders monitor speeches and policy discussion for changes in the tone of monetary-policy and economic commentary.
Conclusion:
The single most important event is Friday’s 12:15 High Jackson Hole Symposium, due to its broad central-bank and policy focus. Friday’s 10:00 time cycle also contains two high-impact U.S. events, creating a concentrated period for market reaction and volatility around scheduled releases and remarks.
For full details visit: Forex Factory EcoNews
Market News Summary:
Index futures face competing support from AI-led equities and pressure from Fed, Treasury, and Middle East uncertainty.
Primary Drivers & Risks:
- Primary Driver: AI and technology equity strength
- Primary Risk: Rates and Hormuz disruption
Tone:
Cautiously constructive, with elevated event and geopolitical sensitivity.
Stock Market / ETFs / Indices:
The S&P 500 was tracking a 0.77% Thursday gain, though the rally was described as thin. Japanese equities rose 0.4% on strength in IT services after U.S. technology gains, while AI spending and bullish semiconductor commentary supported the technology theme. Early Friday U.S. futures were slightly mixed, and elevated S&P 500 CAPE valuation remained a longer-term cross-current.
Geopolitical:
The Iran conflict remained a prolonged stalemate as the U.S. emphasized economic pressure and planned secondary sanctions. U.S.-China tensions also increased after Trump raised the prospect of sanctions on Chinese banks, even as preparations continued for Xi Jinping’s U.S. visit.
Oil / Energy:
Oil prices showed mixed signals: crude edged higher as hopes for reopening the Strait of Hormuz faded, yet prices remained on course for a weekly decline. Shipping traffic through Hormuz fell to seven commodity vessels Thursday from 17 the prior day and below the 10-day average of 15. U.S. discussions for a stake in Venezuelan oil fields highlighted another supply-related development.
Gold / Metals:
Gold declined in early Asian trading as markets awaited Fed Chair Kevin Warsh’s Jackson Hole remarks and assessed sticky inflation. Other reports described gold and silver pricing as highly sensitive to rate expectations, with gold testing technical support.
Fed / Financials:
Warsh’s Jackson Hole speech was the central rates event, with Asian currencies consolidating against the dollar beforehand. Commentary diverged between concerns over sticky inflation and calls that keeping rates unchanged harms the economy. One economist argued markets were overreacting to bond and rate movements absent a strong, disorderly rise in yields.
Macro / Other:
U.K. business confidence rose despite elevated energy costs, supported by resilient consumer demand. Global growth was described as holding up amid trade, geopolitical, and bond-market strains, with the AI investment boom playing an outsized role. Japan undertook record yen-support operations alongside coordinated U.S. action.
Conclusion:
AI and technology strength remain the principal equity support. Fed-rate signals from Jackson Hole and Treasury-market conditions are the main macro focus.
Hormuz shipping constraints and the Iran conflict sustain energy-market risk. Escalating U.S.-China rhetoric, expensive equity valuations, and mixed crude-price signals add cross-currents.
Market News Sentiment
Market News Articles: 35
- Neutral: 62.86%
- Positive: 22.86%
- Negative: 14.29%
Sentiment Summary: Of 35 market news articles, 63% were neutral, 23% positive, and 14% negative, indicating predominantly balanced coverage with a modest positive tilt.
Conclusion: Indices futures day traders are facing mostly neutral news flow, with positive articles outnumbering negative articles.
GLD,Gold Articles: 12
- Positive: 66.67%
- Negative: 33.33%
Sentiment Summary: GLD/Gold coverage was moderately positive, with 67% positive and 33% negative articles across 12 items.
Conclusion: Gold-related news tone was positive overall, though one-third of coverage was negative.
USO,Oil Articles: 5
- Negative: 60.00%
- Positive: 20.00%
- Neutral: 20.00%
Sentiment Summary: USO/oil coverage is predominantly negative, with 60% negative, 20% positive, and 20% neutral articles.
Conclusion: The oil news tone is net negative, indicating a potentially cautious energy-sector backdrop for indices futures monitoring.
Market Data Snapshot
ETF Snapshot of major stock market ETFs, Mag7, and others as of: August 28, 2026 07:16
Top Movers & Losers
- NVDA 227.98 Bullish 8.74% ▲
- TSLA 354.81 Bullish 2.60% ▲
- USO 130.01 Bullish 2.09% ▲
- GOOG 337.71 Bearish -0.41% ▼
- META 571.10 Bearish -0.87% ▼
- AMZN 256.26 Bearish -1.54% ▼
Major Index ETFs: SPY, QQQ, DIA, IWM, IJH
- QQQ 721.11 Bullish 1.37% ▲
- SPY 771.10 Bullish 0.66% ▲
- IWM 299.81 Bullish 0.29% ▲
- DIA 535.22 Bullish 0.19% ▲
- IJH 76.65 Bullish 0.04% ▲
Major index ETFs are Bullish across the group: QQQ leads with +1.37%, followed by SPY at +0.66%. IWM is modestly Bullish at +0.29% and DIA at +0.19%. IJH is the least positive mover at a marginal +0.04%.
Mag 7 Stocks: AAPL, MSFT, GOOG, AMZN, META, NVDA, TSLA
- NVDA 227.98 Bullish 8.74% ▲
- TSLA 354.81 Bullish 2.60% ▲
- MSFT 505.06 Bullish 1.75% ▲
- AAPL 314.58 Bullish 0.36% ▲
- GOOG 337.71 Bearish -0.41% ▼
- META 571.10 Bearish -0.87% ▼
- AMZN 256.26 Bearish -1.54% ▼
Mag7 is Mixed: NVDA is the most bullish mover at +8.74%, followed by TSLA at +2.60% and MSFT at +1.75%. AMZN is the most bearish mover at -1.54%, with META at -0.87% and GOOG at -0.41%. AAPL is modestly Bullish at +0.36%.
Cross-Market ETFs: TLT, GLD, USO, IBIT
- USO 130.01 Bullish 2.09% ▲
- IBIT 45.29 Bullish 1.87% ▲
- GLD 422.60 Bullish 0.30% ▲
- TLT 83.13 Bearish -0.20% ▼
Other ETFs are Mixed: USO is the most bullish mover at +2.09%, followed by IBIT at +1.87%; GLD is modestly Bullish at +0.30%. TLT is the most bearish mover at -0.20%.
ETF, Mag7, and Cross-Market ETF Insights
Overall Tone
Mixed risk tone: major equity ETFs were broadly Bullish while Mag7 performance was selective, alongside Bullish USO and IBIT and marginally Bearish TLT.
Equity ETFs and Mag7:
Major Index ETFs were aligned Bullish, led by QQQ at +1.37%, followed by SPY at +0.66%; DIA, IWM, and near-flat IJH were also positive at +0.19%, +0.29%, and +0.04%. Mag7 action was selective: NVDA was the most bullish mover at +8.74%, with TSLA and MSFT also Bullish, while AMZN was the most bearish mover at -1.54%, followed by META at -0.87% and GOOG at -0.41%. AAPL remained modestly Bullish at +0.36%.
Cross-Market ETFs:
Cross-market ETFs were mostly Bullish, led by USO at +2.09%, the most bullish mover, with IBIT at +1.87% and GLD at +0.30%. TLT was the most bearish mover at -0.20%, a modest decline versus the broader Bullish equity and commodity backdrop.
Futures Indices – Higher Time Frame Analysis
Summary of the current state of US Indices Futures based on higher time-frame (HTF) technical analysis as of: 2026-08-28: 07:16 CT.
US Indices Futures
- ES YSFG/MSFG/WSFG above F0%, benchmarks aligned up, weekly pivots up; resistance 7789.00-7838.50, support 7665.00-7683.50 and 7455.50.
- NQ YSFG/MSFG/WSFG above F0%, benchmarks rising; weekly UTrend, daily DTrend; support 28946.75, resistance 29743.25, 30343.00 and 31090.
- YM YSFG/MSFG/WSFG upward, above rising benchmarks; pivots broadly up; resistance 53884 and 54884, support 52812, 52456, 49709 and 48525.
- EMD YSFG/MSFG above F0%, WSFG below F0%; long benchmarks rising, short pivots down; resistance 3860.0-3868.8 and 3941.7, support 3826.7, 3792.4 and 3726.7.
- RTY YSFG/MSFG above F0%, WSFG down below F0%; benchmarks rise, weekly pivots up, daily pivots down; resistance 3056.8-3079.9, support 2993.2 and 2887.3.
- FDAX YSFG/MSFG/WSFG above F0%, price above aligned benchmarks, pivots up; resistance 26594-26685, support 26180, 25965 and 25145.
Overall State
- Short-Term: Neutral
- Intermediate-Term: Bullish
- Long-Term: Bullish
Conclusion
HTF structure is broadly bullish across all contracts, with YSFG and MSFG generally above F0% and benchmark alignment upward. ES, NQ, YM, and FDAX retain stronger synchronization; EMD and RTY show short-term WSFG and pivot divergence. Daily consolidation or retracement conditions remain beneath defined swing resistance in several contracts.
Note: Intra-day counter-trend pullbacks or retracements may occur, HTF is context for informational usage and market structure. Glossary: Session Fib Grids periods of YSFG:’Yearly’, MSFG:’Monthly’, WSFG:’Weekly’
For full details visit: AlphaWebTrader Technicals
ES Daily View
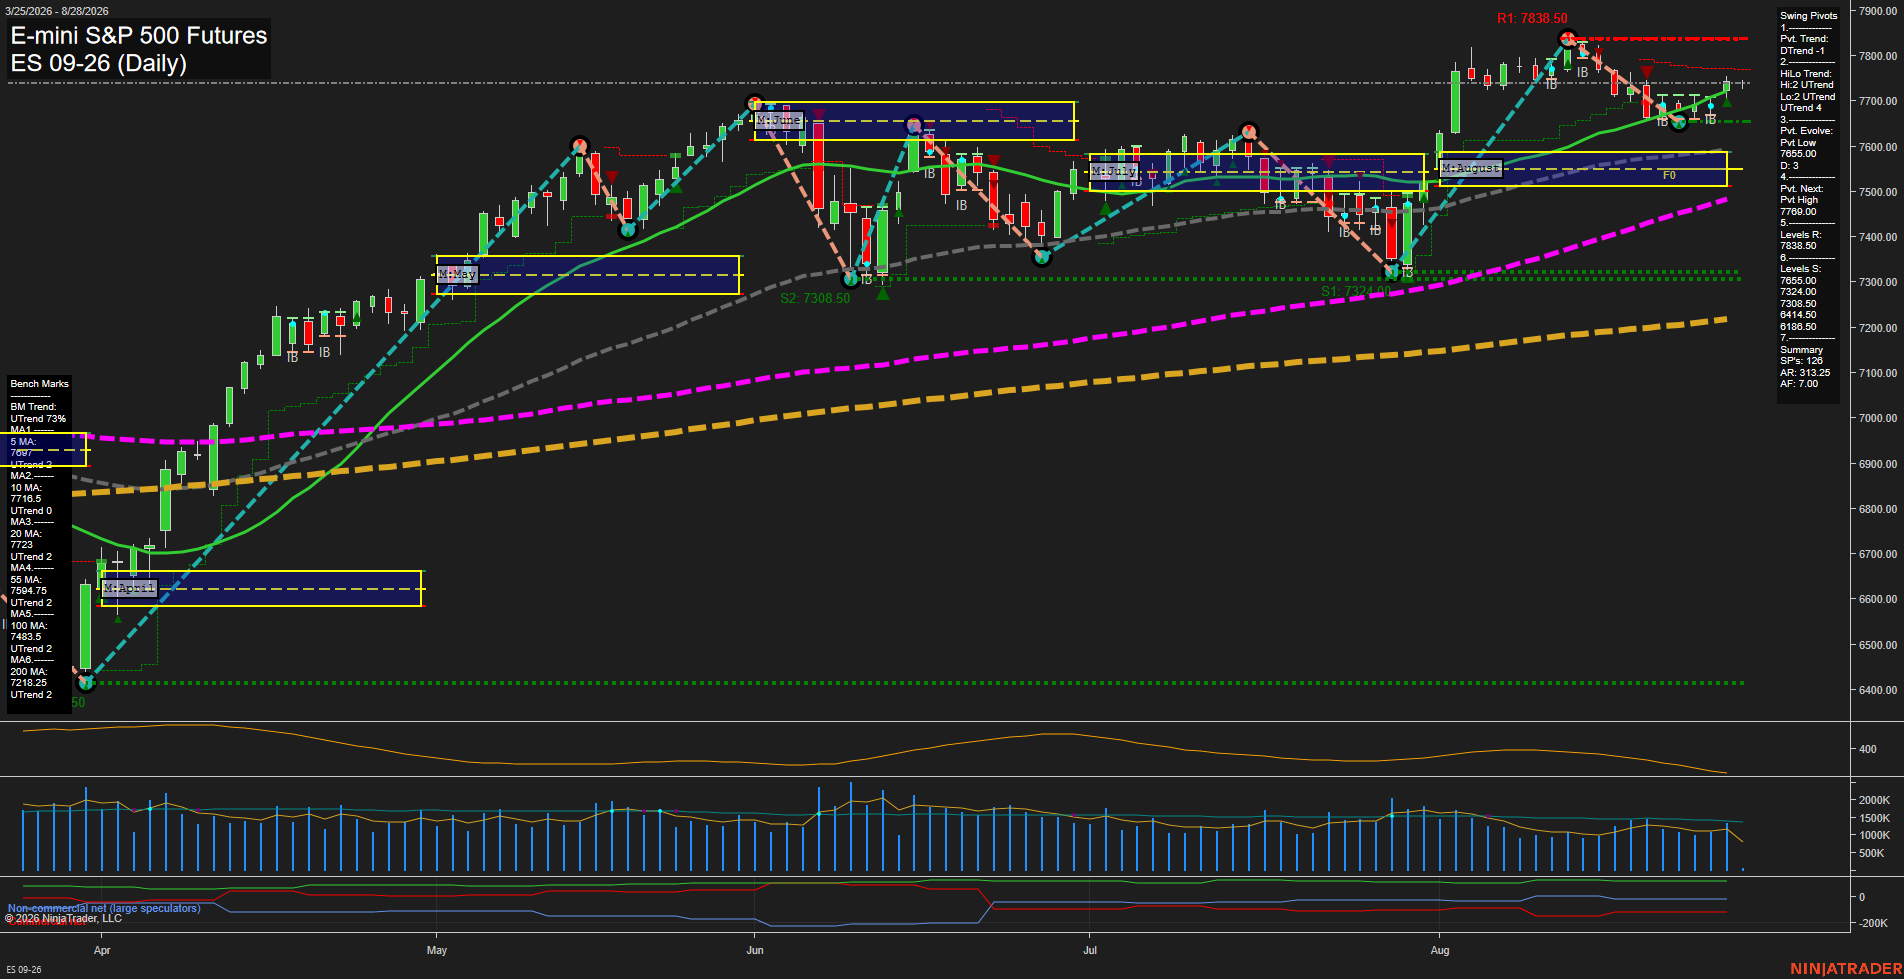
Overall Rating
- Short-Term: Neutral
- Intermediate-Term: Bullish
- Long-Term: Bullish.
Key Insights Summary
Price remains above every benchmark average and above the weekly, monthly, and yearly F0% levels, preserving the broader bullish structure. The intermediate pivot sequence remains an uptrend, while the short-term pivot trend is down after rejection beneath 7838.50 resistance. Recent small bars and slow momentum indicate consolidation following the August rally, with 7665.00 to 7683.50 defining the nearby pullback-support zone and 7789.00 to 7838.50 defining the overhead pivot-resistance zone.
View charts on: AlphaWebTrader HTF Charts
NQ Daily View
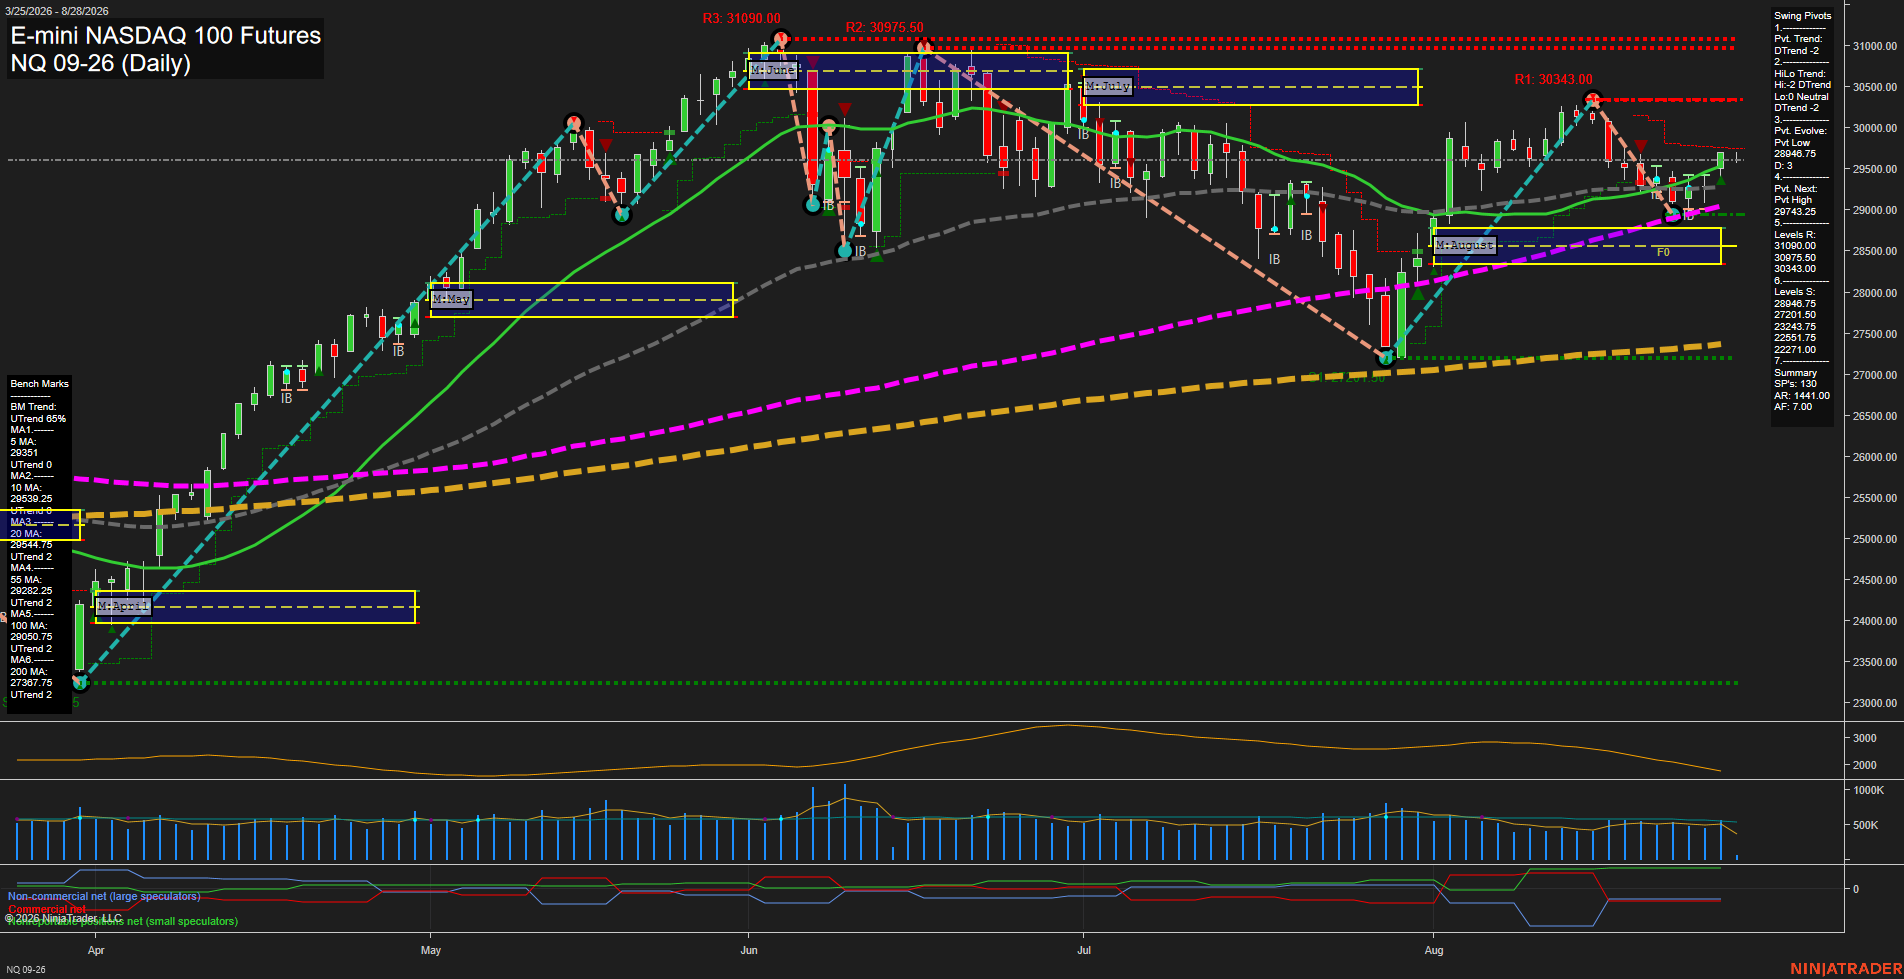
Overall Rating
- Short-Term: Neutral
- Intermediate-Term: Bullish
- Long-Term: Bullish.
Key Insights Summary
Price is consolidating near 29585 after the August V-recovery from the 28946.75 pivot low. Short-term moving averages and the weekly grid remain constructive, but the active pivot and HiLo structures remain in DTrend, reflecting a countertrend rebound beneath 29743.25 pivot confirmation. Intermediate and long-term structure remains positive: price is above the rising 20-, 55-, 100-, and 200-day benchmarks and above the monthly and yearly F0% grids. The immediate range is framed by 28946.75 support and 30343.00 resistance, with declining momentum and relatively contained volume indicating a choppy consolidation rather than a broad impulsive breakout.
View charts on: AlphaWebTrader HTF Charts
CL Daily View
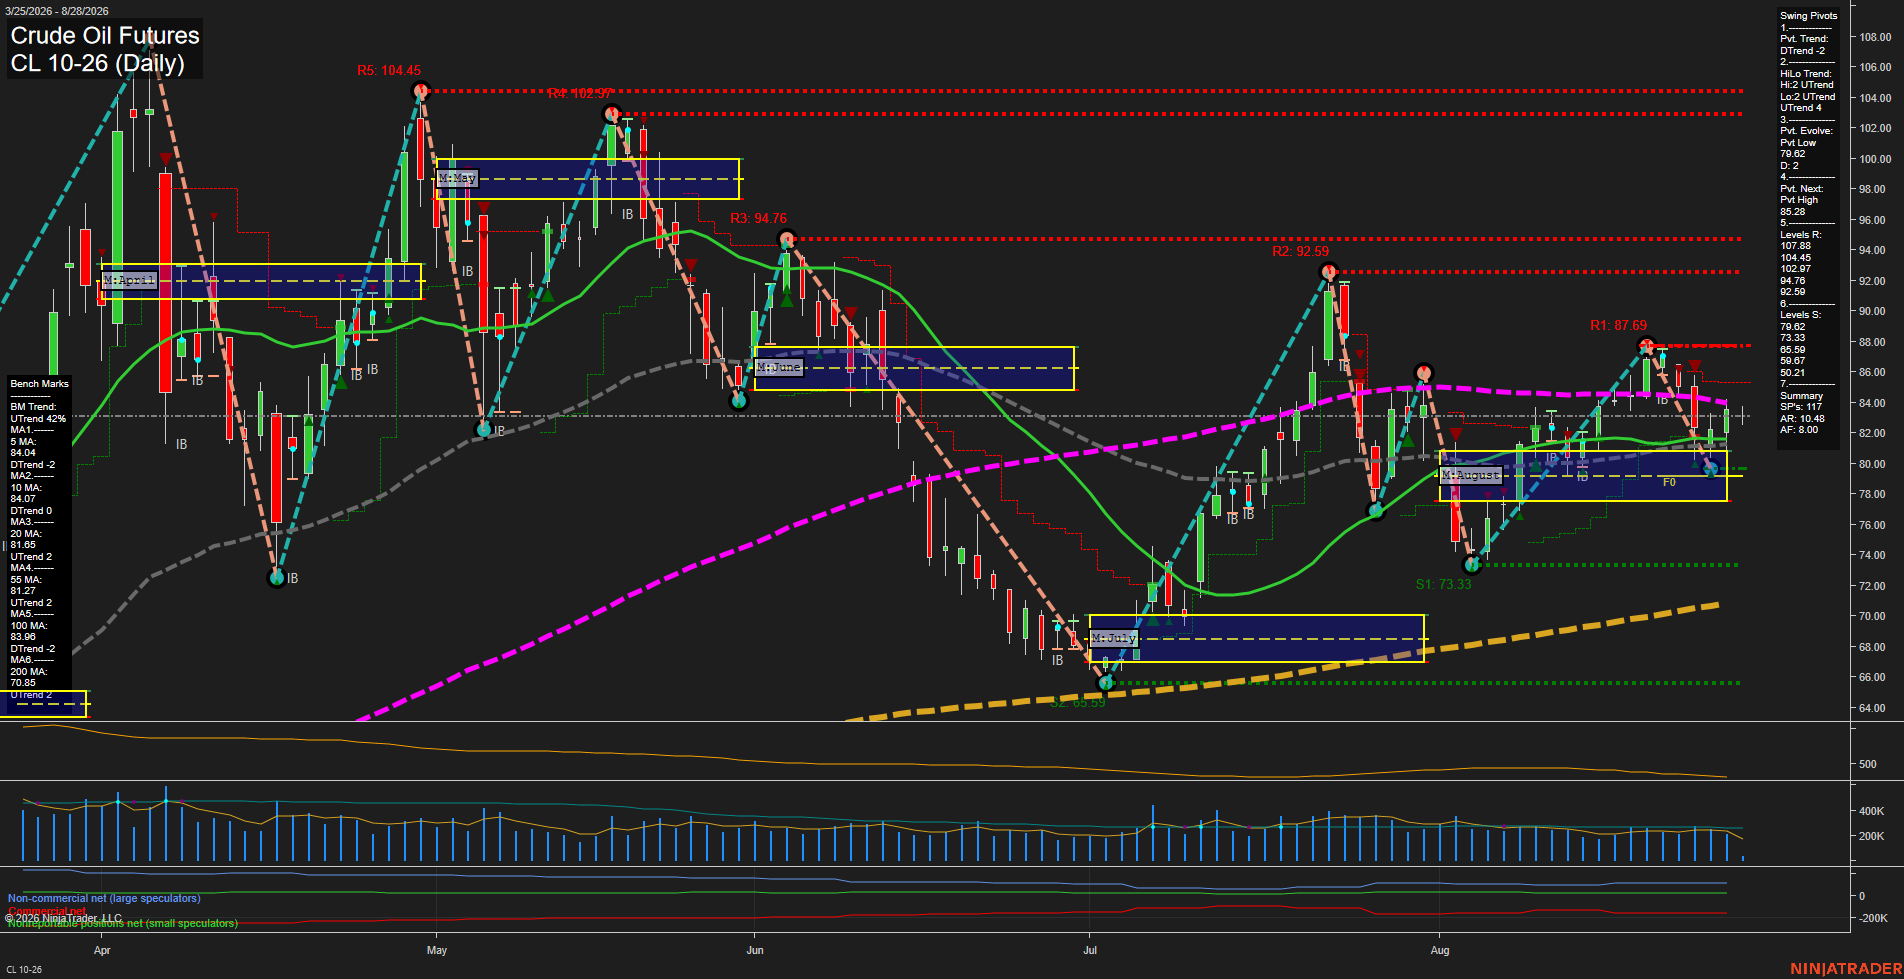
Overall Rating
- Short-Term: Bearish
- Intermediate-Term: Bullish
- Long-Term: Bullish.
Key Insights Summary
CL is consolidating with small, slower-momentum daily bars after a rejection from the 87.69 swing-high area. The short-term structure is corrective: price is below the weekly F0% area, the pivot trend is down, and the 5- and 10-day benchmarks slope lower. Intermediate structure remains constructive because price holds above the rising 20- and 55-day averages, the monthly grid remains positive, and the HiLo pivot trend is still up. The 79.62 pivot support and 79.02 pivot-evolve level define the nearby structural floor, while 85.28 is the next pivot reversal threshold and 87.69 is the more prominent overhead swing resistance. Long-term conditions remain positively aligned with the annual grid and rising 200-day benchmark, although the declining 100-day average at 83.90 reflects unresolved overhead supply.
View charts on: AlphaWebTrader HTF Charts
GC Daily View
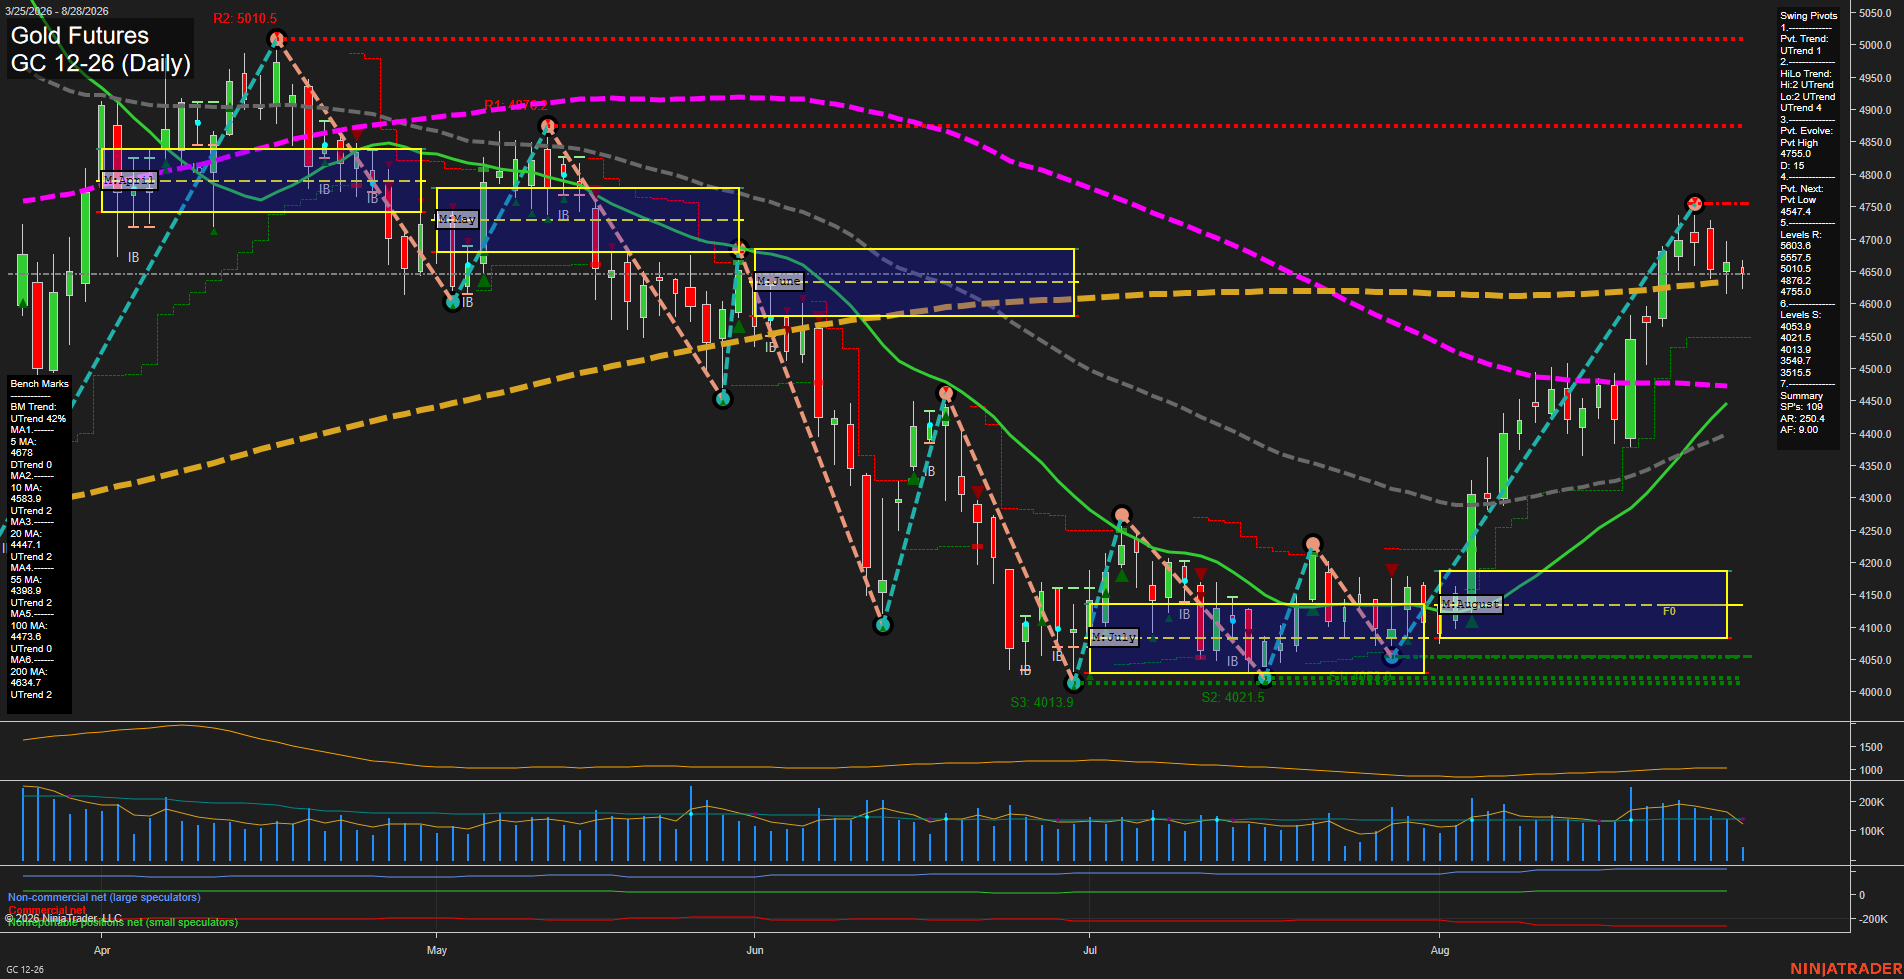
Overall Rating
- Short-Term: Neutral
- Intermediate-Term: Bullish
- Long-Term: Neutral.
Key Insights Summary
Gold remains in an intermediate pivot uptrend following the August advance from the 4050 area, with price holding above the rising 10-, 20-, 55-, 100-, and 200-day benchmarks. The recent push into the 4758 pivot high was rejected and has produced small, consolidating daily bars near the 5-day average, while the weekly fib-grid condition remains down and recent short-term signals are negative. This creates a mixed short-term structure beneath 4755.5-4758 resistance, while the broader August recovery remains intact above the 4547.4 pivot-reversal level and the rising intermediate moving-average cluster.
View charts on: AlphaWebTrader HTF Charts