NYSE pre-market radar tracks ETF movers and bearish futures signals as Hormuz disruption concerns lift oil, yields and September valuation pressure.
Fundamentals: Middle East conflict and reported tanker strikes near the Strait of Hormuz are lifting crude prices and global bond yields as energy-driven inflation concerns return to focus. The S&P 500 enters September after a strong August, while elevated valuations, technology concentration and higher borrowing costs add pressure. ISM manufacturing data and JOLTS job openings are scheduled.
Technicals: The NYSE pre-market session shows mixed prior ETF performance, led by gains in Tesla, USO and IBIT, while Microsoft, Alphabet and Amazon declined. Futures technical reviews identify bearish short- and intermediate-term conditions across ES, NQ, YM, EMD, RTY and FDAX following recent pullbacks, while longer-term trend structures remain broadly bullish.
Pre-Market Trading 360° view Market Radar of: holidays, earnings, eco-news, market-news summary, news sentiment, prior session major ETFs, MAG7, Higher Time Frame Analysis Indices Futures Summary, and E-mini S&P500, Nasdaq 100, NYMEX Crude, Gold Futures Daily Chart analysis.
As of: September 1, 2026 07:16 CT
Holiday Radar
- 2026-09-07 Labor Day
Earnings Radar
Monitoring for earnings releases by the Magnificent 7, AI-tech-related firms, and major financial institutions.
- AVGO Release: 2026-09-02 T:AMC
- SNOW Release: 2026-09-02 T:AMC
Conclusion: Broadcom (AVGO) reports after the close on Sept. 2, placing semiconductor and AI-infrastructure earnings in focus for index futures; Snowflake (SNOW) also reports AMC, adding enterprise software and cloud-data exposure. Market momentum and volume can slow ahead of these major tech earnings releases.
For full details visit: Yahoo Earnings Calendar
EcoNews Radar U.S. Events
| Day | Time | Impact | Event |
|---|---|---|---|
| Tue | 10:00 | High | ISM Manufacturing PMI |
| Tue | 10:00 | Medium | ISM Manufacturing Prices |
| Tue | 10:00 | Medium | JOLTS Job Openings |
| Wed | 08:15 | Medium | ADP Non-Farm Employment Change |
| Wed | 10:30 | Low | Crude Oil Inventories |
| Thu | 08:30 | Medium | Unemployment Claims |
| Thu | 10:00 | Medium | ISM Services PMI |
| Fri | 08:30 | High | Average Hourly Earnings m/m |
| Fri | 08:30 | High | Non-Farm Employment Change |
| Fri | 08:30 | High | Unemployment Rate |
EcoNews Summary
The calendar centers on Tuesday’s high-impact manufacturing reading and Friday’s cluster of high-impact labor-market data. These releases provide key updates on business activity, wage growth, job creation, and unemployment conditions.
Event Notes:
- Tuesday 10:00 — ISM Manufacturing PMI: A survey-based index of U.S. manufacturing activity, including production, new orders, employment, and supplier deliveries. Indices traders monitor it for evidence of expansion or contraction in a cyclical sector of the economy.
- Friday 08:30 — Average Hourly Earnings m/m: Measures the monthly change in average employee pay. Traders monitor wage growth as an input into inflation and household-income conditions.
- Friday 08:30 — Non-Farm Employment Change: Measures the monthly change in employment outside the farm sector. It is monitored as a broad indicator of labor-market strength and economic activity.
- Friday 08:30 — Unemployment Rate: Measures the share of the labor force actively seeking work but unemployed. Traders monitor it for labor-market slack and changes in employment conditions.
Conclusion:
Friday is the most important day of the week, led by the 08:30 Non-Farm Employment Change release alongside Average Hourly Earnings and the Unemployment Rate. Tuesday’s 10:00 ISM Manufacturing PMI is also a major catalyst; news around the 10 AM time cycle acts as a catalyst for reversals or continuations.
For full details visit: Forex Factory EcoNews
Market News Summary:
September opens with Middle East conflict risk lifting oil and bond yields while equity momentum faces seasonal and valuation pressure.
Primary Drivers & Risks:
- Primary Driver: Hormuz supply disruption concerns
- Primary Risk: Rising yields and inflation fears
Tone:
Risk-sensitive, with energy-led inflation concerns.
Stock Market / ETFs / Indices:
The S&P 500 gained 2.6% in August, its strongest August since 2021, and is up 12.3% in 2026 despite an end-of-month decline. September seasonality, elevated S&P 500 CAPE valuation, rising borrowing costs, and pressure on Japanese chip shares temper the strong index backdrop. South Korean exports retained chip-led growth, while concentration in technology ETFs remains notable.
Geopolitical:
Renewed U.S.-Iran fighting returned Middle East tensions to market focus. Two Saudi oil supertankers were reported struck by projectiles while leaving the Strait of Hormuz, intensifying concern around regional shipping and crude flows.
Oil / Energy:
WTI and Brent extended gains above $90 after the Hormuz tanker reports, reaching their highest levels in nearly two weeks. Prolonged disruption risk to Middle East crude and LNG supplies supported prices, while record U.S. natural-gas output provided a domestic supply offset. Venezuela granted a U.S.-backed group 100-year concessions for 17 oil fields, though the broader U.S.-Venezuela arrangement has drawn producer concerns.
Gold / Metals:
Gold rose as softer U.S. data eased yield pressure and the dollar lost consistency, improving the macro backdrop for precious metals. Rising Fed hike expectations and approaching jobs data remained counterweights, alongside safe-haven demand tied to Iran tensions.
Fed / Financials:
Global bond yields climbed as higher oil prices reinforced inflation concerns and increased attention on future rate hikes. The U.S. 10-year Treasury yield reached its highest level since January 2025 as Middle East developments drove the move.
Macro / Other:
Higher energy costs have become a central inflation transmission channel from the Middle East conflict into global rates markets. Shein fell 7% in its Hong Kong debut, while private-equity activity included Veritas Capital’s $2.5 billion agreement to acquire Bodycote.
Conclusion:
Hormuz shipping disruptions and renewed U.S.-Iran conflict are driving crude higher. Rising oil prices are feeding inflation concerns and pushing global bond yields upward.
Strong August equity performance enters the historically weak September period alongside elevated valuations. Technology concentration, chip-sector weakness in Japan, and higher borrowing costs add cross-currents for index markets.
Market News Sentiment
Market News Articles: 36
- Negative: 41.67%
- Neutral: 30.56%
- Positive: 27.78%
Sentiment Summary: Of 36 market news articles, 42% were negative, 31% neutral, and 28% positive, indicating a negative news skew.
Conclusion: Indices futures day traders are facing a news flow environment with more negative than positive coverage.
GLD,Gold Articles: 9
- Negative: 55.56%
- Positive: 33.33%
- Neutral: 11.11%
Sentiment Summary: GLD/Gold coverage is predominantly negative at 56%, with 33% positive and 11% neutral across 9 articles.
Conclusion: Gold-related news sentiment is net negative, indicating a cautious tone in the available coverage for indices futures day traders.
USO,Oil Articles: 14
- Positive: 50.00%
- Negative: 35.71%
- Neutral: 14.29%
Sentiment Summary: USO/Oil coverage is moderately positive, with 50% positive, 36% negative, and 14% neutral articles across 14 reports.
Conclusion: Oil-related news tone is mixed but leans positive, providing a modest supportive sentiment backdrop for indices futures.
Market Data Snapshot
ETF Snapshot of major stock market ETFs, Mag7, and others as of: September 1, 2026 07:16
Top Movers & Losers
- TSLA 367.95 Bullish 5.51% ▲
- USO 133.70 Bullish 3.08% ▲
- IBIT 44.67 Bullish 1.75% ▲
- MSFT 507.29 Bearish -1.22% ▼
- GOOG 335.41 Bearish -2.18% ▼
- AMZN 259.77 Bearish -2.50% ▼
Major Index ETFs: SPY, QQQ, DIA, IWM, IJH
- QQQ 716.76 Bullish 0.05% ▲
- SPY 767.05 Bearish -0.30% ▼
- IJH 75.35 Bearish -0.54% ▼
- IWM 293.93 Bearish -0.62% ▼
- DIA 531.57 Bearish -0.65% ▼
Mixed major-index ETF tone: QQQ is the most bullish mover at +0.05%, a marginal gain, while DIA is the most bearish mover at -0.65%. SPY is down -0.30%, with broader weakness in IJH at -0.54% and IWM at -0.62%.
Mag 7 Stocks: AAPL, MSFT, GOOG, AMZN, META, NVDA, TSLA
- TSLA 367.95 Bullish 5.51% ▲
- NVDA 220.78 Bullish 1.48% ▲
- AAPL 316.85 Bearish -0.89% ▼
- META 572.34 Bearish -0.98% ▼
- MSFT 507.29 Bearish -1.22% ▼
- GOOG 335.41 Bearish -2.18% ▼
- AMZN 259.77 Bearish -2.50% ▼
Mixed Mag7 snapshot: TSLA is the most bullish mover at +5.51%, followed by NVDA at +1.48%. AMZN is the most bearish mover at -2.50%, with GOOG also Bearish at -2.18%. AAPL -0.89%, META -0.98%, and MSFT -1.22% remain Bearish.
Cross-Market ETFs: TLT, GLD, USO, IBIT
- USO 133.70 Bullish 3.08% ▲
- IBIT 44.67 Bullish 1.75% ▲
- GLD 408.42 Bearish -0.11% ▼
- TLT 82.52 Bearish -0.43% ▼
Other ETFs are Mixed: USO is the most bullish mover at +3.08%, followed by IBIT at +1.75%. TLT is the most bearish mover at -0.43%, while GLD is marginally lower at -0.11%.
ETF, Mag7, and Cross-Market ETF Insights
Overall Tone
Mixed: broad equity ETFs were Bearish while selective leadership in TSLA, NVDA, USO, and IBIT remained Bullish.
Equity ETFs and Mag7:
Major Index ETFs were broadly Bearish, led lower by DIA at -0.65%, IWM at -0.62%, and IJH at -0.54%; QQQ was marginally Bullish at +0.05%, while SPY declined -0.30%. Mag7 performance was selective: TSLA was the most bullish mover at +5.51%, followed by NVDA at +1.48%, while AMZN was the most bearish mover at -2.50%, with GOOG at -2.18% and MSFT at -1.22%. Equity leadership was concentrated rather than broadly aligned.
Cross-Market ETFs:
Cross-market ETFs were Mixed, with USO the most bullish mover at +3.08% and IBIT also Bullish at +1.75%. TLT was the most bearish mover at -0.43%, while GLD was marginally Bearish at -0.11%. Commodity and bitcoin strength diverged from Bearish broad equity ETFs and declining defensive ETFs.
Futures Indices – Higher Time Frame Analysis
Summary of the current state of US Indices Futures based on higher time-frame (HTF) technical analysis as of: 2026-09-01: 07:16 CT.
US Indices Futures
- ES YSFG above F0%, MSFG/WSFG below F0%, benchmarks mixed, pivots 7648.50 support/7838.50 resistance, short-term DTrend.
- NQ YSFG constructive, MSFG/WSFG below F0%, benchmarks hold long-term support, pivots 29013.50 support/30343.00 resistance, intermediate DTrend.
- YM YSFG above F0%, MSFG/WSFG corrective, benchmarks rising long-term, pivots 52812 support/53862 resistance, short-term DTrend.
- EMD YSFG constructive, MSFG/WSFG below F0%, benchmarks weak through 100-day, pivots 3724.0 support/3941.7 resistance, fast downswing.
- RTY YSFG constructive, MSFG/WSFG below F0%, benchmarks retain long-term rise, pivots 2940.5 support/3006.7 reversal, 3079.9 resistance.
- FDAX YSFG constructive, MSFG/WSFG below F0%, benchmarks rising long-term, pivots 25965 support/26665 resistance, short-term DTrend.
Overall State
- Short-Term: Bearish
- Intermediate-Term: Bearish
- Long-Term: Bullish
Conclusion
All six contracts show aligned short-term corrective pressure, with MSFG and WSFG positioning generally below F0% and recent short signals. ES, NQ, YM, EMD, RTY, and FDAX retain broadly bullish yearly structures through rising longer-term benchmarks. Current pivot-support tests define the active retracement phase; August swing highs remain shared overhead resistance references.
Note: Intra-day counter-trend pullbacks or retracements may occur, HTF is context for informational usage and market structure. Glossary: Session Fib Grids periods of YSFG:’Yearly’, MSFG:’Monthly’, WSFG:’Weekly’
For full details visit: AlphaWebTrader Technicals
ES Daily View
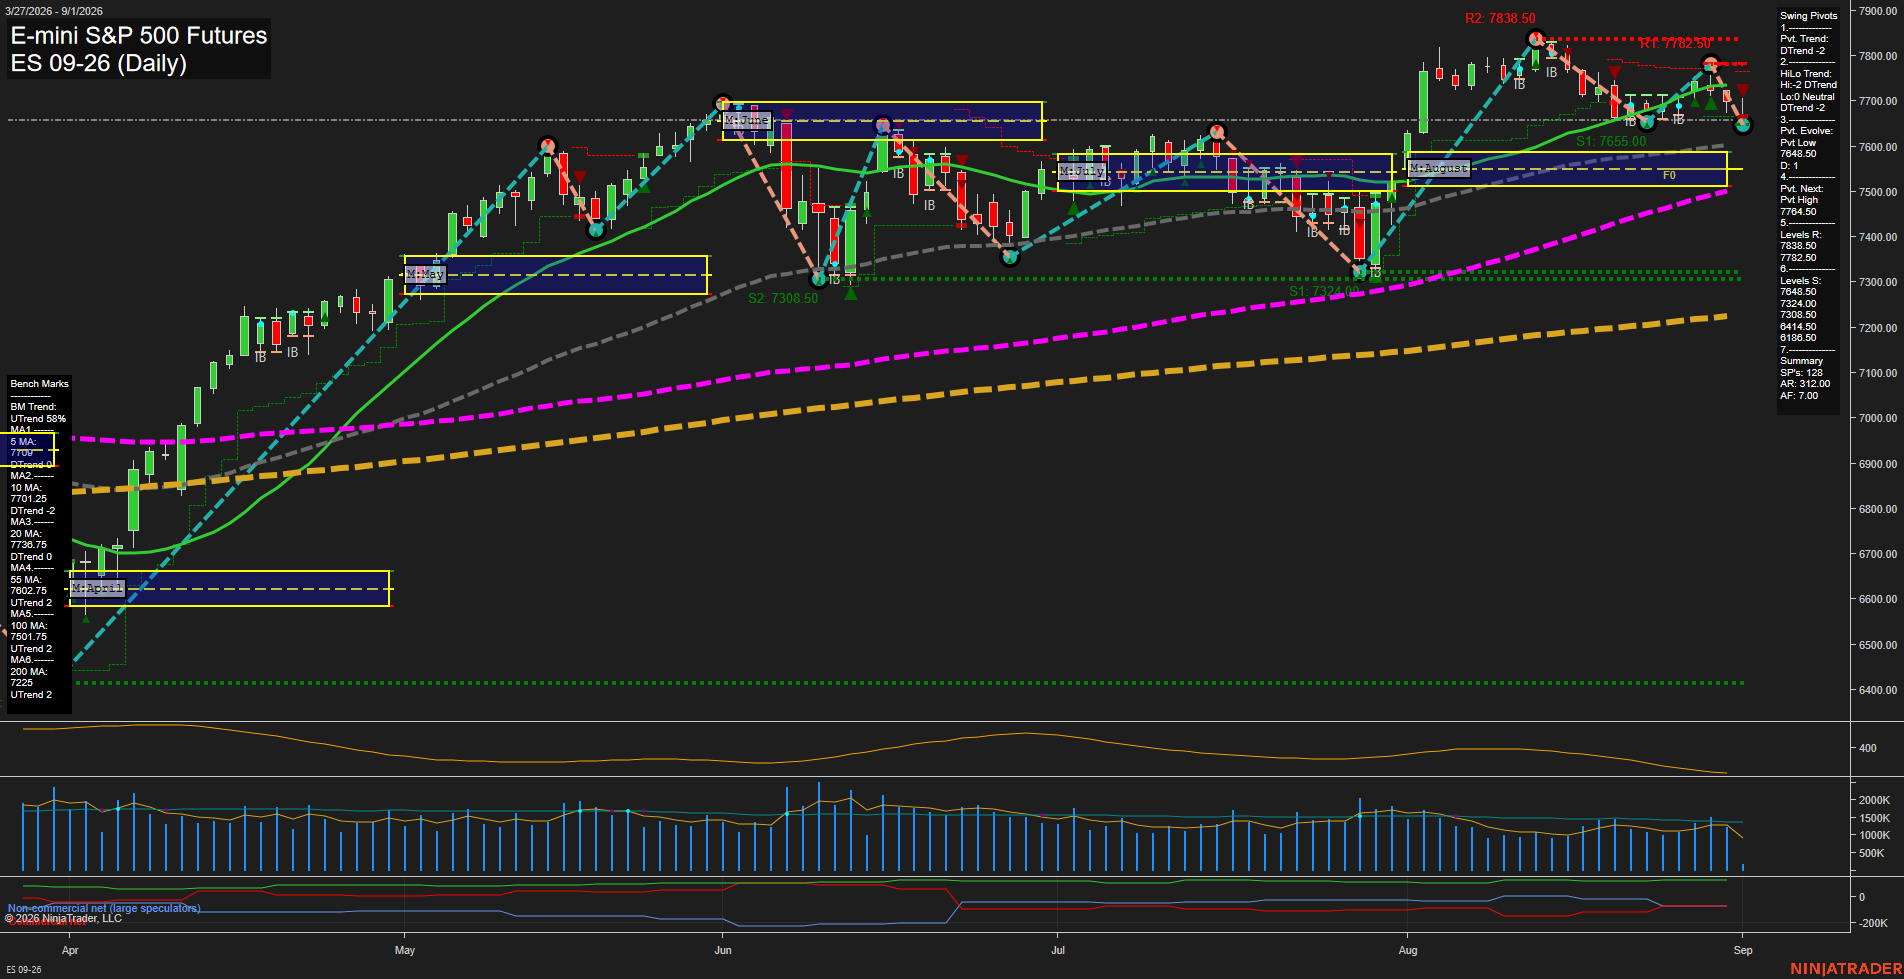
Overall Rating
- Short-Term: Bearish
- Intermediate-Term: Bearish
- Long-Term: Bullish.
Key Insights Summary
Price has rolled over sharply from the 7838.50 swing-high region, creating a short-term lower-high and lower-low sequence. The close beneath the weekly and monthly Fib-grid centers, the declining 5-, 10-, and 20-day benchmarks, and aligned DTrend pivot readings define the active swing structure as bearish. The 7648.50 pivot-low support is the immediate structural reference, while 7782.50 and 7838.50 remain the overhead pivot-resistance zone. Longer-term structure remains constructive because price is still above rising 55-, 100-, and 200-day benchmarks and the yearly Fib-grid bias remains positive; the current move is therefore a meaningful intermediate pullback within a broader long-term uptrend. Declining ATR from the late-August peak indicates volatility compression following the reversal, while volume remains active relative to recent sessions.
View charts on: AlphaWebTrader HTF Charts
NQ Daily View
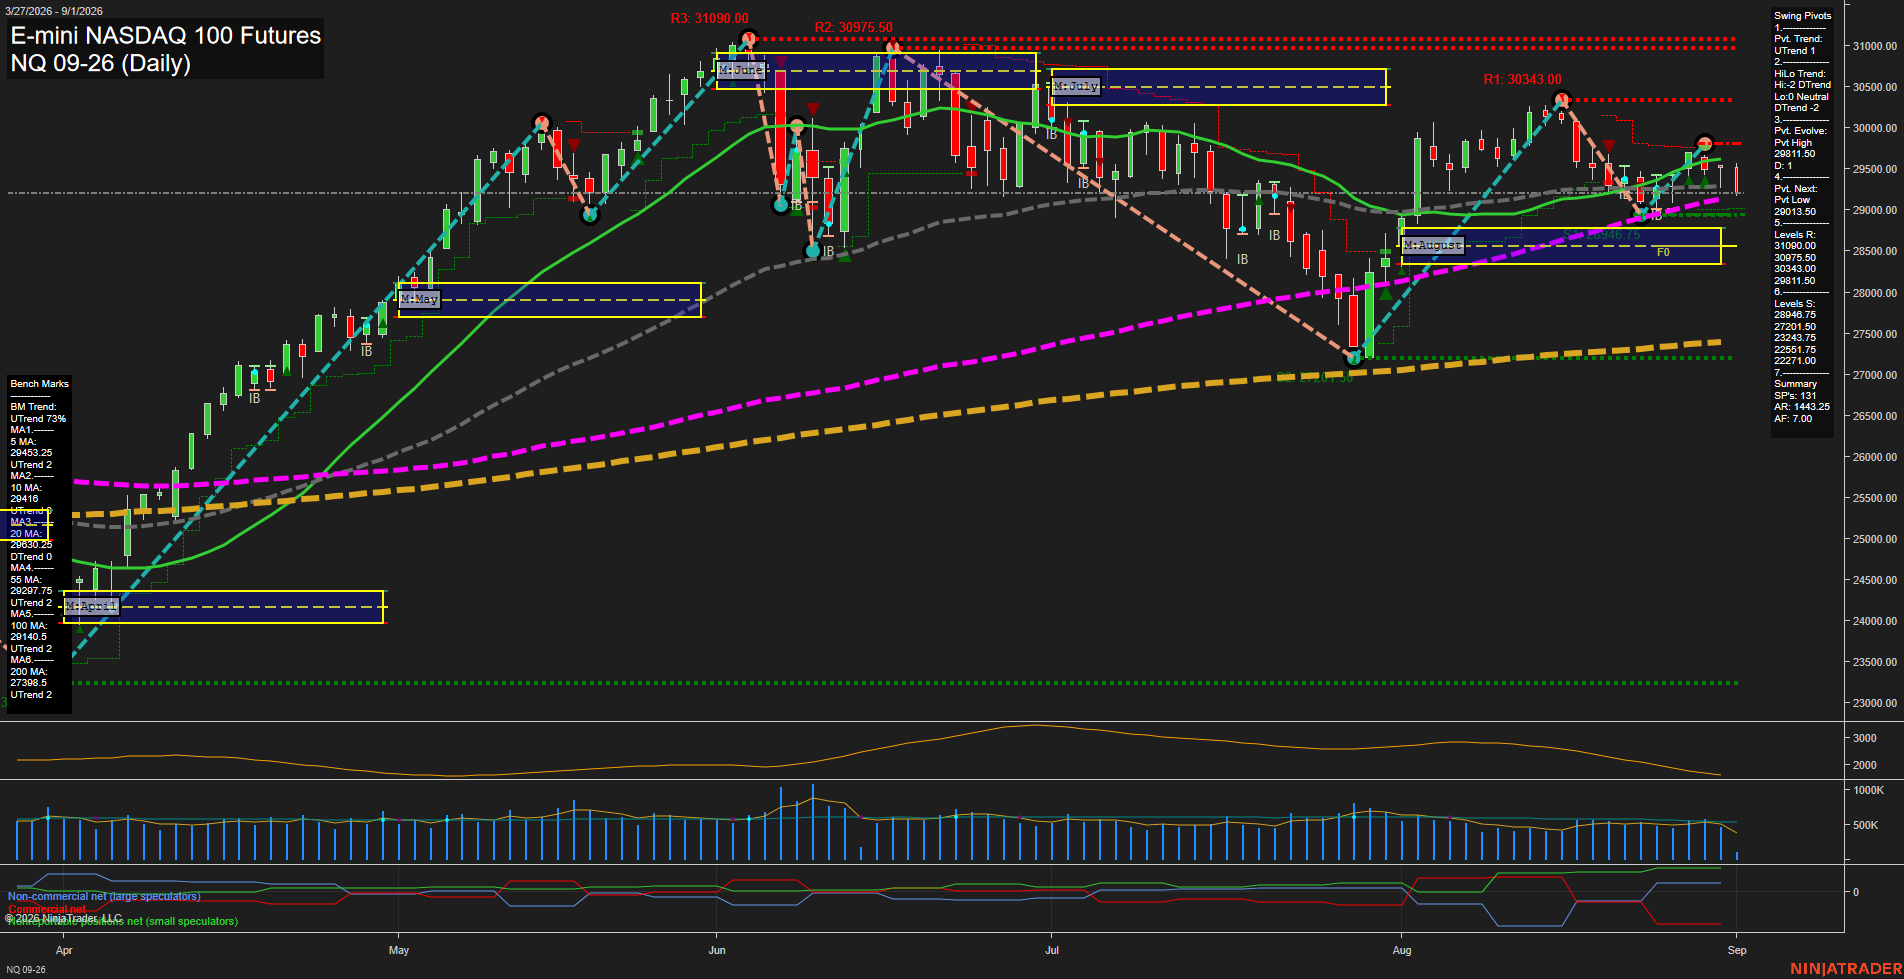
Overall Rating
- Short-Term: Bearish
- Intermediate-Term: Bearish
- Long-Term: Bullish.
Key Insights Summary
Price is consolidating beneath the weekly and September monthly F0% reference areas after a sharp August recovery, leaving short-term action choppy with muted momentum. The active short-term pivot remains upward, but the intermediate pivot structure remains in a downtrend and the recent advance stalled below 30343 resistance. Price is holding near the 55-day and 100-day benchmarks while remaining above the rising 200-day average, preserving the broader 2026 uptrend. The 29864.25 pivot high and 30343.00 resistance define the overhead recovery zone, while 29013.50 and 28946.75 form the nearest downside pivot-support area.
View charts on: AlphaWebTrader HTF Charts
CL Daily View
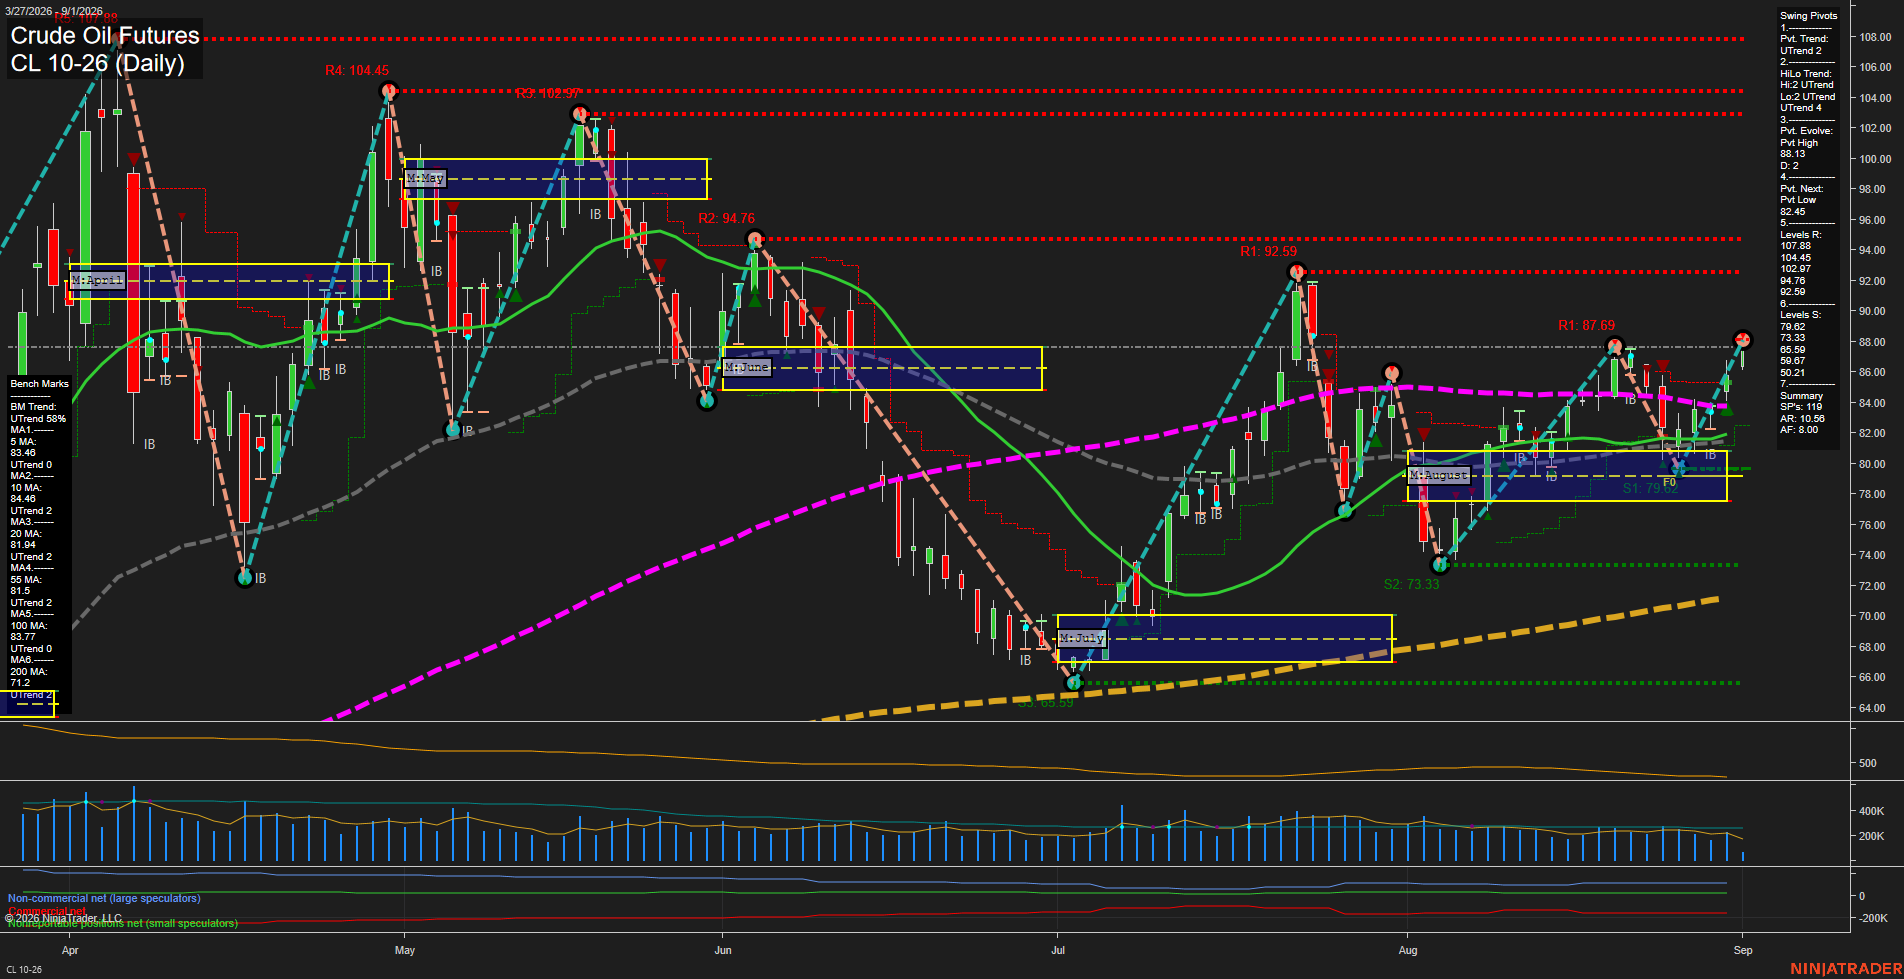
Overall Rating
- Short-Term: Bullish
- Intermediate-Term: Bullish
- Long-Term: Bullish.
Key Insights Summary
Price is extending a sharp late-August recovery into the 87.69 pivot-resistance area, with the latest advance holding above all six daily benchmark averages. The swing-pivot structure is UTrend on both short- and intermediate-term measures, supported by higher lows from the 73.33 August low and a new evolving pivot high at 88.13. The 82.45 pivot-next level defines the nearest structural reversal threshold, while 92.59 and 94.76 are the next overhead pivot-resistance references. Fast upside momentum and the price position above the weekly, monthly, and yearly Fib-grid centers align with a broad bullish continuation phase, although the immediate move is testing a prior swing-high zone after a rapid rally.
View charts on: AlphaWebTrader HTF Charts
GC Daily View
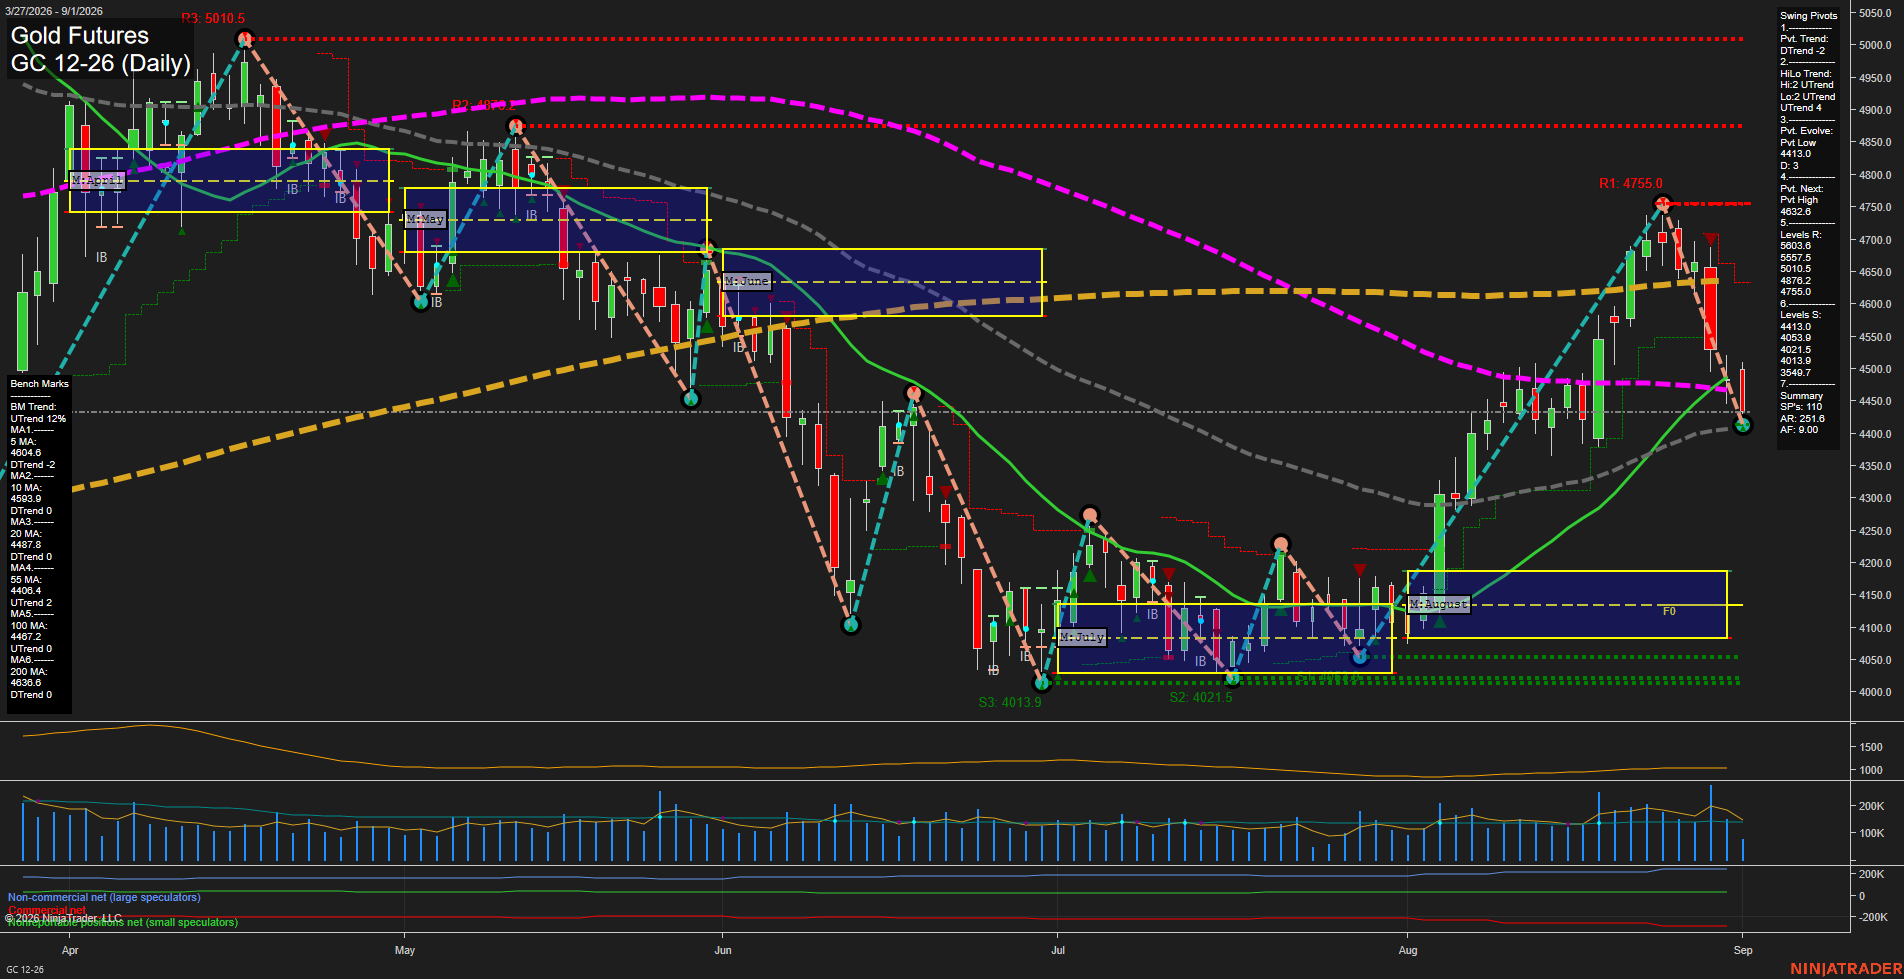
Overall Rating
- Short-Term: Bearish
- Intermediate-Term: Bearish
- Long-Term: Bearish.
Key Insights Summary
GC has undergone a fast, high-volatility reversal from the 4755 pivot high into the 4413 pivot-low area. Price remains below the 5-, 10-, 20-, 100-, and 200-day benchmarks, while the weekly and monthly Fib-grid structures are both down. The short-term pivot sequence is bearish despite the intermediate HiLo structure remaining upward, reflecting a sharp countertrend selloff within a previously broader recovery. The 4408 55-day average and 4413 pivot-low area form a tightly clustered near-term reference zone, while 4487 to 4467 marks overhead moving-average resistance. Volume expanded during the decline, consistent with an impulsive liquidation phase rather than a quiet consolidation.
View charts on: AlphaWebTrader HTF Charts