NYSE pre-market futures show short-term pressure as Hormuz tensions lift oil above $90 and Fed hike pricing weighs on equities, metals and currencies.
Fundamentals: Renewed Middle East escalation and concerns over disruption through the Strait of Hormuz pushed Brent crude above $90 a barrel, while increased expectations for Federal Reserve rate hikes weighed on equities, metals and currencies. Japan’s Nikkei declined, China’s manufacturing PMI remained below 50, and French borrowing costs highlighted broader macro and financial risks.
Technicals: U.S. index futures enter the NYSE pre-market session with short-term bearish or mixed conditions across major contracts, despite broadly constructive intermediate- and long-term trends. ES, NQ, YM and RTY are consolidating below recent highs, while EMD shows a sharper pullback. FDAX remains near resistance, and Microsoft gained 1.68% in the prior session.
Pre-Market Trading 360° view Market Radar of: holidays, earnings, eco-news, market-news summary, news sentiment, prior session major ETFs, MAG7, Higher Time Frame Analysis Indices Futures Summary, and E-mini S&P500, Nasdaq 100, NYMEX Crude, Gold Futures Daily Chart analysis.
As of: August 31, 2026 07:16 CT
Holiday Radar
- 2026-09-07 Labor Day
EcoNews Radar U.S. Events
| Day | Time | Impact | Event |
|---|---|---|---|
| Tue | 10:00 | High | ISM Manufacturing PMI |
| Tue | 10:00 | Medium | ISM Manufacturing Prices |
| Tue | 10:00 | Medium | JOLTS Job Openings |
| Wed | 08:15 | Medium | ADP Non-Farm Employment Change |
| Wed | 10:30 | Low | Crude Oil Inventories |
| Thu | 08:30 | Medium | Unemployment Claims |
| Thu | 10:00 | Medium | ISM Services PMI |
| Fri | 08:30 | High | Average Hourly Earnings m/m |
| Fri | 08:30 | High | Non-Farm Employment Change |
| Fri | 08:30 | High | Unemployment Rate |
EcoNews Summary
High-impact U.S. manufacturing and labor-market releases define the week’s primary scheduled economic catalysts for index futures. Tuesday’s manufacturing data provides a snapshot of factory-sector conditions, while Friday’s employment releases deliver a broad update on job growth, wages, and unemployment.
Event Notes:
- Tuesday 10:00 ISM Manufacturing PMI: A survey-based index of U.S. manufacturing activity, including production, new orders, employment, and supplier deliveries. Traders monitor it for evidence of expansion or contraction in the factory sector and broader economic momentum.
- Friday 08:30 Average Hourly Earnings m/m: Measures the monthly change in average employee pay. Traders monitor wage growth as an inflation and household-income indicator.
- Friday 08:30 Non-Farm Employment Change: Measures the monthly change in U.S. employment outside agricultural work. Traders monitor it as a major gauge of labor-market strength and economic activity.
- Friday 08:30 Unemployment Rate: Measures the share of the labor force actively seeking work but unemployed. Traders monitor it for labor-market slack and changes in employment conditions.
Conclusion:
The single most important event of the week is Friday’s 08:30 Non-Farm Employment Change, released alongside Average Hourly Earnings and the Unemployment Rate. This concentrated labor-market release provides a broad view of employment growth, wage trends, and workforce conditions.
For full details visit: Forex Factory EcoNews
Market News Summary:
Middle East escalation lifted crude prices as rising Fed rate-hike pricing pressured global equities, metals, and currencies.
Primary Drivers & Risks:
- Primary Driver: Hormuz supply disruption concerns
- Primary Risk: Rising Fed rate-hike odds
Tone:
Risk-sensitive, with inflation and geopolitical pressures dominating.
Stock Market / ETFs / Indices:
Japan’s Nikkei fell 2.2%, led by chip stocks, after Fed Chair Kevin Warsh’s inflation remarks increased rate-hike expectations. Technology shares face sensitivity to higher rates, while strong corporate profits and resilient consumer spending provide an offsetting equity backdrop.
Geopolitical:
U.S. forces struck Iranian rocket launchers on Larak Island in the Strait of Hormuz, marking the first reported American strikes on Iran since late July. The Treasury Department outlined recurring secondary sanctions targeting Iran, initially focused on banks.
Oil / Energy:
Brent crude moved back above $90 a barrel after the Larak Island strike heightened concerns over Gulf supply disruption. Hormuz-related risk premiums returned, while increased Asian diesel exports to Africa reflected reduced Middle Eastern shipments. A prospective Venezuela oil arrangement does not address near-term disruption from Hormuz.
Gold / Metals:
Gold and silver remained under pressure as higher Treasury yields, a firmer dollar, and increased Fed tightening expectations outweighed competing safe-haven demand. Gold fell below $4,600 amid profit-taking after its prior rally, with cited support near $4,350.
Fed / Financials:
Fed funds futures priced a nearly 56% probability of a quarter-point September rate increase, while one bank forecast 50 basis points of hikes across September and December. Higher-rate expectations weighed on Asian currencies and raised concern over technology valuations. French borrowing costs approached 2008-era highs amid fiscal and political risk, while private-credit fund loan overlap remained elevated.
Macro / Other:
China’s official manufacturing PMI improved to 49.8 in August but remained below the 50 expansion threshold for a second month. September seasonality also shows historical average declines for major U.S. equity indexes.
Conclusion:
Crude’s advance on renewed Gulf conflict and Hormuz supply concerns is the main cross-asset catalyst. Rising Fed rate-hike pricing remains the central pressure point for equity futures, technology shares, and metals.
China’s manufacturing contraction and French sovereign-debt stress add macro and financial-risk context. Strong U.S. corporate profits and consumer resilience provide a counterweight to the risk-off headlines.
Market News Sentiment
Market News Articles: 24
- Negative: 41.67%
- Neutral: 33.33%
- Positive: 25.00%
Sentiment Summary: Market news sentiment is mixed but negative-leaning, with 42% negative, 33% neutral, and 25% positive coverage across 24 articles.
Conclusion: Indices futures day traders are facing a news backdrop with more negative than positive coverage, while neutral reporting remains substantial.
GLD,Gold Articles: 5
- Negative: 80.00%
- Neutral: 20.00%
Sentiment Summary: Gold-related coverage was predominantly negative, with 80% negative and 20% neutral articles across 5 articles.
Conclusion: The gold news tone was negative, indicating a risk-focused sentiment input for indices futures day traders.
USO,Oil Articles: 8
- Neutral: 50.00%
- Positive: 25.00%
- Negative: 25.00%
Sentiment Summary: USO/Oil coverage was balanced, with 50% neutral, 25% positive, and 25% negative articles.
Conclusion: Oil-related news tone was neutral overall, presenting no directional sentiment imbalance for indices futures day traders.
Market Data Snapshot
ETF Snapshot of major stock market ETFs, Mag7, and others as of: August 31, 2026 07:16
Top Movers & Losers
- MSFT 513.53 Bullish 1.68% ▲
Major Index ETFs: SPY, QQQ, DIA, IWM, IJH
Mag 7 Stocks: AAPL, MSFT, GOOG, AMZN, META, NVDA, TSLA
- MSFT 513.53 Bullish 1.68% ▲
MSFT is Bullish at 513.53, up +1.68%; it is the most bullish mover and, with all values positive, the least positive mover.
Cross-Market ETFs: TLT, GLD, USO, IBIT
ETF, Mag7, and Cross-Market ETF Insights
Overall Tone
Mixed, with the recorded equity move showing Bullish strength in MSFT at +1.68%.
Equity ETFs and Mag7:
Major Index ETFs are Mixed in this snapshot. Within Mag7, MSFT is Bullish at +1.68%, making it the most bullish and least positive recorded mover; broader equity alignment remains Mixed.
Cross-Market ETFs:
Cross-Market ETFs are Mixed. No Bullish or Bearish percentage mover is identified among TLT, GLD, USO, and IBIT in this snapshot.
Futures Indices – Higher Time Frame Analysis
Summary of the current state of US Indices Futures based on higher time-frame (HTF) technical analysis as of: 2026-08-31: 07:17 CT.
US Indices Futures
- ES YSFG/MSFG up, WSFG down, above 55/100/200 benchmarks, 7467 support, 7838.50 resistance; short-term pullback within rising pivots.
- NQ YSFG/MSFG up, WSFG down, above major benchmarks; 27201.50-27668 support, 29811.25-31090 resistance; corrective structure beneath weekly F0.
- YM YSFG/MSFG up, WSFG down; benchmarks broadly rising, 52812-53022 support, 53882 then 54884 resistance; compressed countertrend consolidation.
- EMD YSFG up, MSFG/WSFG down; below 5-55 benchmarks, above 100/200; 3772.6-3724 support, 3852 and 3941.7 resistance.
- RTY YSFG/MSFG up, WSFG down; below 5-20 benchmarks, above 55/200; 2983.3 then 2902.3 support, 3028.7 and 3079.9 resistance.
- FDAX YSFG/MSFG up, WSFG down; above all benchmarks, 26246 and 25965 support, 26602-26665 resistance; upward pivots with slowed momentum.
Overall State
- Short-Term: Bearish
- Intermediate-Term: Bullish
- Long-Term: Bullish
Conclusion
US index futures retain broadly upward yearly and monthly Fib Grid alignment, with long-term benchmark support and higher-order pivot structures generally intact. Weekly Fib Grids are down across the group, correlating with short-term retracements beneath recent swing highs. EMD shows the broadest downside benchmark alignment; ES, NQ, YM, RTY, and FDAX remain nearer consolidation or pullback structures within larger advances. Resistance is defined by August pivot highs, while listed pivot-reversal levels and support clusters frame current corrective ranges.
Note: Intra-day counter-trend pullbacks or retracements may occur, HTF is context for informational usage and market structure. Glossary: Session Fib Grids periods of YSFG:’Yearly’, MSFG:’Monthly’, WSFG:’Weekly’
For full details visit: AlphaWebTrader Technicals
ES Daily View
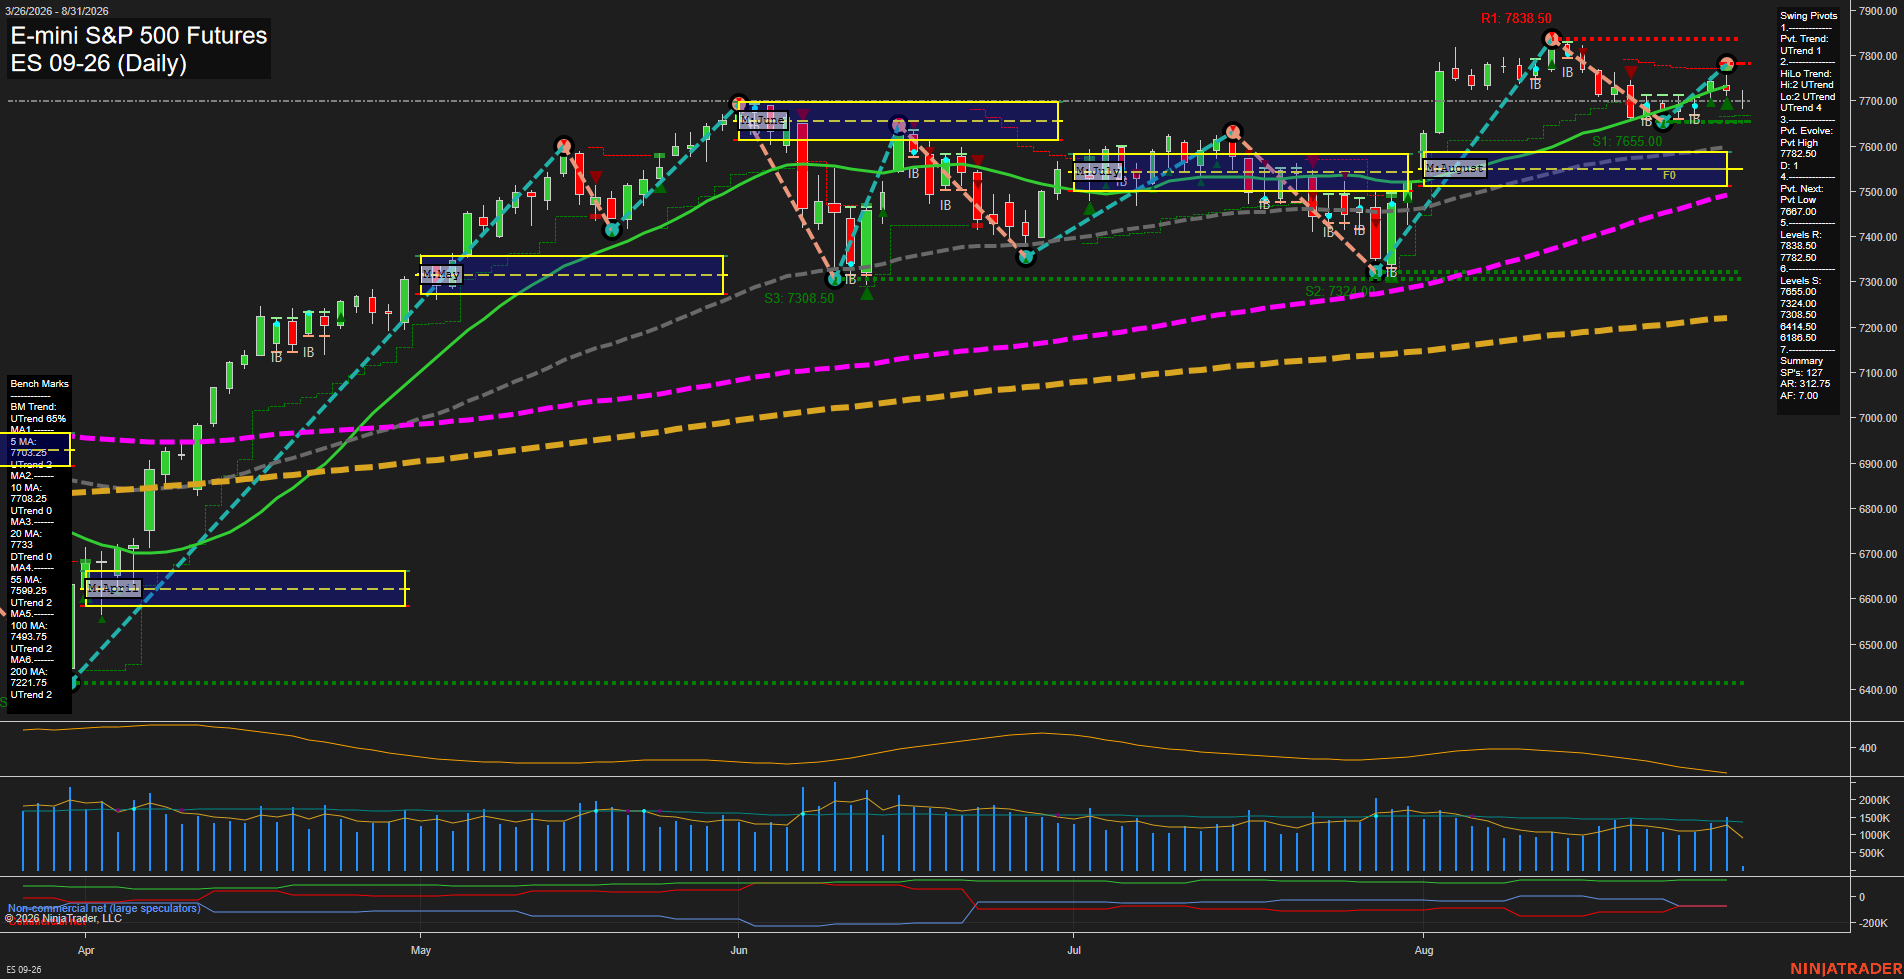
Overall Rating
- Short-Term: Bearish
- Intermediate-Term: Bullish
- Long-Term: Bullish.
Key Insights Summary
Price is consolidating beneath the 7782.50 pivot-high area after a sharp August advance, with the latest pullback placing the short-term weekly fib condition below its F0/NTZ reference. The pivot structure remains upward on both short- and intermediate-term measures, while price remains above the rising 55-, 100-, and 200-day benchmarks. Near-term action is mixed: the 20-day benchmark is declining and short signals align with a retracement phase, while 7655.00 is the nearest structural support and 7838.50 is the higher resistance threshold. Volatility remains elevated, supporting wider daily swings and a choppier consolidation character near recent highs.
View charts on: AlphaWebTrader HTF Charts
NQ Daily View
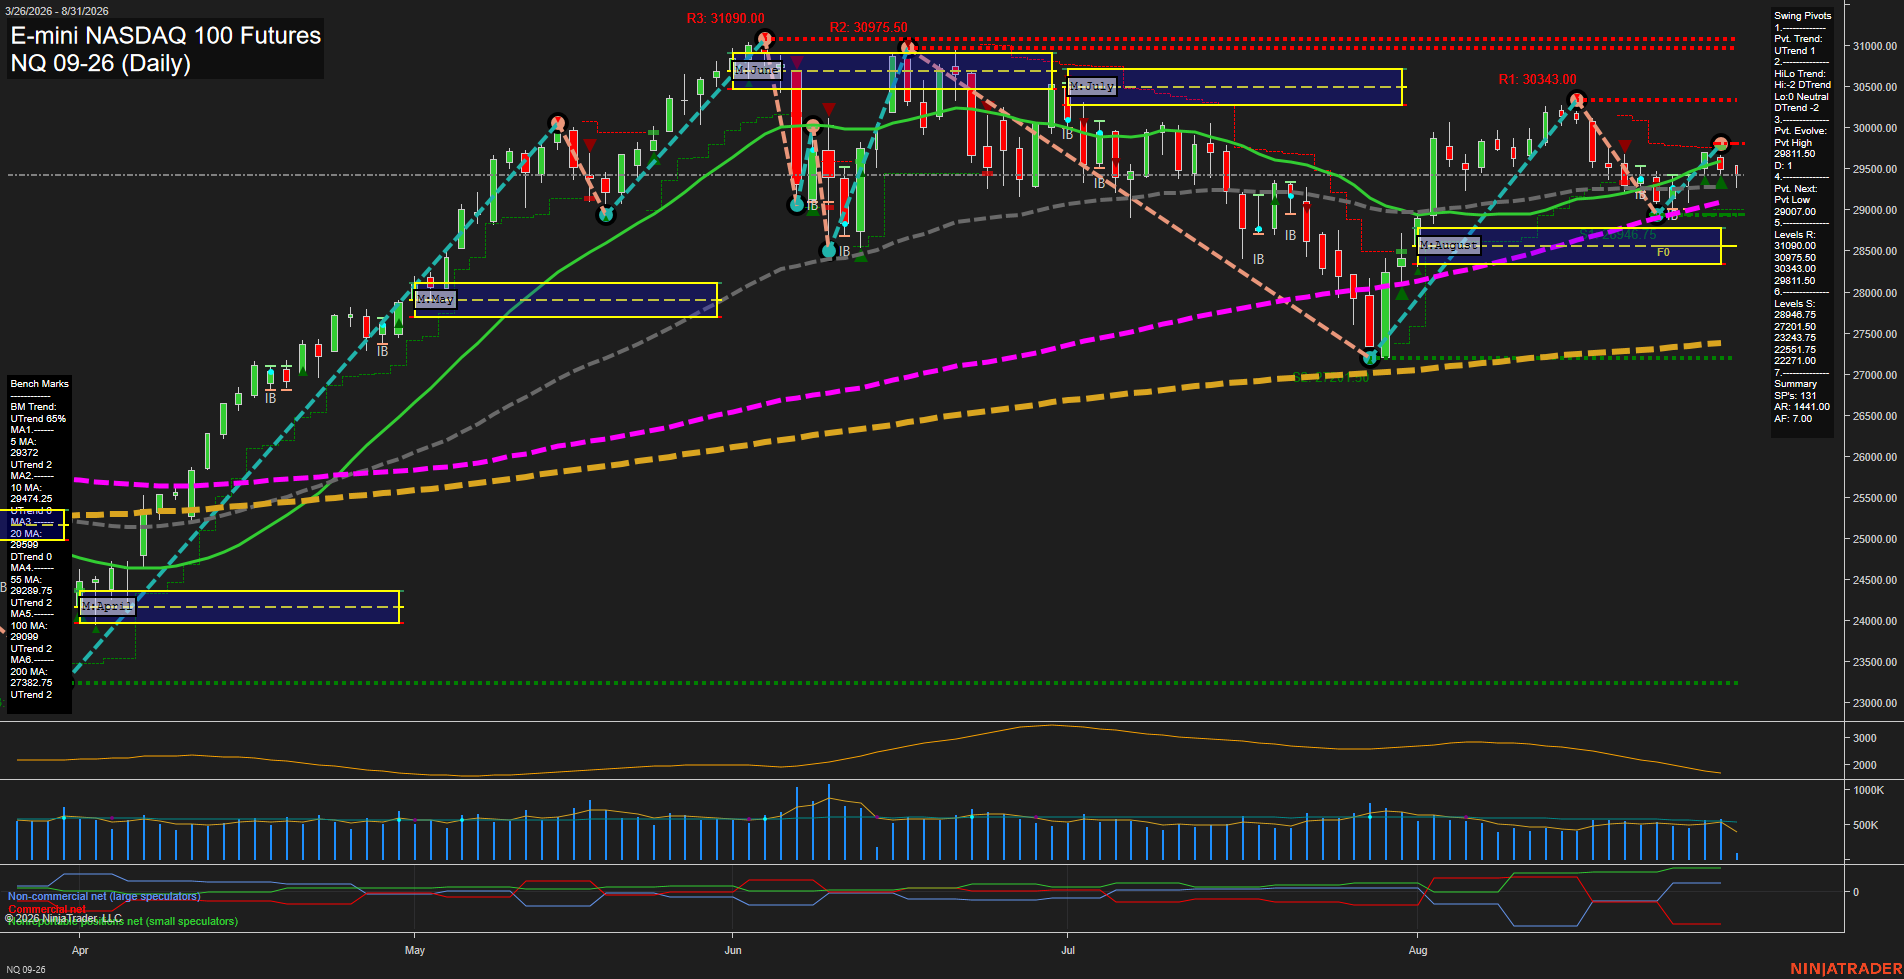
Overall Rating
- Short-Term: Bearish
- Intermediate-Term: Neutral
- Long-Term: Bullish.
Key Insights Summary
NQ is consolidating beneath the declining 20-day benchmark and below the weekly F0% area following rejection from the 29811.25 pivot high. The short-term pivot structure remains technically upward, but price action has softened into small-range bars with slowing momentum and recent short-term sell signals. Intermediate conditions are mixed: the August grid remains positive and price holds above the 55-day average, while the HiLo pivot trend and 20-day average remain down. The broader yearly structure remains constructive above rising 100-day and 200-day benchmarks, with 28946.75 and the 29007 pivot-reversal area defining the nearby structural support zone and 29811.25, 30343.00, and 30975.50 defining overhead swing resistance.
View charts on: AlphaWebTrader HTF Charts
CL Daily View
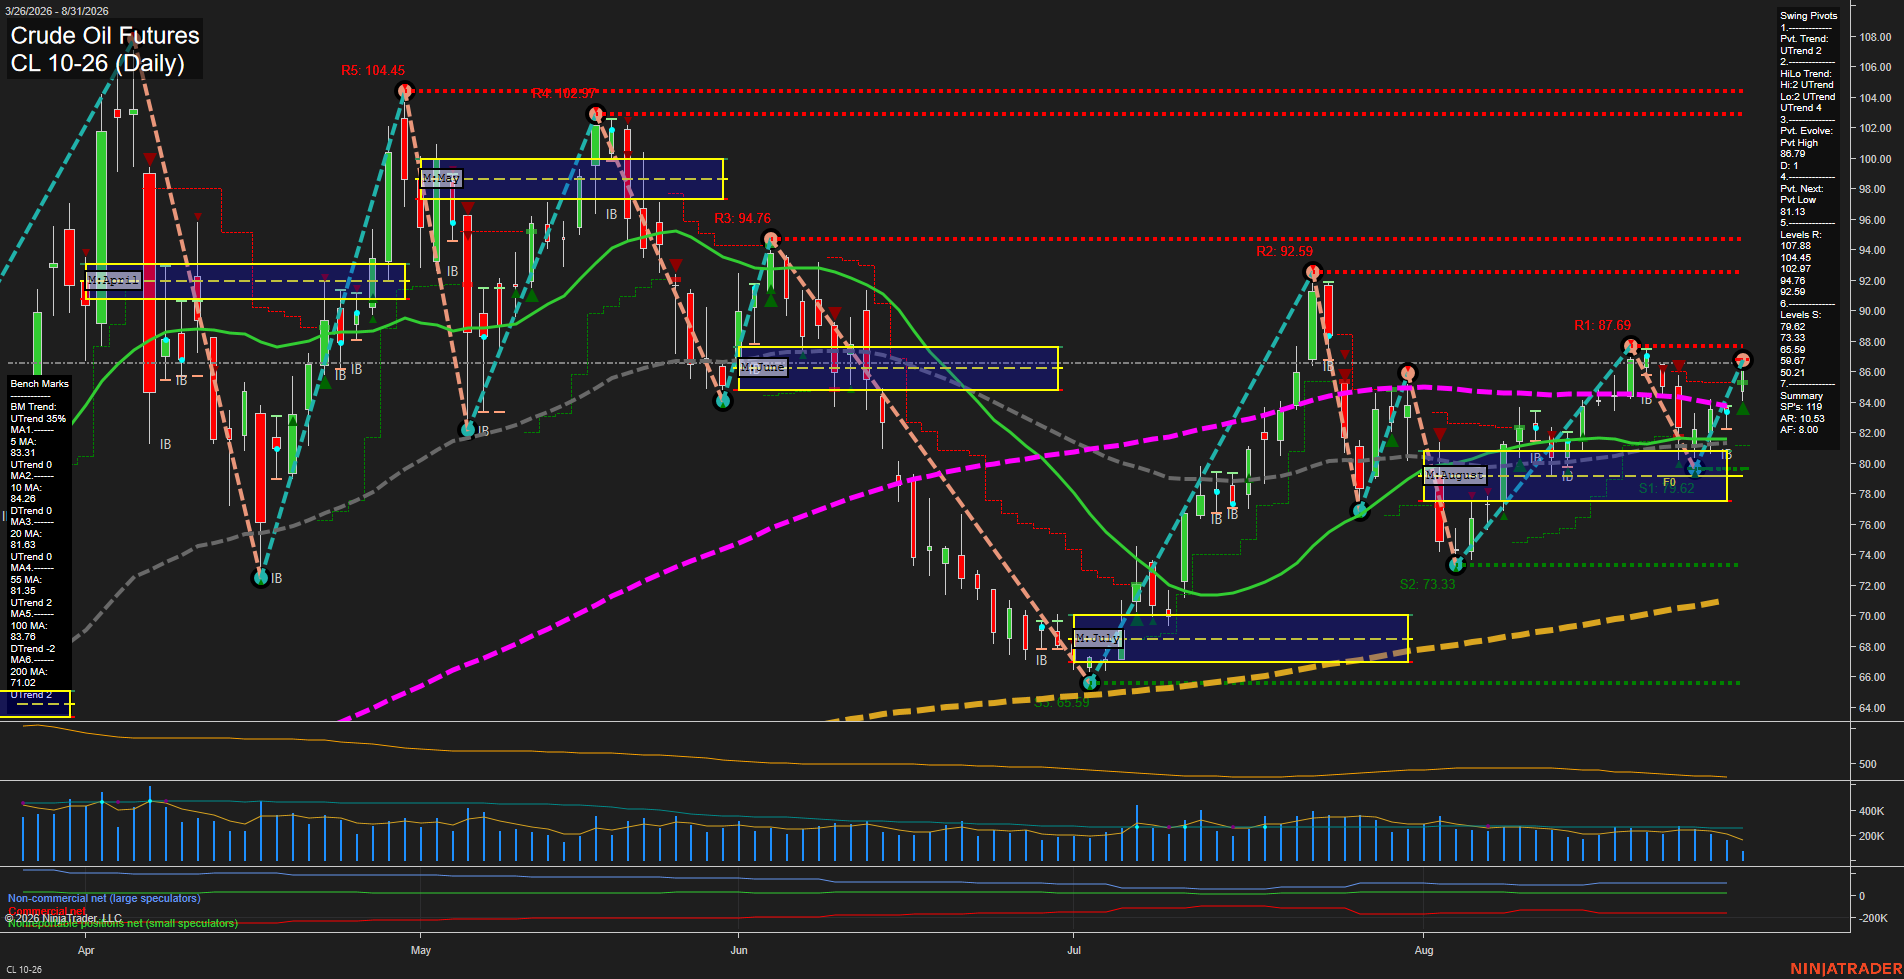
Overall Rating
- Short-Term: Bullish
- Intermediate-Term: Bullish
- Long-Term: Bullish.
Key Insights Summary
Price has extended its late-August recovery above the weekly and monthly Fib-grid centers, with a fast upswing from the 79.62 support area and higher swing lows preserving the bullish pivot structure. The 86.79 evolving pivot high and 87.69 pivot resistance form the immediate overhead test zone, while the 81.39 pivot-reversal level aligns closely with the rising 20-day and 55-day benchmark cluster. Price is above all major benchmark averages, although the declining 10-day and 100-day trend readings reflect residual countertrend pressure from the prior summer decline. The broader yearly structure remains constructive above the rising 200-day average, while ATR and moderating volume indicate an active but less explosive recovery phase.
View charts on: AlphaWebTrader HTF Charts
GC Daily View
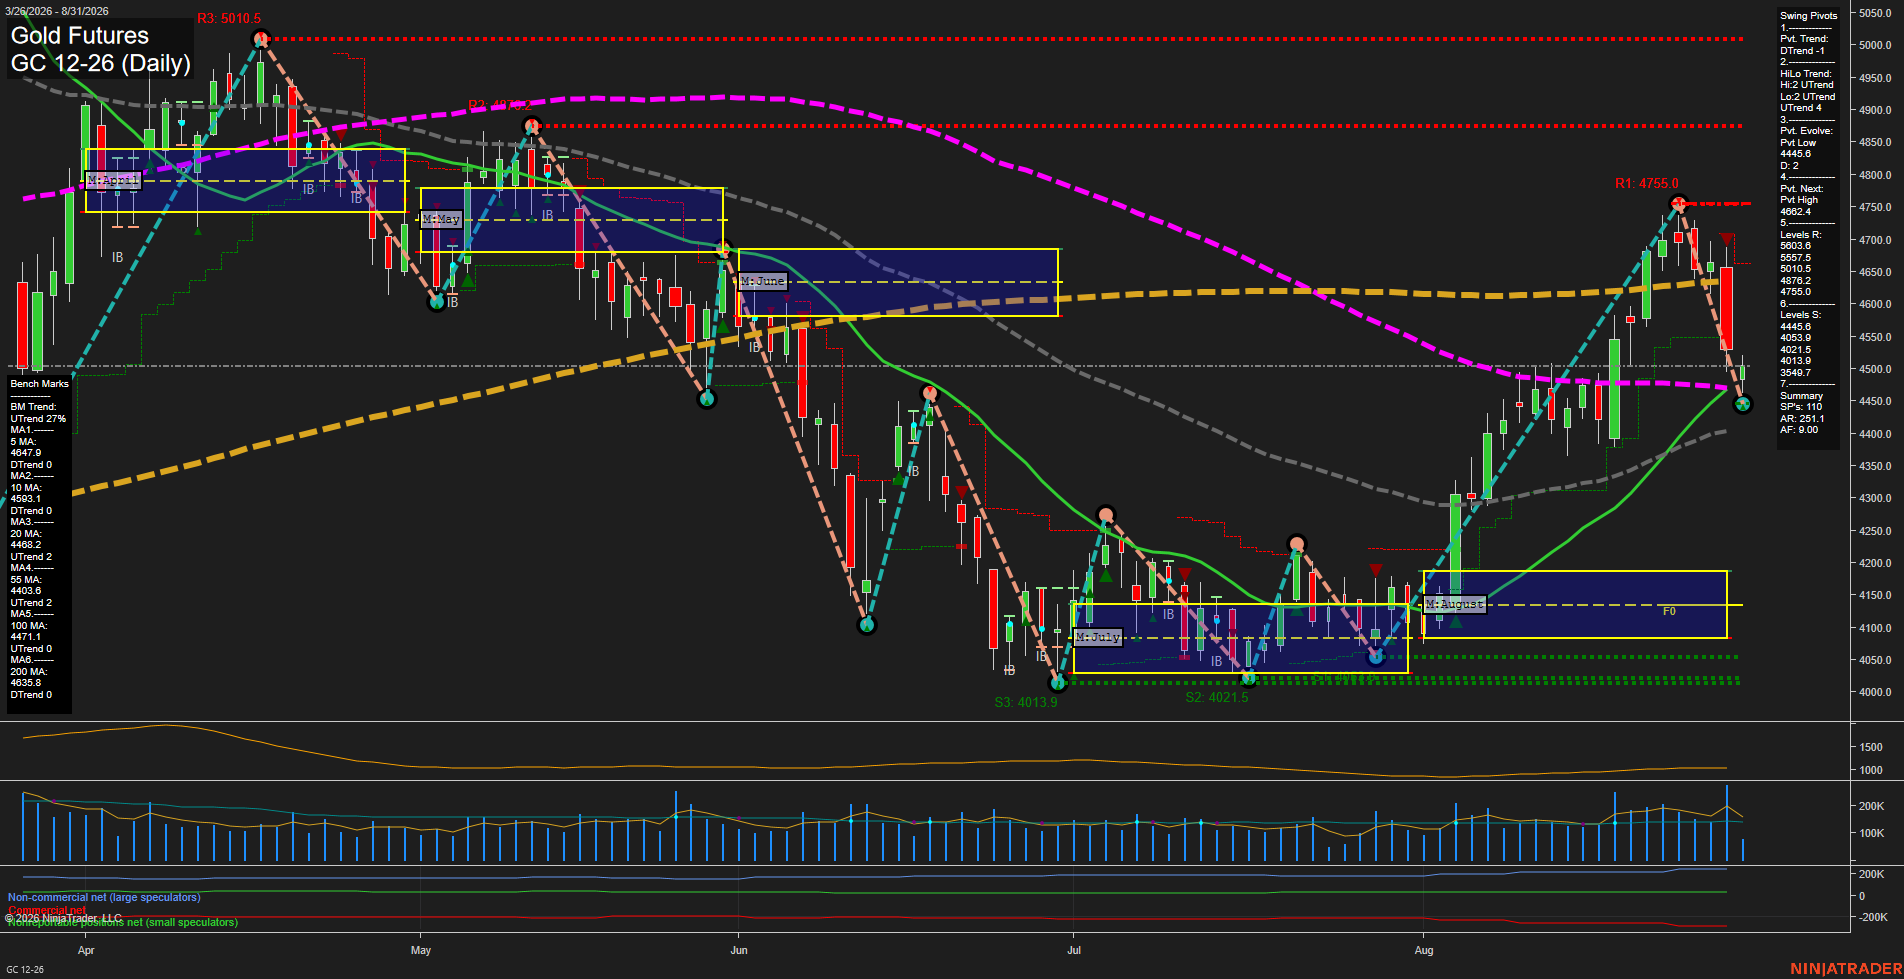
Overall Rating
- Short-Term: Bearish
- Intermediate-Term: Bullish
- Long-Term: Bearish.
Key Insights Summary
Gold completed a sharp reversal from the 4755.0 pivot-high resistance area and closed near the active 4455.8 pivot-low level on a large-range decline. Short-term structure is bearish, with price below the declining 5- and 10-day benchmarks and recent short signals aligned with the downside impulse. Intermediate structure remains constructive because the monthly grid, HiLo pivot trend, and rising 20- and 55-day averages remain positive; however, price is testing the 20-day benchmark and the current pivot low. The broader yearly grid remains negative, while price is below the 100- and 200-day benchmarks, maintaining a mixed-to-bearish long-term backdrop. The 4452-4456 area is the immediate pivot reference, with 4033.9-4013.9 representing the next major support cluster; a recovery through 4468.2, 4593.1, and 4647.9 would characterize a reversal of the current short-term pullback.
View charts on: AlphaWebTrader HTF Charts