U.S. stocks closed lower as U.S.-Iran hostilities lifted oil prices and Treasury yields, renewing inflation and Fed rate concerns across markets.
Fundamentals: U.S. equities weakened as renewed hostilities involving Iran raised concerns over Strait of Hormuz oil flows, pushing crude prices and long-dated Treasury yields higher. Inflation and possible Fed rate hikes returned to focus, pressuring late-month risk appetite despite solid August gains for major indexes. Gold faced mixed pressure from fiscal concerns and rising yields.
Technicals: U.S. markets closed with mixed leadership as Tesla, USO and IBIT advanced while Microsoft, Alphabet and Amazon declined. Futures analysis showed short-term bearish or neutral conditions across major equity indexes, reflecting consolidation and pullbacks from recent highs. Intermediate and long-term trend structures generally remained bullish, though volatility, weakening momentum and key support levels stayed in focus.
After Market Close daily snapshot: market news summary and sentiment, major ETFs, Magnificent 7 analysis, Indices Futures Higher Time Frame Analysis, and E-mini S&P500, Nasdaq 100, NYMEX Crude, Gold Futures Daily Chart analysis.
As of: August 31, 2026 05:00 CT
Market News Summary:
Renewed U.S.-Iran hostilities lifted oil prices, pressured equities, and intensified inflation and interest-rate concerns at August month-end.
Primary Drivers & Risks:
- Primary Driver: Iran conflict lifts oil and yields
- Primary Risk: Inflation and rate-hike concerns
Tone:
Risk-off, with energy and bond-market pressures dominating.
Stock Market / ETFs / Indices:
U.S. stocks fell Monday, with the Dow down 380 points, as the Iran conflict raised oil and inflation concerns. The S&P 500 gained 2% in August and the Nasdaq-100 outperformed on mega-cap strength, but rising Treasury yields weighed on utilities and late-month risk appetite.
Geopolitical:
Renewed U.S.-Iran military hostilities near the Strait of Hormuz drove market concern over oil flows and broader stability. Reports also cited new fighting and disruption risks around the shipping chokepoint.
Oil / Energy:
Oil prices rose on Middle East tensions and Strait of Hormuz concerns. Producers increased efforts to move supplies through the strait, while the administration pursued refinery-capacity discussions and a Venezuela oil-development agreement aimed at supplying Gulf Coast refiners and replenishing reserves.
Gold / Metals:
Gold received support from expanded Treasury debt buybacks and U.S. fiscal concerns, though spot gold slipped late Monday as the oil spike, higher long-end yields, and hawkish Fed repricing pressured non-yielding metals. Silver showed modest relative strength.
Fed / Financials:
Fed Chair Kevin Warsh’s inflation tone returned rate hikes to market discussion. The 10-year Treasury yield rose sharply, with commentary focused on a potential move toward 5%, while concern persisted over the long end of the Treasury market despite Treasury officials emphasizing relative U.S. bond performance.
Macro / Other:
Higher oil prices revived inflation concerns, while one economist maintained that inflation remains on a path toward 2% without excessively restrictive rates. September seasonality remained a noted equity-market cross-current after August’s broad gains.
Conclusion:
Iran-related oil-price gains and higher long-dated Treasury yields drove the session’s equity weakness. Fed rate-hike concerns reinforced pressure on risk assets.
Oil-supply measures involving Venezuela, refinery capacity, and alternative Strait of Hormuz shipments provided supply-side context. Gold faced opposing forces from fiscal-debasement interest and higher yields.
Market News Sentiment
Market News Articles: 41
- Neutral: 41.46%
- Negative: 39.02%
- Positive: 19.51%
Sentiment Summary: Market news sentiment is mixed, with 41% neutral coverage, 39% negative coverage, and 20% positive coverage across 41 articles.
Conclusion: Indices futures headlines show a largely neutral-to-negative tone, with negative articles outnumbering positive articles.
GLD,Gold Articles: 12
- Negative: 66.67%
- Neutral: 16.67%
- Positive: 16.67%
Sentiment Summary: Gold (GLD) coverage is predominantly negative, with 67% negative, 17% neutral, and 17% positive articles.
Conclusion: The gold news tone is negative overall, indicating limited positive sentiment support in the snapshot.
USO,Oil Articles: 16
- Negative: 37.50%
- Positive: 31.25%
- Neutral: 31.25%
Sentiment Summary: USO/Oil coverage is mixed, with 38% negative, 31% positive, and 31% neutral across 16 articles.
Conclusion: Oil-related news tone is slightly negative overall, with balanced positive and neutral coverage.
Market Data Snapshot
ETF Snapshot of major stock market ETFs, Mag7, and others as of: August 31, 2026 05:00
Top Movers & Losers
- TSLA 367.95 Bullish 5.51% ▲
- USO 133.70 Bullish 3.08% ▲
- IBIT 44.67 Bullish 1.75% ▲
- MSFT 507.29 Bearish -1.22% ▼
- GOOG 335.41 Bearish -2.18% ▼
- AMZN 259.77 Bearish -2.50% ▼
Major Index ETFs: SPY, QQQ, DIA, IWM, IJH
- QQQ 716.76 Bullish 0.05% ▲
- SPY 767.05 Bearish -0.30% ▼
- IJH 75.35 Bearish -0.54% ▼
- IWM 293.93 Bearish -0.62% ▼
- DIA 531.57 Bearish -0.65% ▼
Mixed major-index ETF tone: QQQ is the most bullish mover at +0.05%, a marginal gain, while DIA is the most bearish mover at -0.65%. SPY is Bearish at -0.30%, with broader pressure in IJH at -0.54% and IWM at -0.62%.
Mag 7 Stocks: AAPL, MSFT, GOOG, AMZN, META, NVDA, TSLA
- TSLA 367.95 Bullish 5.51% ▲
- NVDA 220.78 Bullish 1.48% ▲
- AAPL 316.85 Bearish -0.89% ▼
- META 572.34 Bearish -0.98% ▼
- MSFT 507.29 Bearish -1.22% ▼
- GOOG 335.41 Bearish -2.18% ▼
- AMZN 259.77 Bearish -2.50% ▼
Mag7 action was Mixed: TSLA was the most bullish mover at +5.51%, followed by NVDA at +1.48%. AMZN was the most bearish mover at -2.50%, with GOOG at -2.18%; AAPL -0.89%, META -0.98%, and MSFT -1.22% were also Bearish.
Cross-Market ETFs: TLT, GLD, USO, IBIT
- USO 133.70 Bullish 3.08% ▲
- IBIT 44.67 Bullish 1.75% ▲
- GLD 408.42 Bearish -0.11% ▼
- TLT 82.52 Bearish -0.43% ▼
Mixed cross-market snapshot: USO is the most bullish mover at +3.08%, followed by IBIT at +1.75%. TLT is the most bearish mover at -0.43%, while GLD is marginally Bearish at -0.11%.
ETF, Mag7, and Cross-Market ETF Insights
Overall Tone
Mixed: broad equity ETFs were Bearish while selective leadership in TSLA, NVDA, USO, and IBIT provided Bullish pockets.
Equity ETFs and Mag7:
Major Index ETFs were broadly Bearish, led lower by DIA at -0.65%, IWM at -0.62%, and IJH at -0.54%, while QQQ was marginally Bullish at +0.05% and SPY declined -0.30%. Mag7 performance was selective: TSLA was the most bullish mover at +5.51%, followed by NVDA at +1.48%, while AMZN was the most bearish mover at -2.50% and GOOG fell -2.18%. AAPL, META, and MSFT were also Bearish, showing narrow mega-cap leadership rather than broad equity alignment.
Cross-Market ETFs:
Cross-market ETFs were Mixed, with USO the most bullish mover at +3.08% and IBIT gaining +1.75%, contrasting with Bearish broad equity ETFs. TLT was the most bearish cross-market mover at -0.43%, while GLD was marginally Bearish at -0.11%, indicating commodity and bitcoin strength alongside weaker bonds and near-flat gold.
Futures Indices – Higher Time Frame Analysis
Summary of the current state of US Indices Futures based on higher time-frame (HTF) technical analysis as of: 2026-08-31: 17:00 CT.
US Indices Futures
- ES: YSFG/MSFG upward, WSFG down; above major benchmarks; 7467 support, 7838.50 resistance; short-term pullback within rising pivots.
- NQ: YSFG/MSFG upward, WSFG down; benchmarks broadly rising; 28946.75-29007 support, 29811.25-31090 resistance; corrective pivot conditions.
- YM: YSFG/MSFG upward, WSFG down; above rising benchmarks; 52812-53022 support, 53882 then 54884 resistance; compressed consolidation.
- EMD: YSFG upward, MSFG/WSFG below centers; below near-term benchmarks; 3772.6-3724 support, 3852 resistance; DTrend selloff from 3941.7.
- RTY: YSFG/MSFG upward, WSFG down; below 5/10/20-day benchmarks; 2983.3 then 2902.3 support, 3028.7 and 3079.9 resistance.
- FDAX: YSFG/MSFG upward, WSFG down; above all benchmarks; 26246 and 25965 support, 26602-26665 resistance; upward pivots consolidating.
Overall State
- Short-Term: Bearish
- Intermediate-Term: Bullish
- Long-Term: Bullish
Conclusion
US index futures retain broadly upward yearly and monthly structure, with ES, NQ, YM, RTY, and FDAX generally above longer benchmark averages. Weekly fib-grid conditions are down across the group, aligning with short-term retracements beneath recent pivot highs. EMD shows the broadest corrective alignment, trading below near-term benchmarks and monthly/weekly grid centers. FDAX and YM are neutral short-term consolidations, while ES, NQ, RTY, and EMD retain bearish short-term conditions. Recent swing highs remain principal resistance, and listed pivot-reversal levels define nearby support structure.
Note: Intra-day counter-trend pullbacks or retracements may occur, HTF is context for informational usage and market structure. Glossary: Session Fib Grids periods of YSFG:’Yearly’, MSFG:’Monthly’, WSFG:’Weekly’
For full details visit: AlphaWebTrader Technicals
ES Daily View
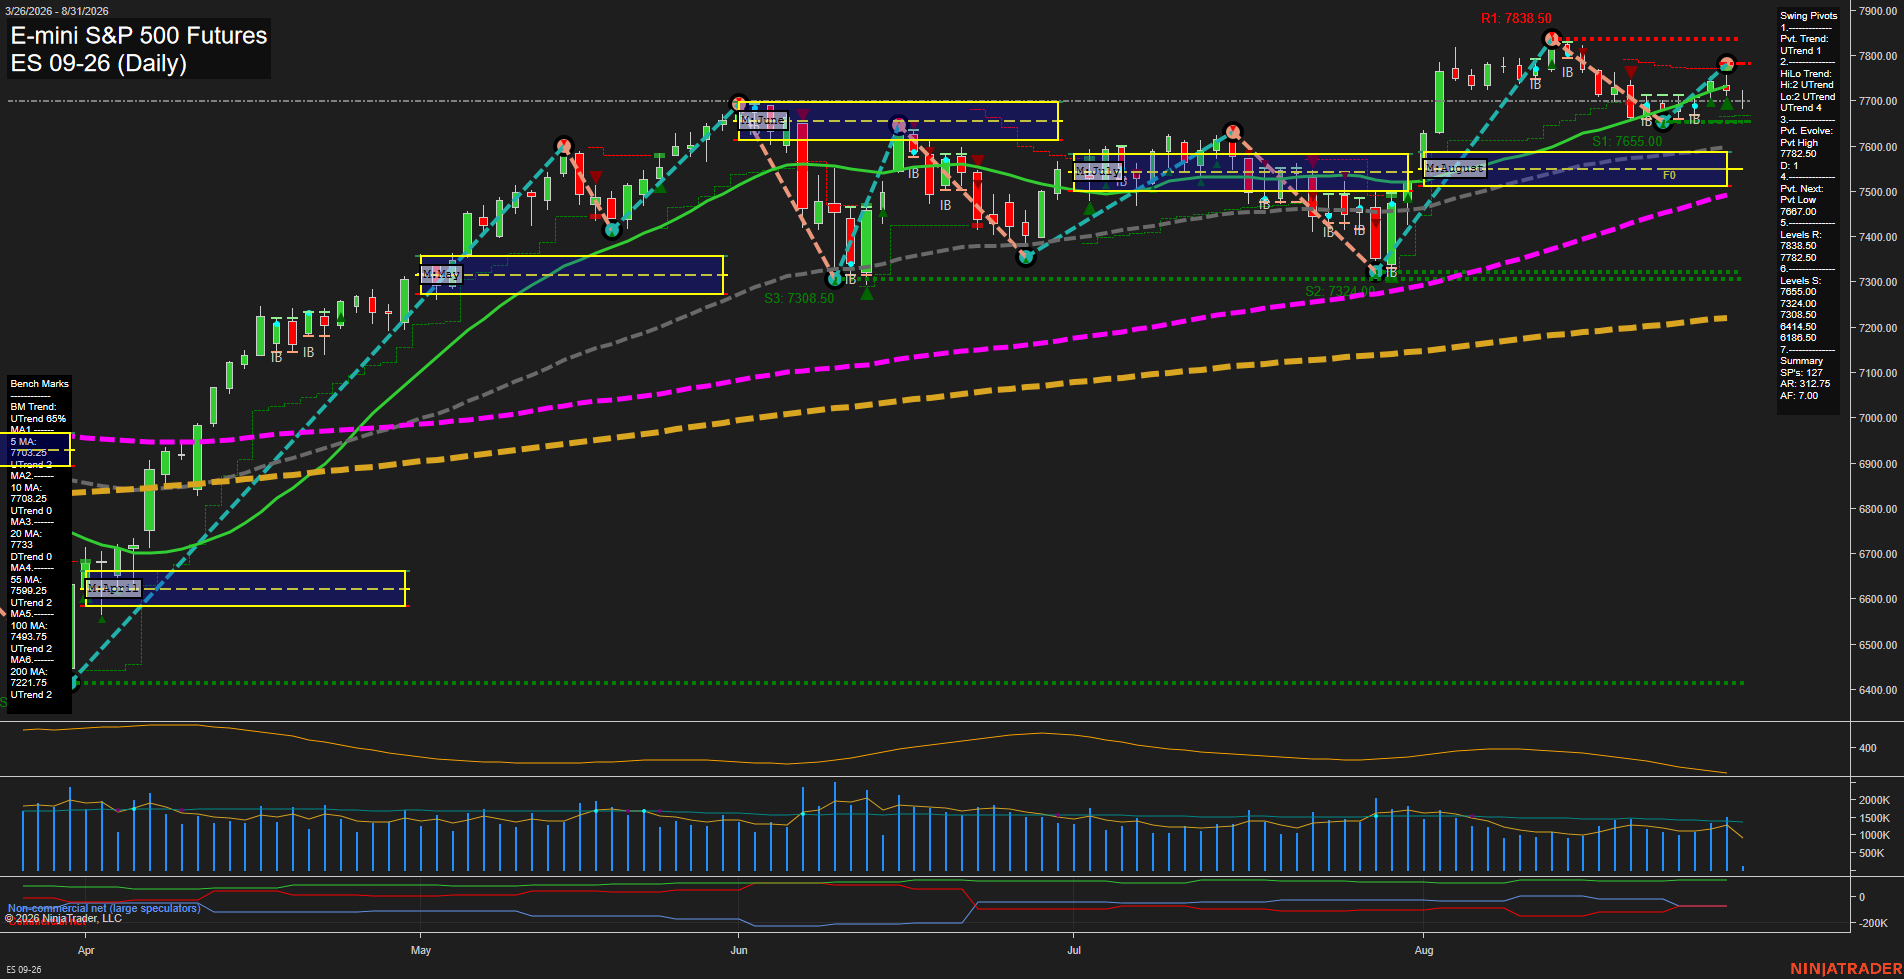
Overall Rating
- Short-Term: Bearish
- Intermediate-Term: Bullish
- Long-Term: Bullish.
Key Insights Summary
Price is consolidating beneath the 7782.50 pivot-high area after a sharp August advance, with the latest pullback placing the short-term weekly fib condition below its F0/NTZ reference. The pivot structure remains upward on both short- and intermediate-term measures, while price remains above the rising 55-, 100-, and 200-day benchmarks. Near-term action is mixed: the 20-day benchmark is declining and short signals align with a retracement phase, while 7655.00 is the nearest structural support and 7838.50 is the higher resistance threshold. Volatility remains elevated, supporting wider daily swings and a choppier consolidation character near recent highs.
View charts on: AlphaWebTrader HTF Charts
NQ Daily View
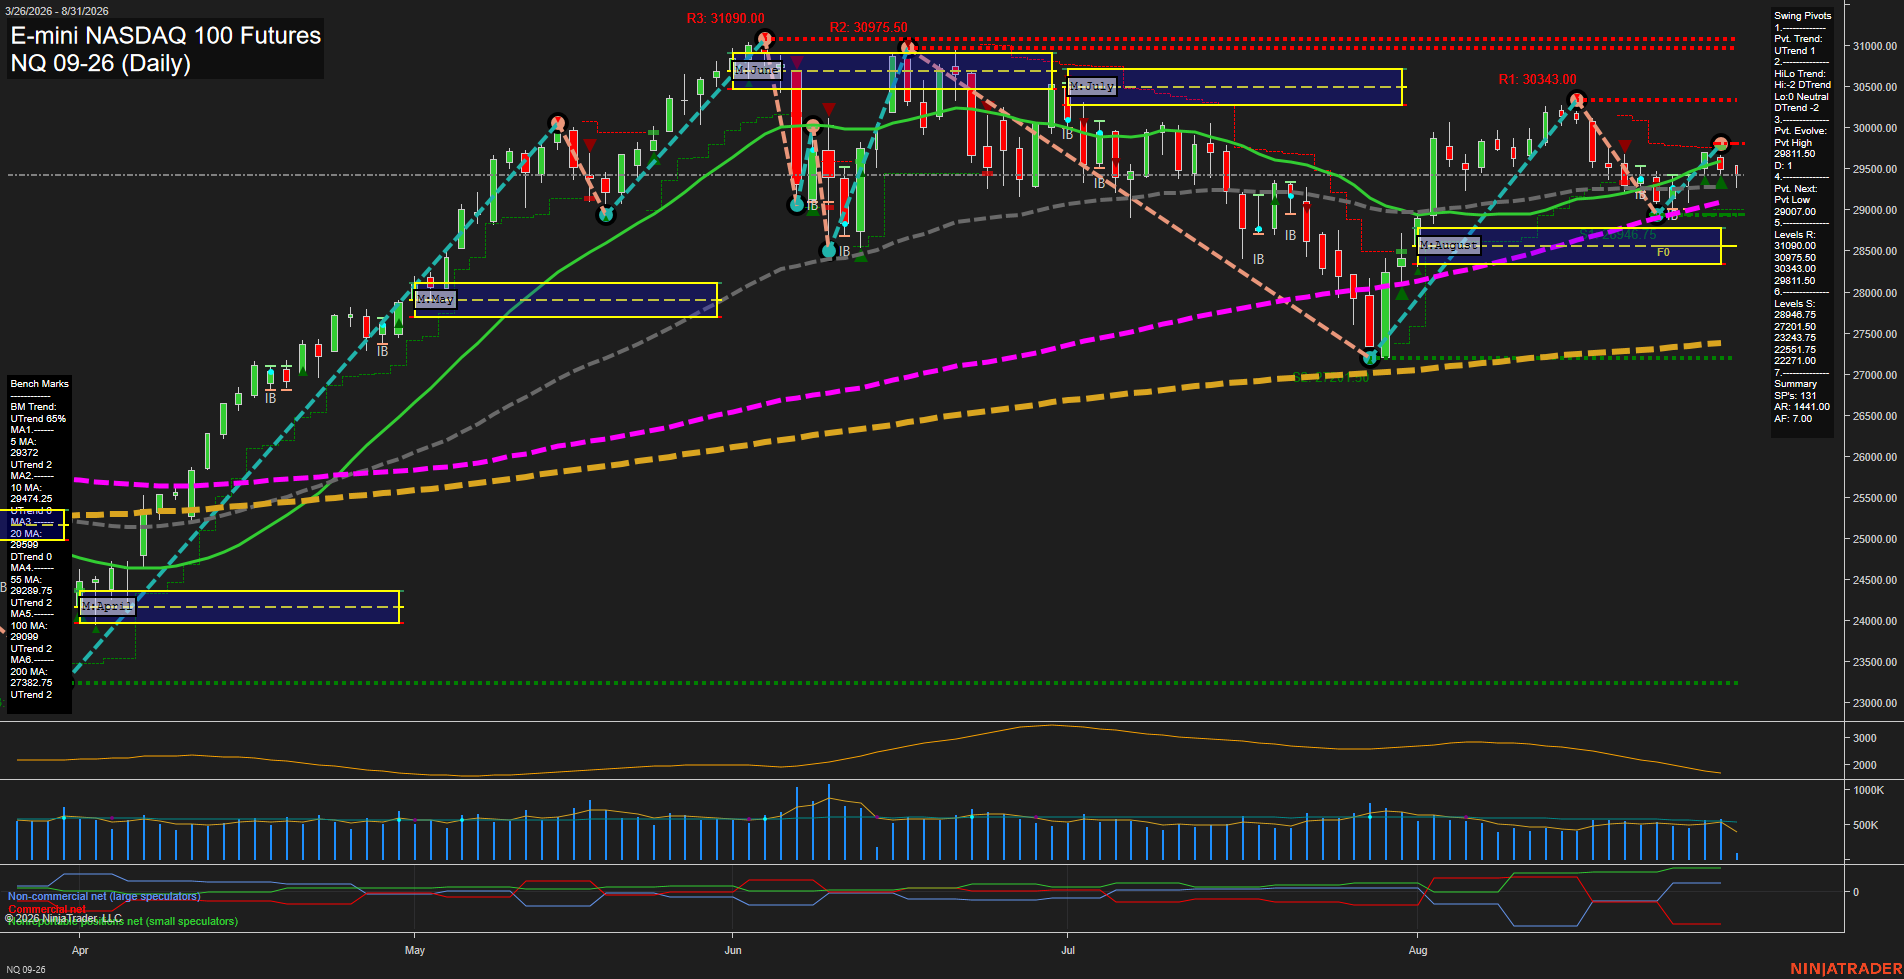
Overall Rating
- Short-Term: Bearish
- Intermediate-Term: Neutral
- Long-Term: Bullish.
Key Insights Summary
NQ is consolidating beneath the declining 20-day benchmark and below the weekly F0% area following rejection from the 29811.25 pivot high. The short-term pivot structure remains technically upward, but price action has softened into small-range bars with slowing momentum and recent short-term sell signals. Intermediate conditions are mixed: the August grid remains positive and price holds above the 55-day average, while the HiLo pivot trend and 20-day average remain down. The broader yearly structure remains constructive above rising 100-day and 200-day benchmarks, with 28946.75 and the 29007 pivot-reversal area defining the nearby structural support zone and 29811.25, 30343.00, and 30975.50 defining overhead swing resistance.
View charts on: AlphaWebTrader HTF Charts
CL Daily View
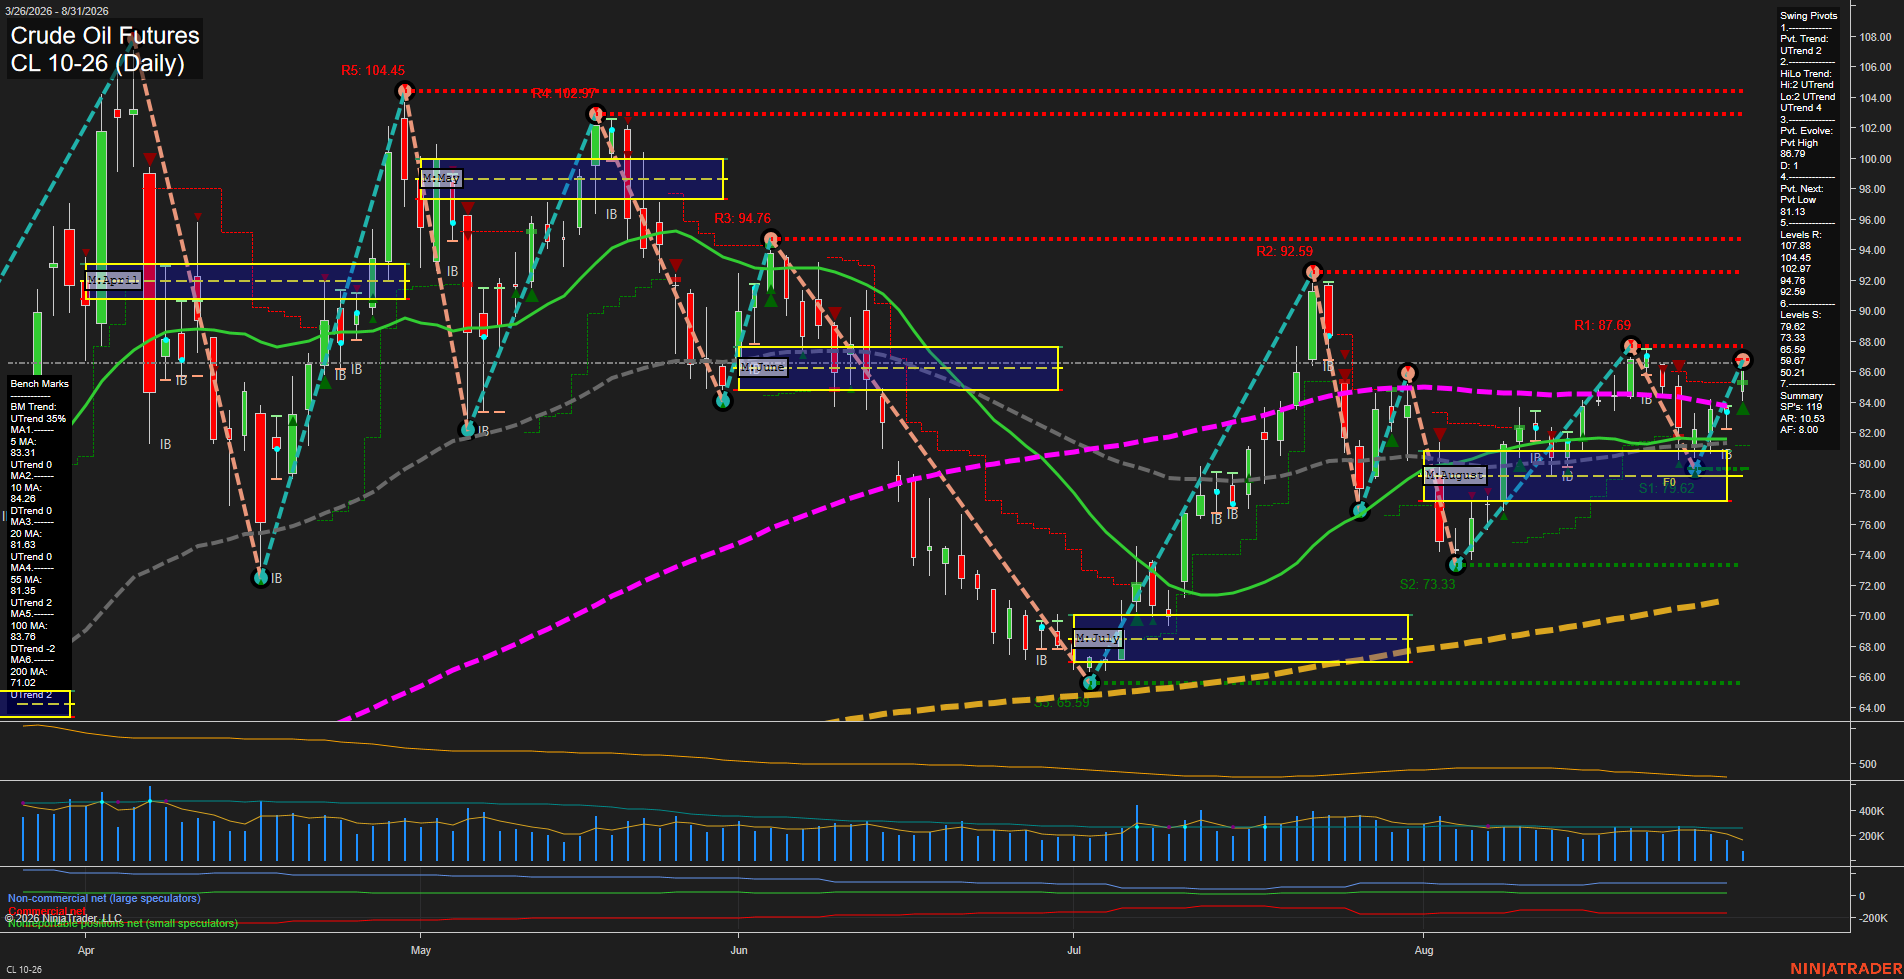
Overall Rating
- Short-Term: Bullish
- Intermediate-Term: Bullish
- Long-Term: Bullish.
Key Insights Summary
Price has extended its late-August recovery above the weekly and monthly Fib-grid centers, with a fast upswing from the 79.62 support area and higher swing lows preserving the bullish pivot structure. The 86.79 evolving pivot high and 87.69 pivot resistance form the immediate overhead test zone, while the 81.39 pivot-reversal level aligns closely with the rising 20-day and 55-day benchmark cluster. Price is above all major benchmark averages, although the declining 10-day and 100-day trend readings reflect residual countertrend pressure from the prior summer decline. The broader yearly structure remains constructive above the rising 200-day average, while ATR and moderating volume indicate an active but less explosive recovery phase.
View charts on: AlphaWebTrader HTF Charts
GC Daily View
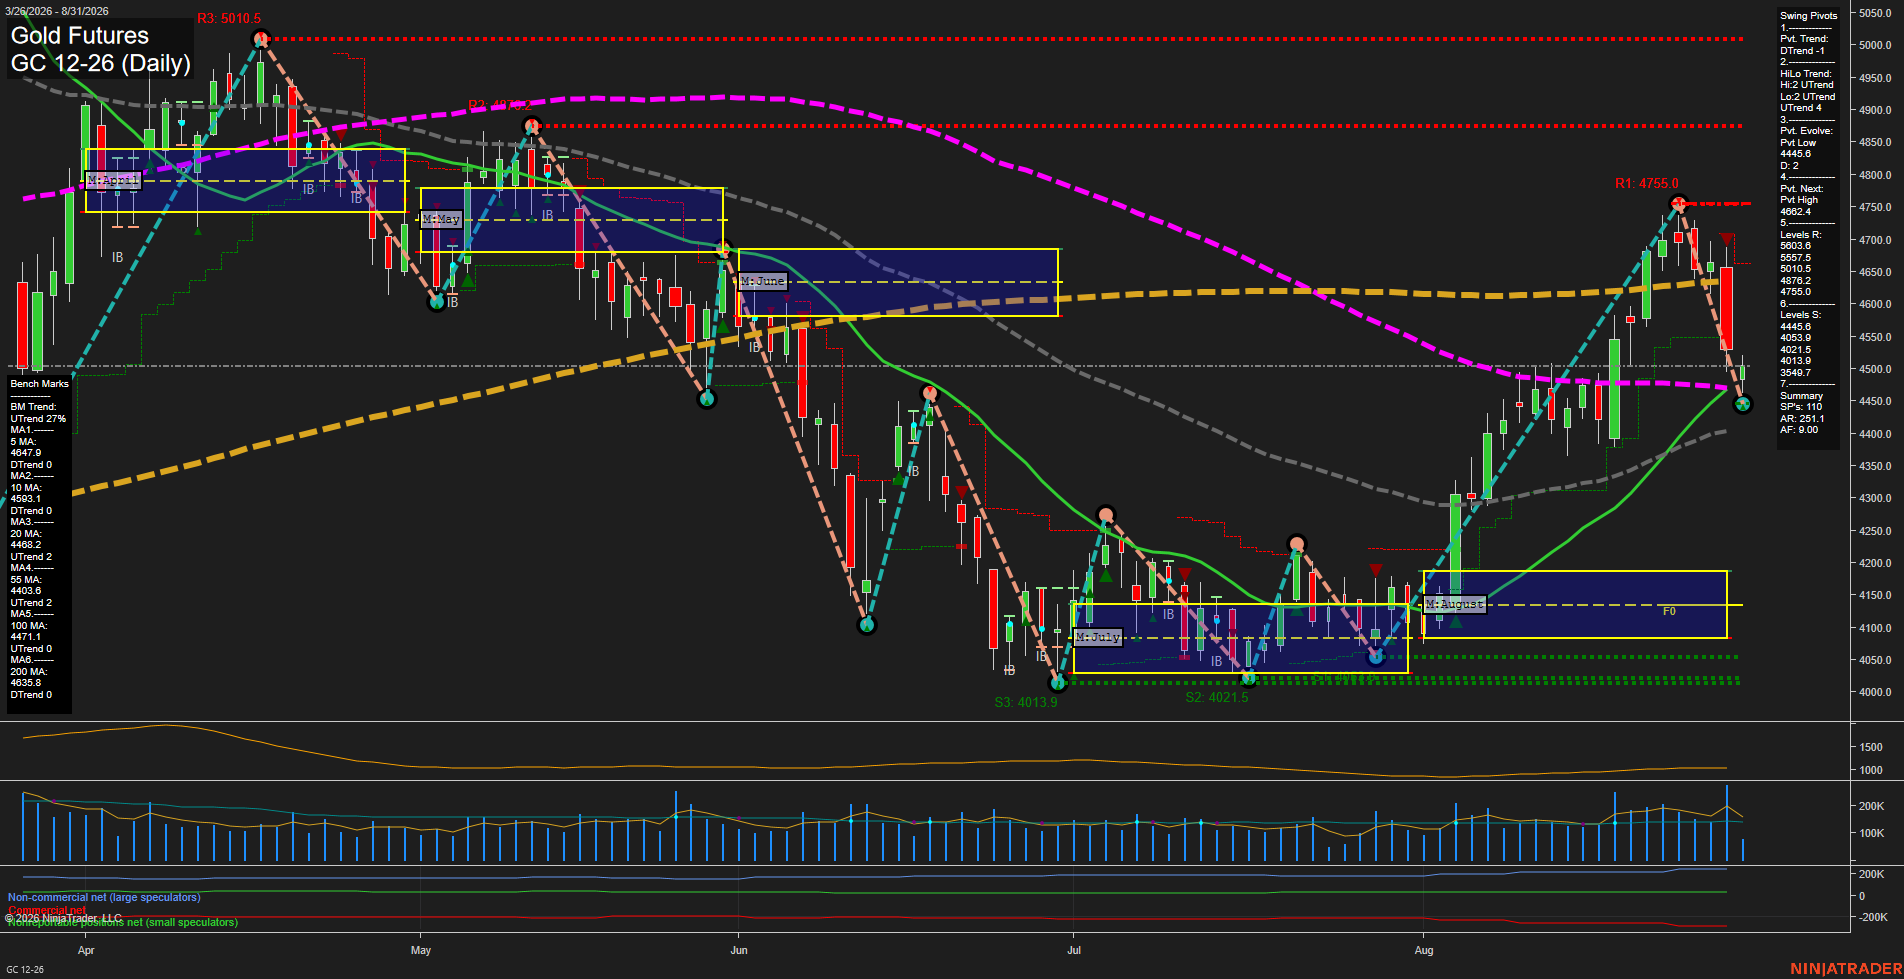
Overall Rating
- Short-Term: Bearish
- Intermediate-Term: Bullish
- Long-Term: Bearish.
Key Insights Summary
Gold completed a sharp reversal from the 4755.0 pivot-high resistance area and closed near the active 4455.8 pivot-low level on a large-range decline. Short-term structure is bearish, with price below the declining 5- and 10-day benchmarks and recent short signals aligned with the downside impulse. Intermediate structure remains constructive because the monthly grid, HiLo pivot trend, and rising 20- and 55-day averages remain positive; however, price is testing the 20-day benchmark and the current pivot low. The broader yearly grid remains negative, while price is below the 100- and 200-day benchmarks, maintaining a mixed-to-bearish long-term backdrop. The 4452-4456 area is the immediate pivot reference, with 4033.9-4013.9 representing the next major support cluster; a recovery through 4468.2, 4593.1, and 4647.9 would characterize a reversal of the current short-term pullback.
View charts on: AlphaWebTrader HTF Charts