
U.S. stocks edged lower as Middle East energy disruptions lifted oil and yields, while gold gained ahead of major earnings and the Federal Reserve meeting.
Fundamentals: U.S. equities finished modestly lower near record levels as Middle East energy disruptions lifted crude oil, Treasury yields, and demand for defensive assets. Gold and silver advanced despite firmer yields, while investors focused on major corporate earnings, Federal Reserve policy uncertainty, record ETF activity, and signs of weakening credit conditions.
Technicals: NVDA, USO and GLD led ETF gains, while TSLA, MSFT and META declined at the NYSE close. ES, NQ, RTY, EMD and FDAX retained broadly bullish longer-term structures, though daily signals reflected consolidation and mixed momentum. YM showed the weakest near-term profile, with corrective daily benchmarks despite its intact long-term uptrend.
After Market Close daily snapshot: market news summary and sentiment, major ETFs, Magnificent 7 analysis, Indices Futures Higher Time Frame Analysis, and E-mini S&P500, Nasdaq 100, NYMEX Crude, Gold Futures Daily Chart analysis.
As of: July 22, 2026 05:00 CT
Market News Summary:
U.S. equities stalled near records as Middle East energy disruptions lifted oil, yields, and defensive demand ahead of major earnings and the Federal Reserve meeting.
Primary Drivers & Risks:
- Primary Driver: Energy supply disruptions lift oil
- Primary Risk: Chokepoint closures and concentrated equities
Tone:
Mixed: energy and geopolitical stress offset broad earnings momentum.
Stock Market / ETFs / Indices:
U.S. stocks finished slightly lower while oil extended gains, with investors positioning for major earnings releases. SPY, QQQ, and SOXL reached records, and ETF trading volume rose to an all-time-high 27.6% share. Earnings growth is broadening, supporting equal-weight strategies, while record S&P 500 concentration remains a structural vulnerability.
Geopolitical:
Middle East conflict and threats to energy infrastructure remained the central cross-asset risk. Disruptions involving Hormuz, Bab al-Mandeb, and Black Sea routes imperil a substantial share of global oil supply, while Red Sea export routes face additional Houthi-related disruption risk.
Oil / Energy:
Analysts cited a deeper 2026 global oil deficit amid the Middle East war, although stronger Gulf flows, U.S. output, and weaker Chinese demand point to a 2027 oversupply outlook. Elevated commodity prices supported energy producers, and Goldman Sachs discussed a Brent crude scenario of $120 per barrel in the fourth quarter of 2026. U.S.-Saudi civilian nuclear cooperation and U.S. policy attention to data-center electricity costs highlighted broader energy-security and power-demand themes.
Gold / Metals:
Gold rose above $4,120 and silver advanced as technical buying and defensive demand outweighed firmer Treasury yields and higher crude prices. Softer recent U.S. inflation readings, geopolitical tensions, and concern over economic stability supported bullion interest. Gold remained below the technical confirmation level cited near $4,203.
Fed / Financials:
Traders weighed next week’s Federal Reserve meeting as the Fed’s preferred inflation tracker undergoes changes and officials debate potential rate increases this fall. Credit conditions showed deterioration through rising defaults and weaker private-credit and commercial-real-estate fundamentals. REITs retained earnings-season momentum despite elevated Treasury yields.
Macro / Other:
AI infrastructure demand continued to support semiconductor, data-center, industrial, and power-related activity. Big Tech earnings are under focus as investors assess AI monetization against heavy capital expenditure, while credit concerns have increased around AI infrastructure financing.
Conclusion:
Oil supply disruption and major earnings were the principal forces shaping index-futures conditions. Record ETF activity and broadening earnings growth provided support, while equities stalled as crude prices rose.
Geopolitical chokepoints, higher yields, and inflation-policy uncertainty remained the key cross-currents. Gold strength and weakening credit fundamentals reflected continued demand for defensive positioning.
Market News Sentiment
Market News Articles: 36
- Neutral: 52.78%
- Negative: 27.78%
- Positive: 19.44%
Sentiment Summary: Market news sentiment is predominantly neutral (53%), with negative coverage (28%) exceeding positive coverage (19%).
Conclusion: Indices futures day traders face a neutral news backdrop with a modest negative skew in article sentiment.
GLD,Gold Articles: 10
- Positive: 70.00%
- Neutral: 30.00%
Sentiment Summary: Gold-related coverage is 70% positive and 30% neutral across 10 articles.
Conclusion: The news tone toward GLD and gold is predominantly positive, with no negative articles reported.
USO,Oil Articles: 10
- Positive: 60.00%
- Negative: 20.00%
- Neutral: 20.00%
Sentiment Summary: USO/Oil coverage was 60% positive, 20% negative, and 20% neutral across 10 articles.
Conclusion: Oil-related news sentiment was predominantly positive, providing a constructive commodity backdrop for indices futures monitoring.
Market Data Snapshot
ETF Snapshot of major stock market ETFs, Mag7, and others as of: July 22, 2026 05:00
Top Movers & Losers
- NVDA 212.06 Bullish 2.30% ▲
- USO 131.68 Bullish 2.20% ▲
- GLD 379.12 Bullish 1.15% ▲
- TSLA 374.01 Bearish -1.30% ▼
- MSFT 390.34 Bearish -1.86% ▼
- META 627.17 Bearish -2.58% ▼
Major Index ETFs: SPY, QQQ, DIA, IWM, IJH
- DIA 521.47 Bearish -0.01% ▼
- IJH 75.69 Bearish -0.04% ▼
- SPY 747.41 Bearish -0.12% ▼
- QQQ 705.35 Bearish -0.51% ▼
- IWM 293.79 Bearish -0.93% ▼
Major index ETFs were Bearish across the board. IWM led losses at -0.93%, followed by QQQ at -0.51%; SPY declined -0.12%. DIA was the least negative mover, near-flat at -0.01%, while IJH was marginally lower at -0.04%.
Mag 7 Stocks: AAPL, MSFT, GOOG, AMZN, META, NVDA, TSLA
- NVDA 212.06 Bullish 2.30% ▲
- AAPL 325.89 Bearish -0.56% ▼
- AMZN 244.85 Bearish -1.09% ▼
- GOOG 341.91 Bearish -1.24% ▼
- TSLA 374.01 Bearish -1.30% ▼
- MSFT 390.34 Bearish -1.86% ▼
- META 627.17 Bearish -2.58% ▼
Mag7 breadth is Bearish: NVDA is the sole Bullish mover at +2.30%, while META is the most bearish mover at -2.58%. MSFT -1.86%, TSLA -1.30%, GOOG -1.24%, AMZN -1.09%, and AAPL -0.56% are Bearish.
Cross-Market ETFs: TLT, GLD, USO, IBIT
- USO 131.68 Bullish 2.20% ▲
- GLD 379.12 Bullish 1.15% ▲
- TLT 83.44 Bearish -0.26% ▼
- IBIT 37.34 Bearish -0.88% ▼
Mixed cross-market snapshot: USO is the most bullish mover at +2.20%, followed by GLD at +1.15%. IBIT is the most bearish mover at -0.88%, while TLT is modestly Bearish at -0.26%.
ETF, Mag7, and Cross-Market ETF Insights
Overall Tone
Mixed, as NVDA and commodities were Bullish while broad equity ETFs, most Mag7 names, bonds, and IBIT were Bearish.
Equity ETFs and Mag7:
Major Index ETFs were broadly Bearish: DIA was marginal at -0.01%, followed by IJH at -0.04%, SPY at -0.12%, QQQ at -0.51%, and IWM at -0.93%. Mag7 action was selective, with NVDA the most bullish mover at +2.30%, while AAPL -0.56%, AMZN -1.09%, GOOG -1.24%, TSLA -1.30%, MSFT -1.86%, and META—the most bearish mover—at -2.58% were Bearish. Equity participation was therefore Bearish overall, with NVDA providing isolated Bullish leadership.
Cross-Market ETFs:
Cross-market action was Mixed: USO was the most bullish mover at +2.20% and GLD added +1.15%, contrasting with Bearish equity ETFs. TLT declined -0.26%, while IBIT was the most bearish cross-market mover at -0.88%, showing divergence between commodity strength and Bearish bonds and bitcoin exposure.
Futures Indices – Higher Time Frame Analysis
Summary of the current state of US Indices Futures based on higher time-frame (HTF) technical analysis as of: 2026-07-22: 17:00 CT.
US Indices Futures
- ES: YSFG/WSFG above F0%, MSFG below F0%; weekly UTrend; support 7473.50/7219.50, resistance 7632.00-7693.50; long-term benchmarks rising.
- NQ: YSFG/WSFG above F0%, MSFG below F0%; weekly HiLo UTrend, short pivot DTrend; support 28408.25, recovery pivot 29882.75, resistance 31090.00-31097.75.
- YM: YSFG above F0%, MSFG below F0%; weekly higher-high structure intact; support 51999/51069, intermediate support 50136, resistance 53111-53656.
- EMD: YSFG/WSFG above F0%, MSFG below F0%; higher pivots and rising long benchmarks; support 3724.0-3692.9, resistance 3836.8-3892.4.
- RTY: YSFG/WSFG above F0%, MSFG below F0%; weekly higher-low structure; support 2943.4/2835.8, resistance 3038.4-3068.4; long benchmarks rising.
- FDAX: YSFG/MSFG/WSFG above F0%; weekly higher-low/higher-high structure; support 24785/24282, pivot threshold 25449, resistance 26064; long benchmarks rising.
Overall State
- Short-Term: Neutral
- Intermediate-Term: Bullish
- Long-Term: Bullish
Conclusion
US index futures retain broadly bullish yearly and weekly structures, supported by rising intermediate-to-long-term benchmarks and higher-order pivots. ES, NQ, YM, EMD, and RTY have monthly grids below F0%, aligning with consolidation or retracement beneath nearby pivot highs. FDAX holds above all Fib-grid references and shows relative intermediate strength. Daily structures are mixed, with YM and EMD lagging through short-term DTrend conditions, while ES, NQ, RTY, and FDAX remain balanced near recovery thresholds or benchmark resistance.
Note: Intra-day counter-trend pullbacks or retracements may occur, HTF is context for informational usage and market structure. Glossary: Session Fib Grids periods of YSFG:’Yearly’, MSFG:’Monthly’, WSFG:’Weekly’
For full details visit: AlphaWebTrader Technicals
ES Daily View
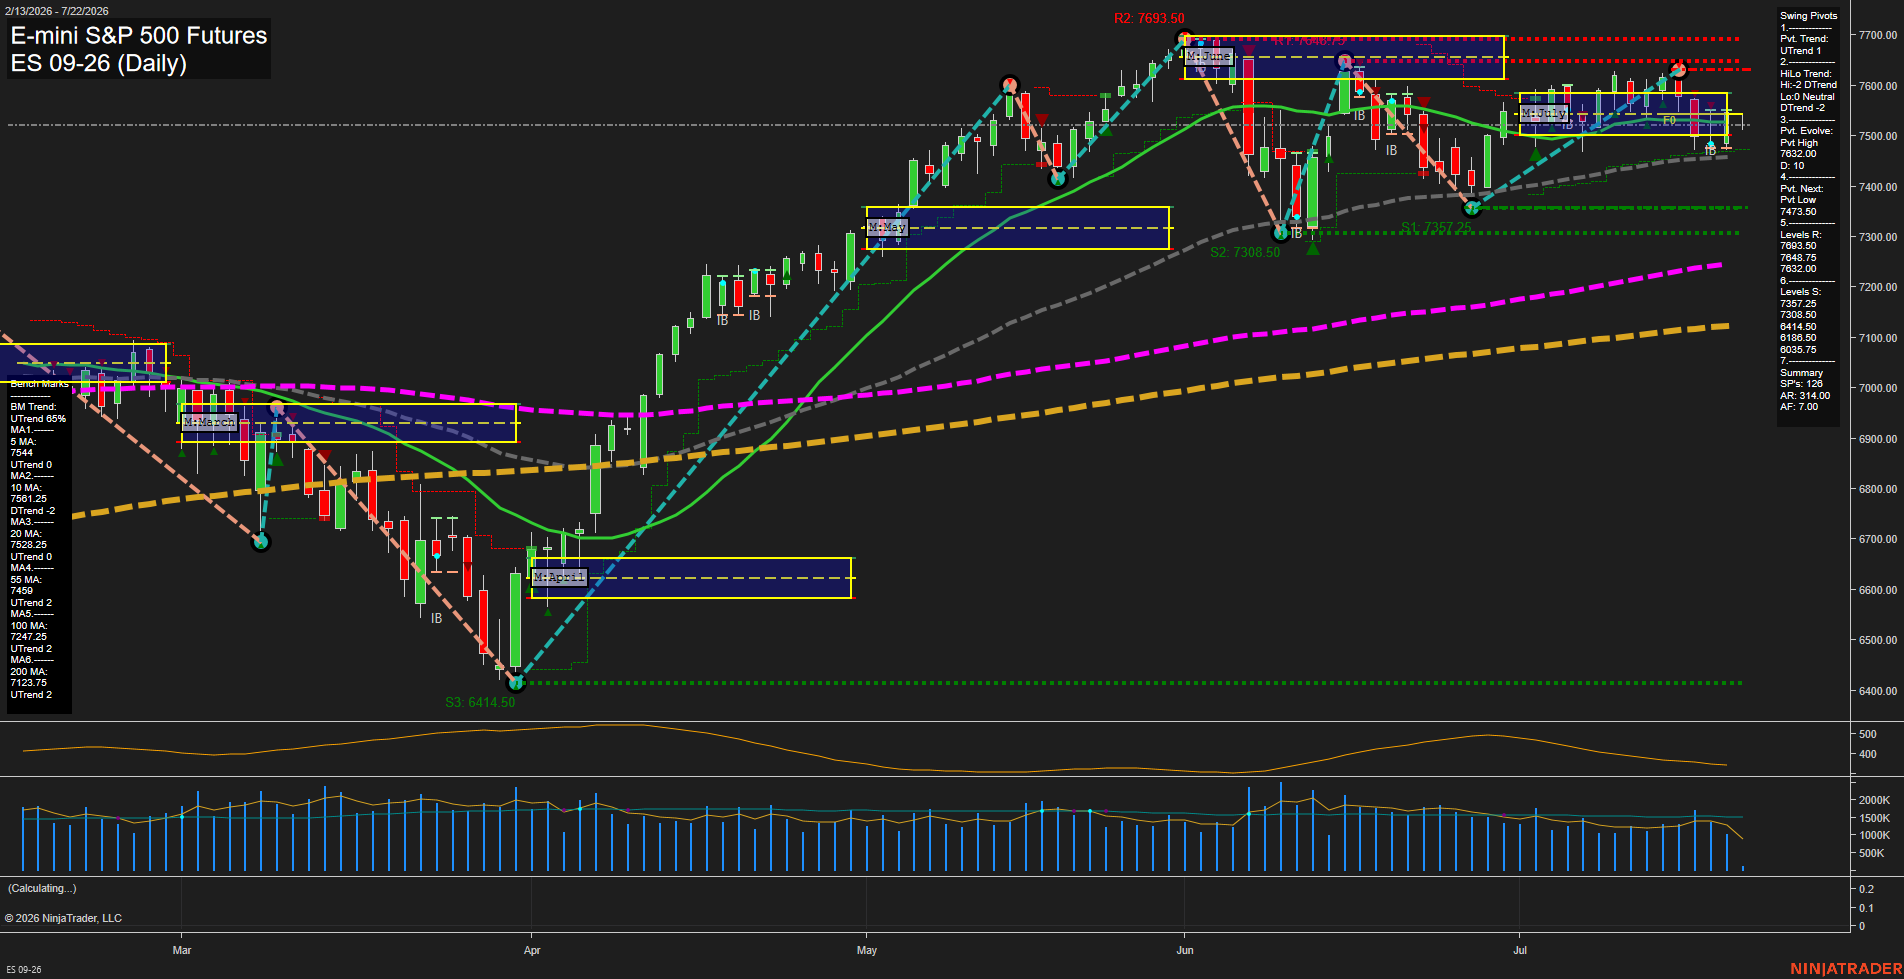
Overall Rating
- Short-Term: Neutral
- Intermediate-Term: Neutral
- Long-Term: Bullish.
Key Insights Summary
Price remains within a July consolidation following the June recovery, with small daily bars and slowing momentum reflecting balance around the 20-day benchmark and the monthly F0% area. The weekly grid remains positive and the short-term pivot trend is upward, but the intermediate pivot structure and July MSFG remain down while price holds beneath the 5-day and 10-day averages. The broader structure remains constructive: price is above the rising 55-day, 100-day, and 200-day benchmarks, and the yearly grid remains positive. The 7473.50 pivot-low reversal level defines the nearby structural floor, while 7632.00 through 7693.50 is the overhead pivot-resistance cluster.
View charts on: AlphaWebTrader HTF Charts
NQ Daily View
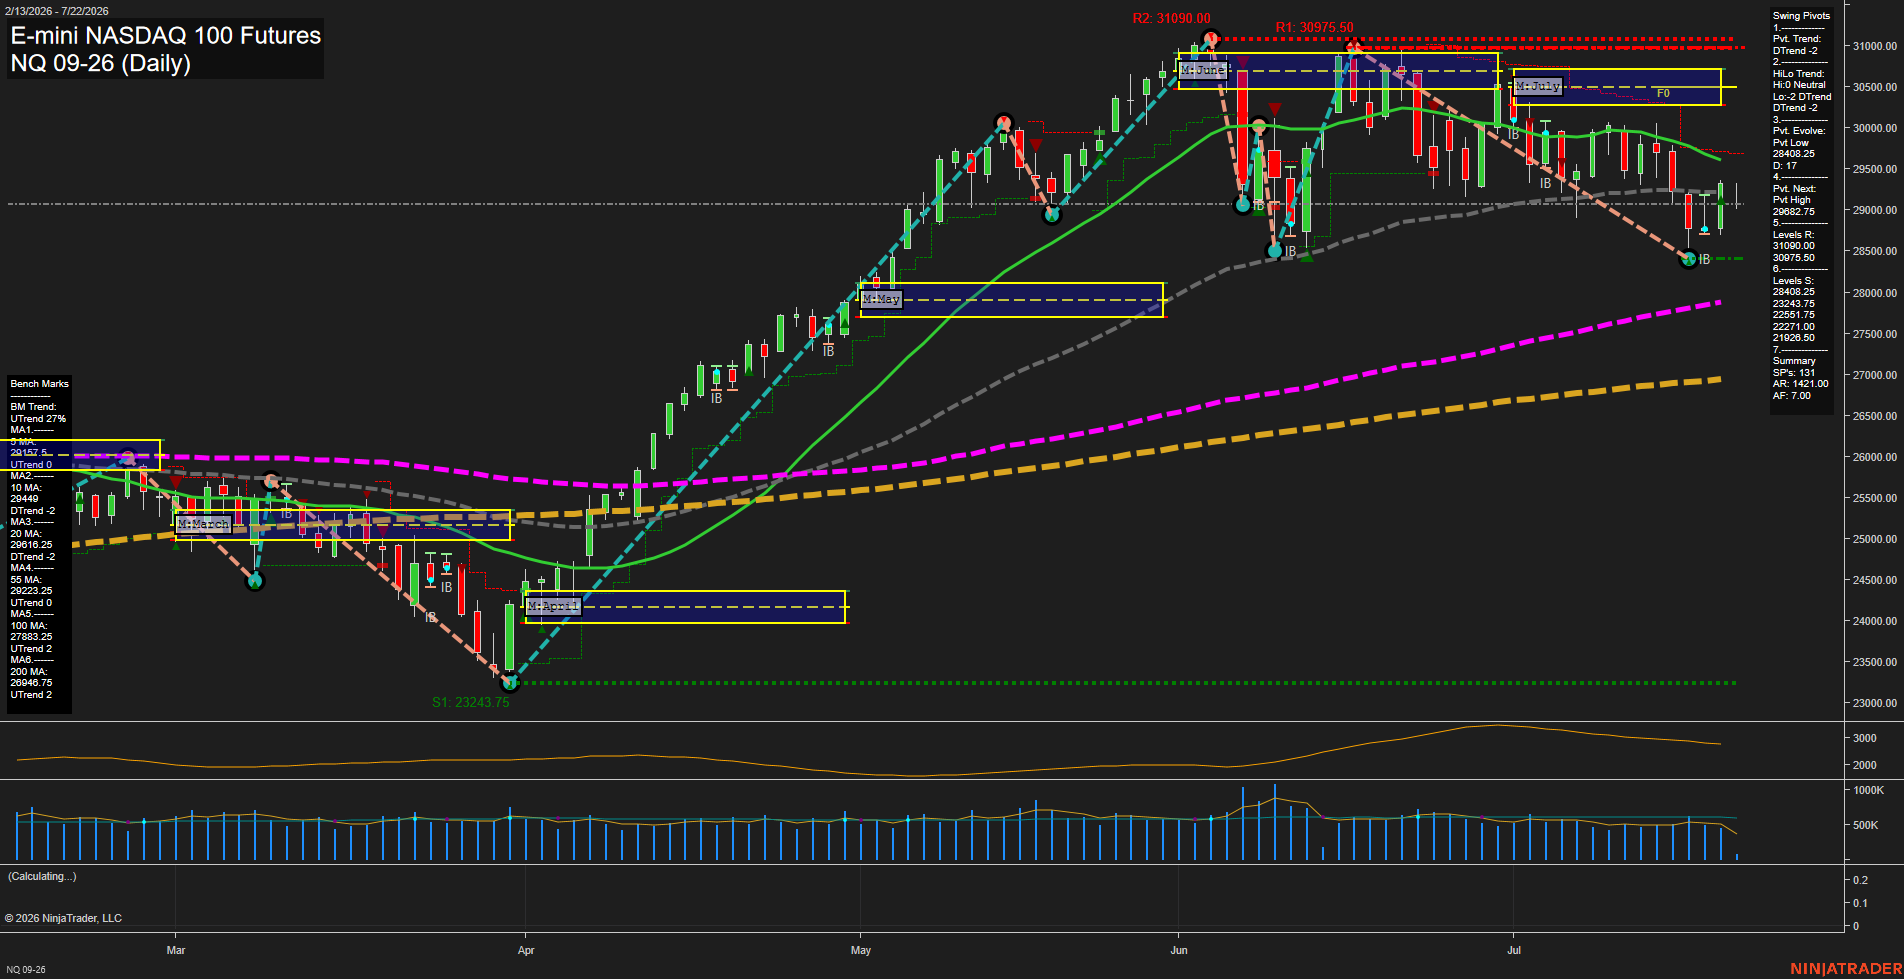
Overall Rating
- Short-Term: Neutral
- Intermediate-Term: Neutral
- Long-Term: Bullish.
Key Insights Summary
NQ is consolidating after a sharp July retracement from the 31,000 area, with a rebound from the 28,408 pivot low restoring price above the 20-day benchmark and weekly F0% level. Short-term structure remains mixed because the active pivot trend is down and price remains beneath the declining 10-day benchmark and the 55-day benchmark. The monthly grid remains bearish below F0%, while the higher-timeframe trend remains constructive above rising 100-day and 200-day benchmarks. The 29,882.75 next-pivot level defines the nearby recovery threshold, while 28,408.25 remains the principal swing support beneath the current consolidation.
View charts on: AlphaWebTrader HTF Charts
CL Daily View
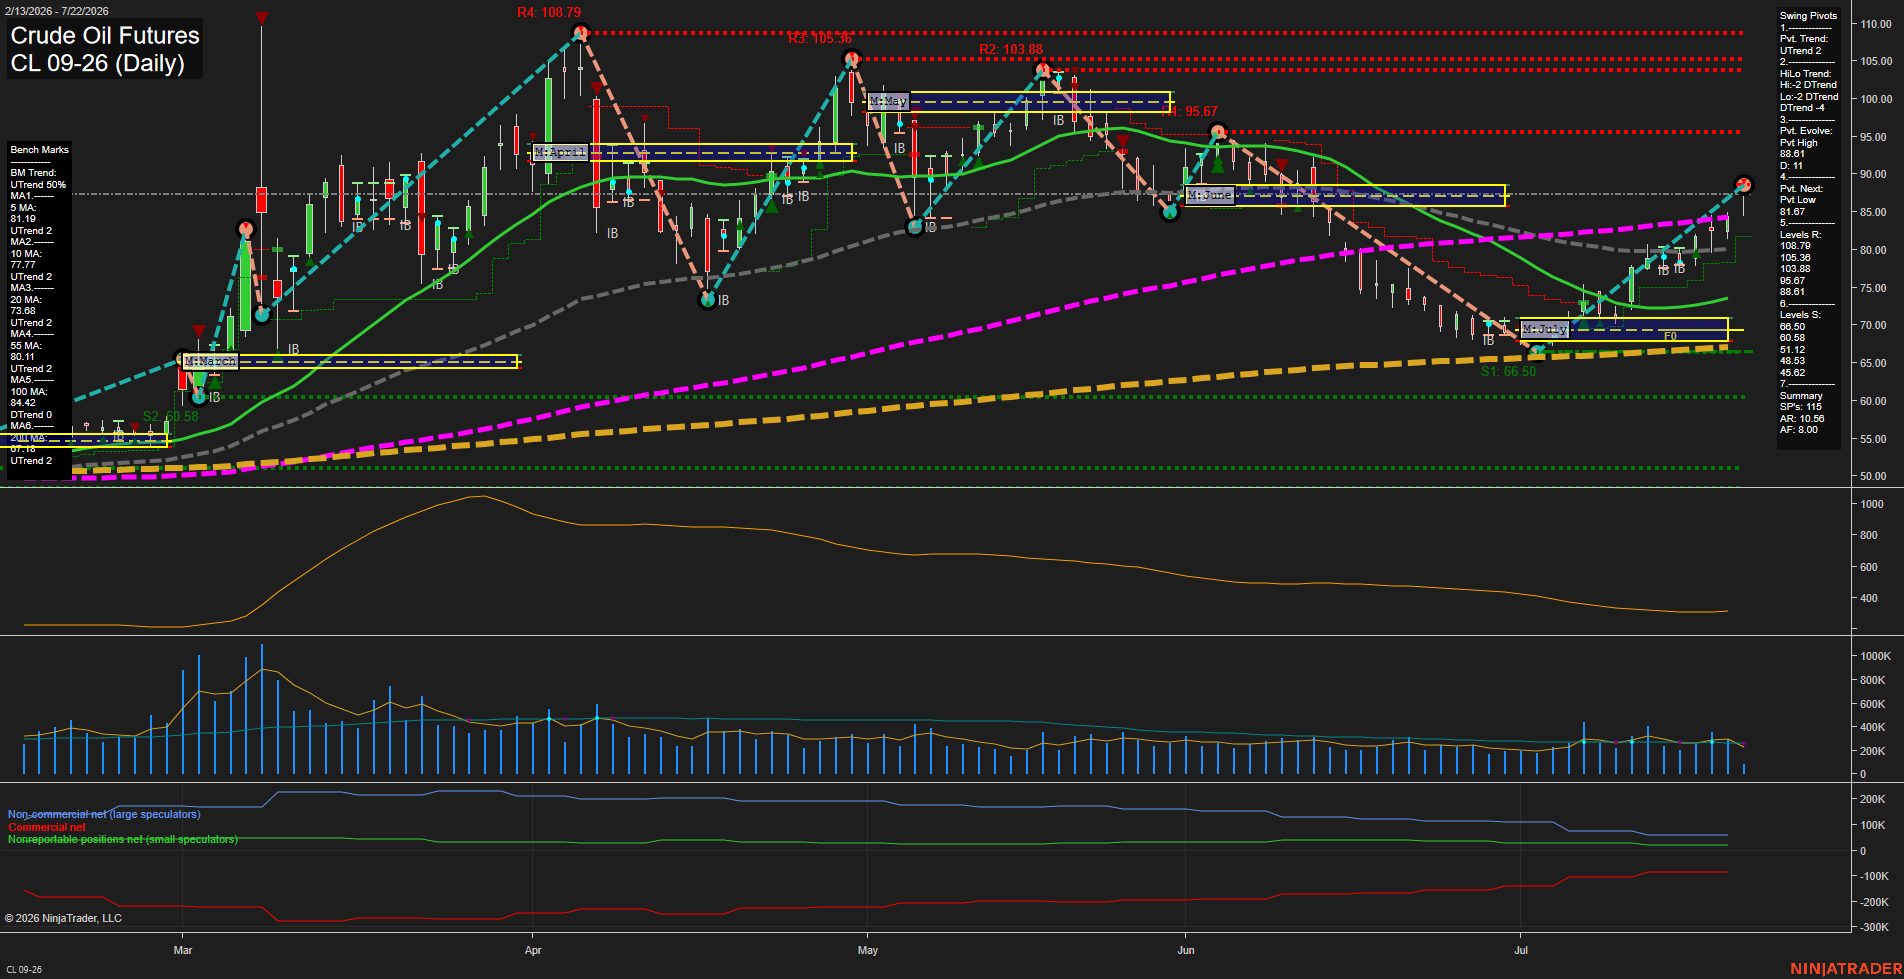
Overall Rating
- Short-Term: Bullish
- Intermediate-Term: Bullish
- Long-Term: Bullish.
Key Insights Summary
Price is in a strong July recovery leg, holding above the weekly and monthly Fib-grid centers while reclaiming all major daily benchmarks. The short-term pivot structure is upward and momentum is fast, with 88.11 and 88.61 forming the immediate pivot-resistance area. The intermediate HiLo structure remains downtrend-defined despite the rebound, reflecting the prior decline from the May highs and leaving 95.67 as the next major overhead reference. Rising 5-, 10-, 20-, 55-, and 200-day benchmarks support the broader recovery, while the declining 100-day average shows the longer-cycle trend transition remains incomplete.
View charts on: AlphaWebTrader HTF Charts
GC Daily View
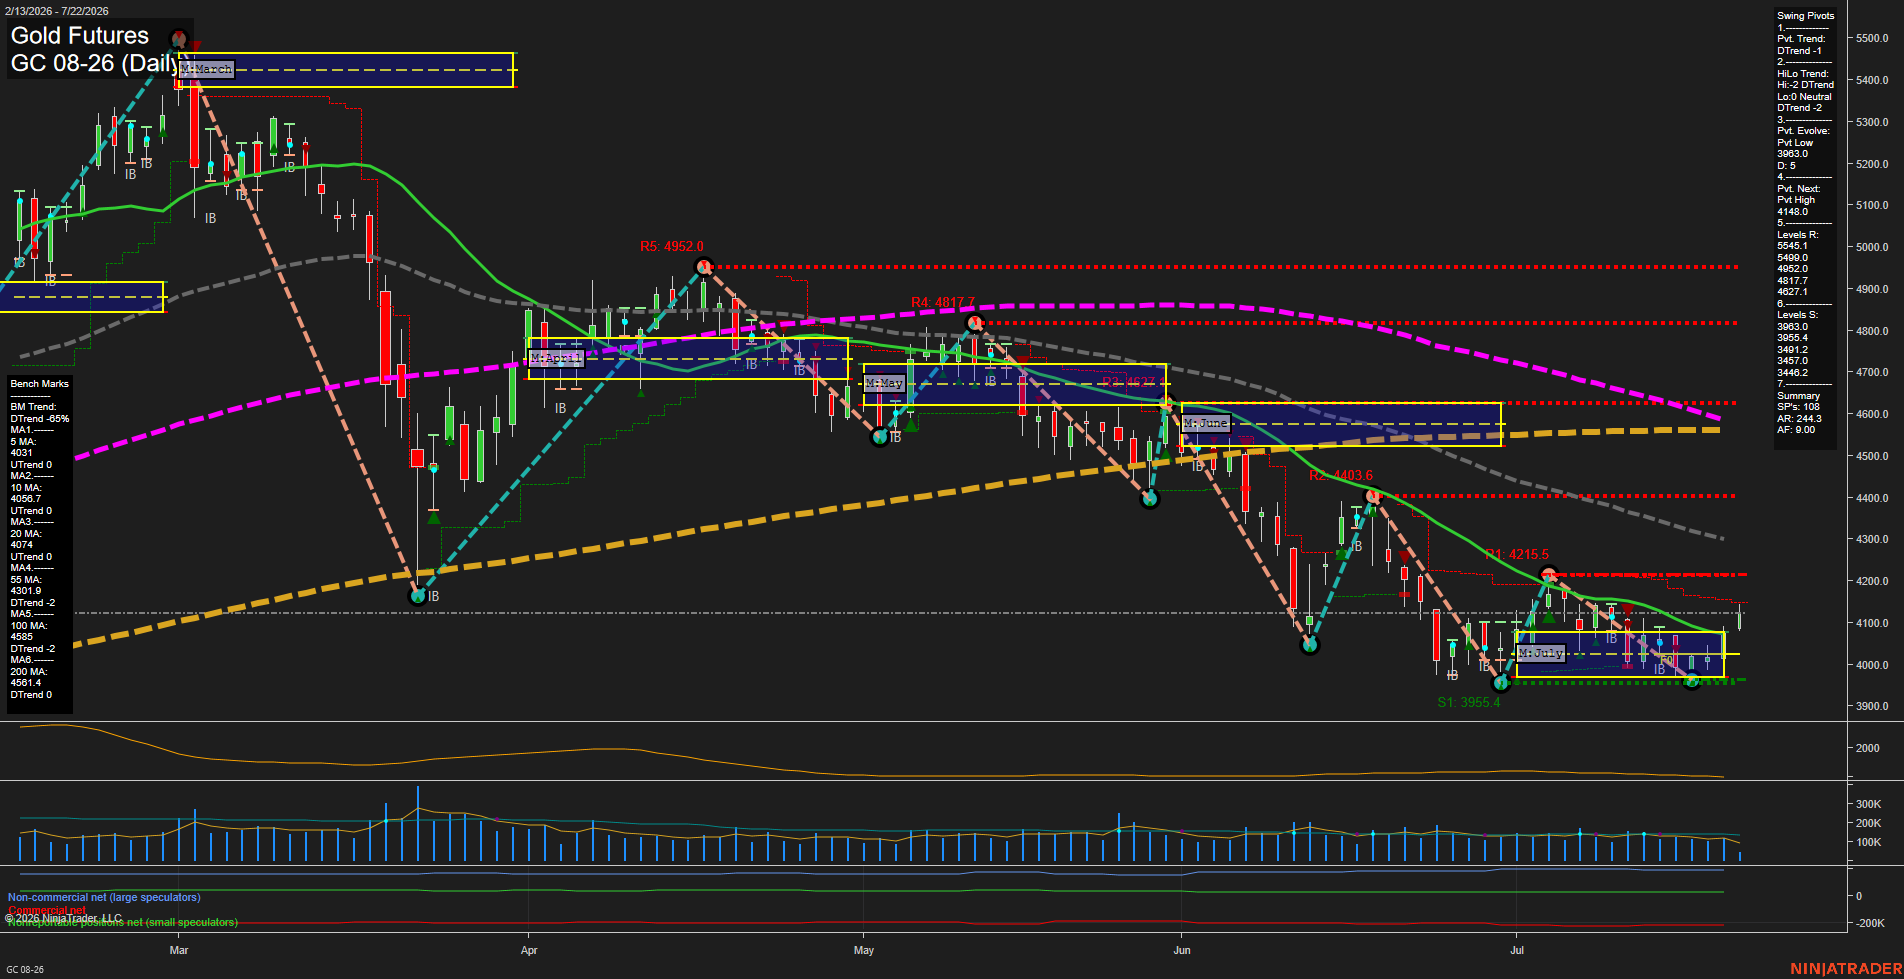
Overall Rating
- Short-Term: Bullish
- Intermediate-Term: Neutral
- Long-Term: Bearish.
Key Insights Summary
Gold is rebounding from the 3963 pivot-low area, with price above the rising 5-, 10-, and 20-day benchmarks and above the weekly and monthly F0% grids. The immediate swing structure remains classified as a downtrend, however, because the broader sequence retains lower highs and price remains below the declining 55-, 100-, and 200-day averages. The 4148 pivot-high reversal level is the nearby short-term structural test, while 3963-3955 remains the principal support zone. Price action reflects a recovery bounce within a larger bearish long-term trend.
View charts on: AlphaWebTrader HTF Charts