NYSE pre-market radar tracks mixed U.S. futures, ETF movers and support levels as Middle East oil risks, AI demand and valuation concerns shape sentiment.
Fundamentals: Global markets enter the NYSE pre-market session with Middle East conflict developments and disrupted Strait of Hormuz oil flows in focus. Asian equities gained on ceasefire reports, while crude supply concerns, inflation sensitivity and maritime risks remained elevated. AI infrastructure demand supported technology themes, alongside concerns over valuations, chip weakness, tariff pressure and record margin debt.
Technicals: U.S. index futures enter the session with long-term trends broadly constructive but near-term conditions mixed to bearish across several benchmarks. ES remains range-bound below key resistance, while NQ, YM, EMD, RTY and FDAX show active pullbacks within larger bullish structures. Microsoft, Alphabet and IBIT led prior-session gains, while Apple and Tesla declined.
Pre-Market Trading 360° view Market Radar of: holidays, earnings, eco-news, market-news summary, news sentiment, prior session major ETFs, MAG7, Higher Time Frame Analysis Indices Futures Summary, and E-mini S&P500, Nasdaq 100, NYMEX Crude, Gold Futures Daily Chart analysis.
As of: July 21, 2026 07:16 CT
Earnings Radar
Monitoring for earnings releases by the Magnificent 7, AI-tech-related firms, and major financial institutions.
- INTC Release: 2026-07-23 T:AMC
- GOOGL Release: 2026-07-22 T:AMC
- IBM Release: 2026-07-22 T:AMC
- TSLA Release: 2026-07-22 T:AMC
Conclusion: GOOGL, TSLA, and IBM report after the July 22 close, followed by INTC after the July 23 close, concentrating broad index, AI, technology, and semiconductor earnings sensitivity across two sessions. Market momentum and volume can slow ahead of these major releases, with post-release index futures reaction centered on reported results and guidance.
For full details visit: Yahoo Earnings Calendar
EcoNews Radar U.S. Events
| Day | Time | Impact | Event |
|---|---|---|---|
| Wed | 10:30 | Low | Crude Oil Inventories |
| Thu | 08:30 | Medium | Unemployment Claims |
EcoNews Summary
No qualifying high-impact EcoNews events are listed. The key listed release is the energy-related U.S. crude oil inventories report on Wednesday, which provides petroleum supply context and can affect energy-price sensitivity across index futures markets.
Event Notes:
- Wednesday 10:30 – USD Crude Oil Inventories: Measures the weekly change in U.S. commercial crude oil stockpiles. Traders monitor the report for petroleum supply conditions and its relationship to crude oil and broader inflation-sensitive market pricing.
Conclusion:
The single most important listed event is Wednesday’s 10:30 USD Crude Oil Inventories report. Crude inventory data relate directly to petroleum supply and energy prices. High oil prices directly affect markets through inflation and geopolitical concerns.
For full details visit: Forex Factory EcoNews
Market News Summary:
Middle East conflict developments, disrupted oil flows, and inflation concerns dominated the global market backdrop, while Asian equities gained on ceasefire hopes.
Primary Drivers & Risks:
- Primary Driver: Middle East oil supply disruption
- Primary Risk: Energy-driven inflation and leverage
Tone:
Mixed risk appetite, with energy and geopolitical pressures elevated.
Stock Market / ETFs / Indices:
Asian equities advanced on renewed hopes for a U.S.-Iran ceasefire. AI infrastructure demand and memory-chip scarcity remained supportive technology themes, while record margin debt, recent chip-sector weakness, elevated broad-market valuations, and renewed tariff threats added equity-market risk.
Geopolitical:
U.S.-Iran hostilities resumed, with U.S. strikes continuing and Iranian transit disruption evident in the Strait of Hormuz. Mediation reports supported ceasefire hopes, while Houthi threats of a Saudi naval blockade added regional shipping risk.
Oil / Energy:
Oil prices softened as mediation efforts offset fresh military escalation, but crude supply risk remained prominent. Reduced Hormuz traffic, falling U.S. crude inventories, strong LNG exports, and Red Sea risks supported the energy complex; IEA members have released 290 million barrels of oil since March 11.
Gold / Metals:
Gold traded near $4,000 after falling from levels above $5,000 earlier in the year. Central-bank buying, including Chinese dip buying, remained a support factor amid conflict and Fed uncertainty; silver also drew attention after a technical trendline break.
Fed / Financials:
Elevated oil prices renewed concern over headline inflation and reinforced attention on upside inflation risks for the Federal Reserve. European banks faced a supportive earnings backdrop from higher rates, trading activity, and investment-banking revenue; U.K. unemployment and wage growth were steady, supporting expectations for unchanged Bank of England policy.
Macro / Other:
Europe and parts of Asia faced greater exposure to an energy-price shock because of import dependence. U.S. auto makers were replacing Chinese connected-car hardware amid a federal supply-chain push, while tariff pressure involving Canada added another cross-border trade concern.
Conclusion:
Oil supply disruption and U.S.-Iran conflict headlines remained the central drivers for global index futures. Ceasefire-related optimism supported Asian risk appetite, while AI infrastructure demand provided an offsetting equity theme.
Higher energy prices kept inflation and Fed-policy sensitivity elevated. Record margin debt, high equity valuations, tariff threats, and fragile maritime transit added cross-currents for risk assets.
Market News Sentiment
Market News Articles: 57
- Neutral: 50.88%
- Negative: 35.09%
- Positive: 14.04%
Sentiment Summary: Market news sentiment is predominantly neutral (51%), with a substantial negative share (35%) and limited positive coverage (14%).
Conclusion: Indices futures traders face a neutral news backdrop with negative sentiment outweighing positive sentiment.
GLD,Gold Articles: 13
- Positive: 38.46%
- Negative: 30.77%
- Neutral: 30.77%
Sentiment Summary: Gold-related coverage is mixed, with 38% positive, 31% negative, and 31% neutral sentiment across 13 articles.
Conclusion: The news tone for GLD and gold is slightly positive but broadly balanced, offering limited directional consensus for indices futures day traders.
USO,Oil Articles: 15
- Neutral: 46.67%
- Negative: 40.00%
- Positive: 13.33%
Sentiment Summary: USO and oil coverage is predominantly neutral (47%), with substantial negative sentiment (40%) and limited positive sentiment (13%).
Conclusion: For indices futures day traders, oil-related news tone is mixed but skewed toward neutral-to-negative coverage.
Market Data Snapshot
ETF Snapshot of major stock market ETFs, Mag7, and others as of: July 21, 2026 07:16
Top Movers & Losers
- MSFT 402.29 Bullish 2.15% ▲
- GOOG 351.37 Bullish 1.52% ▲
- IBIT 36.89 Bullish 1.49% ▲
- IJH 74.93 Bearish -0.81% ▼
- AAPL 326.59 Bearish -2.14% ▼
- TSLA 369.57 Bearish -2.96% ▼
Major Index ETFs: SPY, QQQ, DIA, IWM, IJH
- QQQ 696.06 Bullish 0.10% ▲
- SPY 742.09 Bearish -0.16% ▼
- DIA 517.94 Bearish -0.55% ▼
- IWM 292.31 Bearish -0.59% ▼
- IJH 74.93 Bearish -0.81% ▼
Mixed index ETF backdrop: QQQ is the most bullish mover at +0.10%, a marginal gain, while IJH is the most bearish mover at -0.81%. SPY is near-flat at -0.16%, with DIA at -0.55% and IWM at -0.59% also Bearish.
Mag 7 Stocks: AAPL, MSFT, GOOG, AMZN, META, NVDA, TSLA
- MSFT 402.29 Bullish 2.15% ▲
- GOOG 351.37 Bullish 1.52% ▲
- AMZN 249.99 Bullish 1.12% ▲
- NVDA 203.28 Bullish 0.23% ▲
- META 645.85 Bearish -0.02% ▼
- AAPL 326.59 Bearish -2.14% ▼
- TSLA 369.57 Bearish -2.96% ▼
Mixed: MSFT is the most bullish mover at +2.15%, followed by GOOG at +1.52% and AMZN at +1.12%. NVDA is modestly Bullish at +0.23%. META is marginally Bearish at -0.02%, while AAPL is Bearish at -2.14%. TSLA is the most bearish mover at -2.96%.
Cross-Market ETFs: TLT, GLD, USO, IBIT
- IBIT 36.89 Bullish 1.49% ▲
- USO 125.51 Bullish 1.25% ▲
- GLD 367.60 Bearish -0.22% ▼
- TLT 83.89 Bearish -0.75% ▼
Mixed cross-market snapshot: IBIT is the most bullish mover at +1.49%, followed by USO at +1.25%. TLT is the most bearish mover at -0.75%, while GLD is marginally bearish at -0.22%.
ETF, Mag7, and Cross-Market ETF Insights
Overall Tone
Mixed: Mag7 leadership and gains in Bitcoin and oil contrast with broad small- and mid-cap ETF weakness, alongside declines in Treasuries and gold.
Equity ETFs and Mag7:
Major Index ETFs are Mixed, with QQQ marginally Bullish at +0.10% while SPY was Bearish at -0.16%, DIA at -0.55%, IWM at -0.59%, and IJH at -0.81%. Mag7 performance was selective: MSFT led with the most bullish move at +2.15%, followed by GOOG at +1.52% and AMZN at +1.12%, while TSLA was the most bearish mover at -2.96% and AAPL fell -2.14%. NVDA was modestly Bullish at +0.23% and META was near-flat Bearish at -0.02%, showing concentrated large-cap leadership rather than broad equity alignment.
Cross-Market ETFs:
Cross-market ETFs were Mixed, led by IBIT as the most bullish mover at +1.49%, with USO also Bullish at +1.25%. TLT was the most bearish mover at -0.75%, while GLD declined -0.22%, indicating weakness in both Treasury and gold hedging instruments despite strength in Bitcoin and oil.
Futures Indices – Higher Time Frame Analysis
Summary of the current state of US Indices Futures based on higher time-frame (HTF) technical analysis as of: 2026-07-21: 07:16 CT.
US Indices Futures
- ES: YSFG/WSFG above F0%, MSFG below; benchmarks rising; UTrend; support 7470.50/7292.00, resistance 7632.00-7693.50.
- NQ: YSFG/WSFG above F0%, MSFG below; daily DTrend; rising long benchmarks; support 28408.25, reversal 29704.25, resistance 31090.00.
- YM: YSFG above F0%, WSFG/MSFG below centers; short-term DTrend; rising long benchmarks; support 51936/51009, resistance 53127/53658.
- EMD: YSFG above F0%, WSFG/MSFG below; pullback under short benchmarks; support 3721.1/3692.9, resistance 3892.4.
- RTY: YSFG/WSFG above F0%, MSFG below; daily DTrend within rising benchmarks; support 2944.3/2835.6, resistance 3014.4/3068.4.
- FDAX: YSFG near F0%, MSFG below; daily DTrend under short benchmarks; support 24787/22210, resistance 25481/26064.
Overall State
- Short-Term: Bearish
- Intermediate-Term: Neutral
- Long-Term: Bullish
Conclusion
Daily structures are predominantly in retracement or DTrend conditions beneath short-term benchmarks and monthly grids. Weekly and yearly structures retain broad bullish alignment, with rising longer-term benchmarks across all contracts. ES, RTY, and FDAX retain weekly upward pivot structure; NQ, YM, and EMD show more active corrective pressure. Listed pivot supports and resistance levels define current HTF swing boundaries.
Note: Intra-day counter-trend pullbacks or retracements may occur, HTF is context for informational usage and market structure. Glossary: Session Fib Grids periods of YSFG:’Yearly’, MSFG:’Monthly’, WSFG:’Weekly’
For full details visit: AlphaWebTrader Technicals
ES Daily View
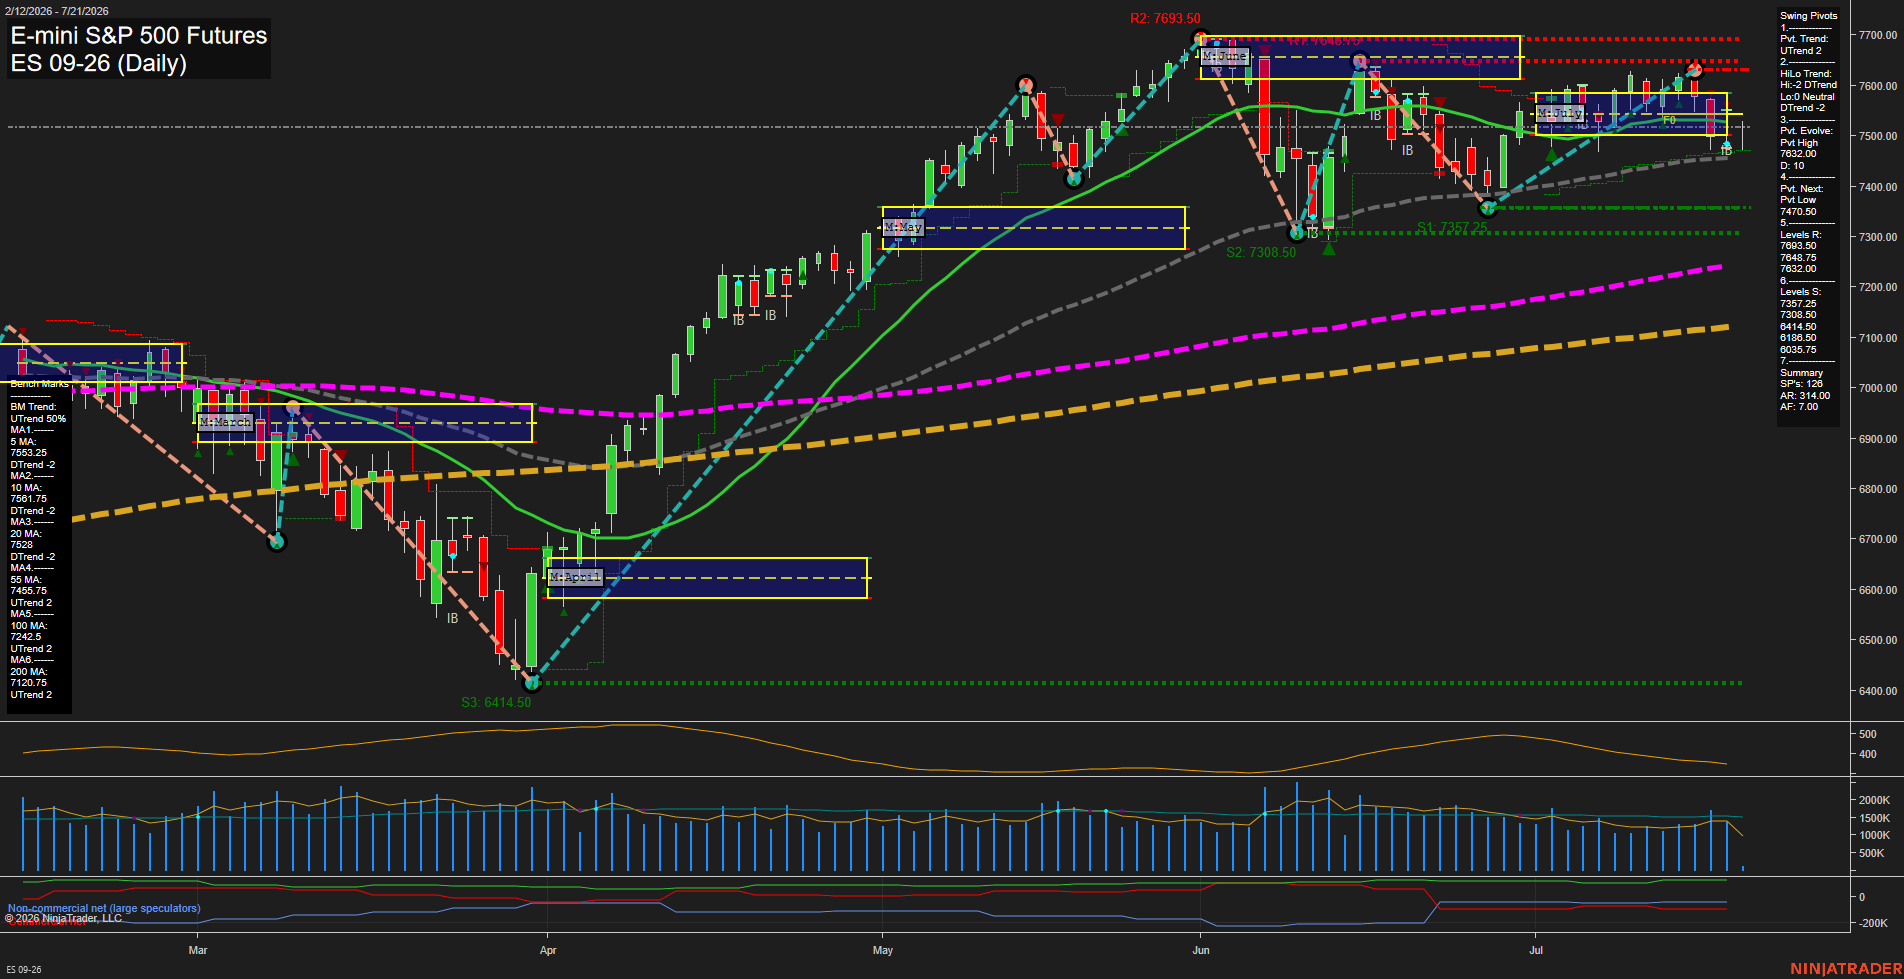
Overall Rating
- Short-Term: Neutral
- Intermediate-Term: Bearish
- Long-Term: Bullish.
Key Insights Summary
Price is consolidating beneath the declining 5-, 10-, and 20-day benchmarks after rejection from the 7632 to 7648.75 pivot-resistance area. The short-term pivot structure remains UTrend, but momentum has slowed and the monthly grid remains below its F0% level, reflecting an intermediate counter-trend pullback within a still-positive long-term structure. The 7470.50 pivot-low reversal level and rising 55-day average near 7455.75 define the nearby support zone, while 7632.00, 7648.75, and 7693.50 remain the overhead swing-resistance sequence. Long-term trend alignment remains constructive above the rising 100- and 200-day averages, while elevated ATR reflects a broad daily trading range and choppy price rotation.
View charts on: AlphaWebTrader HTF Charts
NQ Daily View
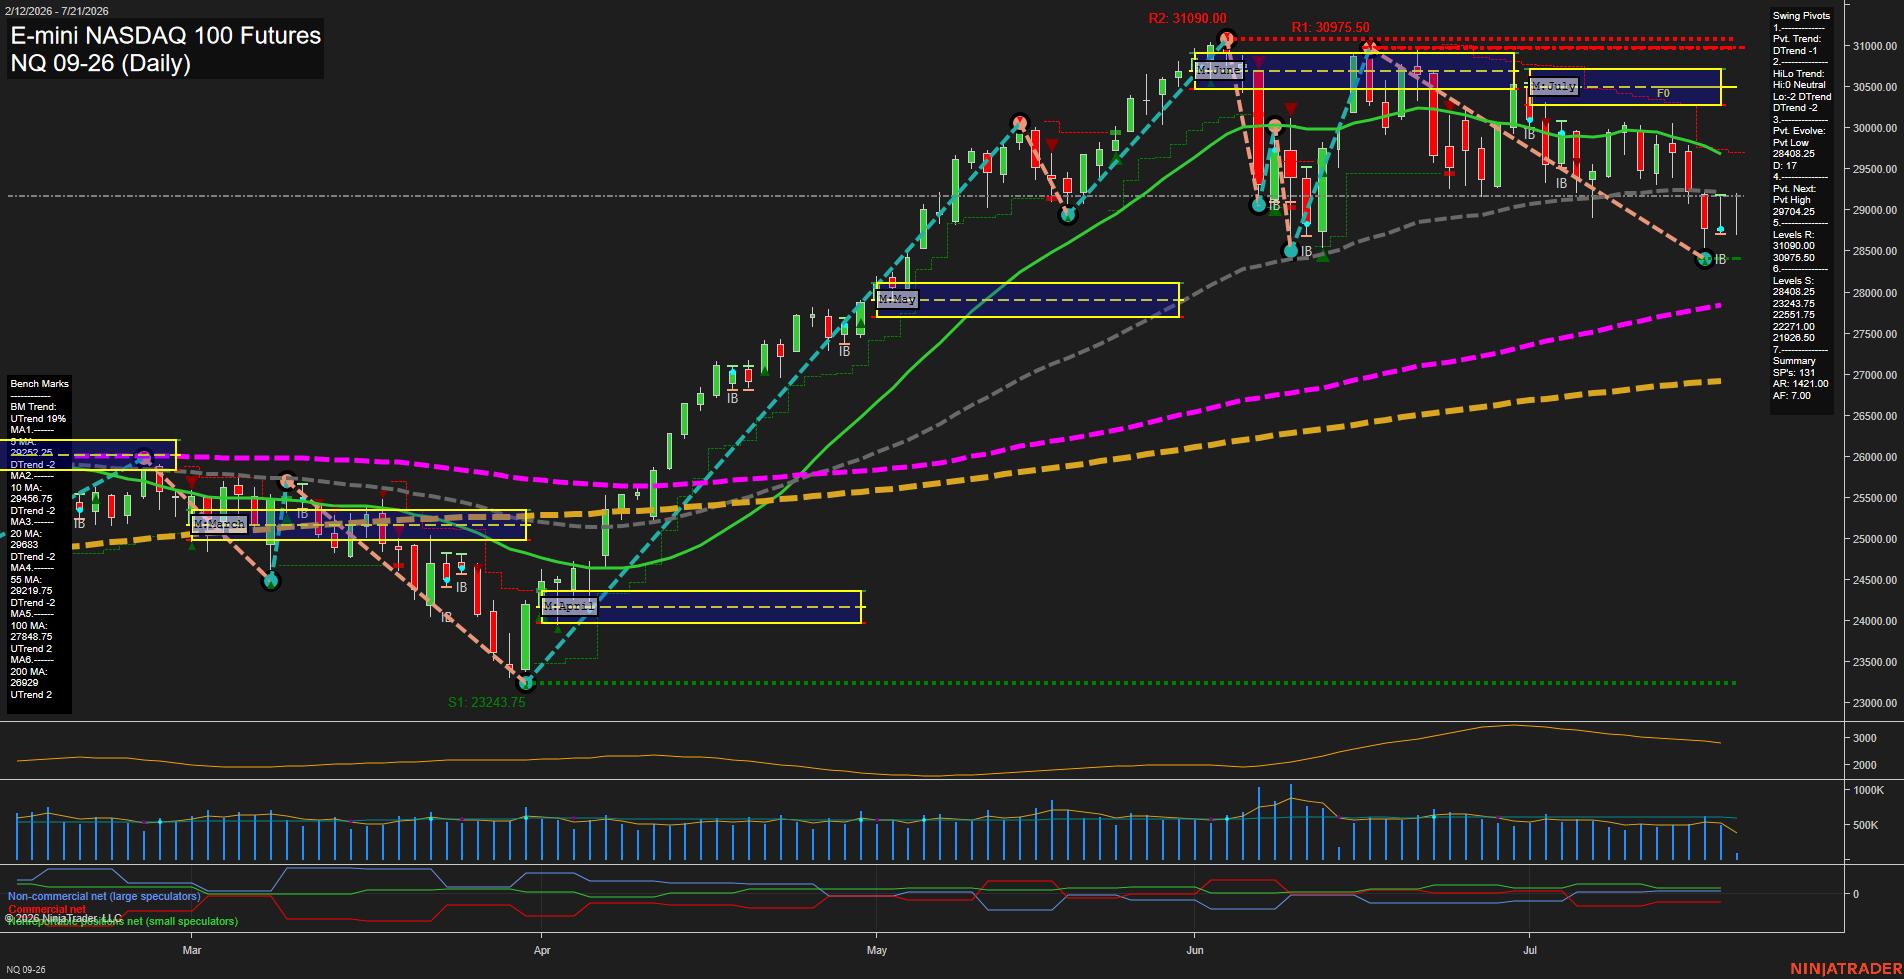
Overall Rating
- Short-Term: Bearish
- Intermediate-Term: Bearish
- Long-Term: Bullish.
Key Insights Summary
The daily structure reflects a countertrend decline within a still-positive long-term advance. Price is below the declining 10-, 20-, and 55-day benchmarks and the monthly F0% level, while the short-term pivot trend remains down. The weekly grid remains positive, indicating the decline is occurring above the broader weekly framework, but momentum has slowed and recent bars show a lower-high sequence. The 28408.25 pivot low is the immediate structural support, while 29704.25 is the defined reversal level for a new short-term pivot high. Longer-term trend support remains constructive through the rising 100- and 200-day averages and the positive yearly grid position.
View charts on: AlphaWebTrader HTF Charts
CL Daily View
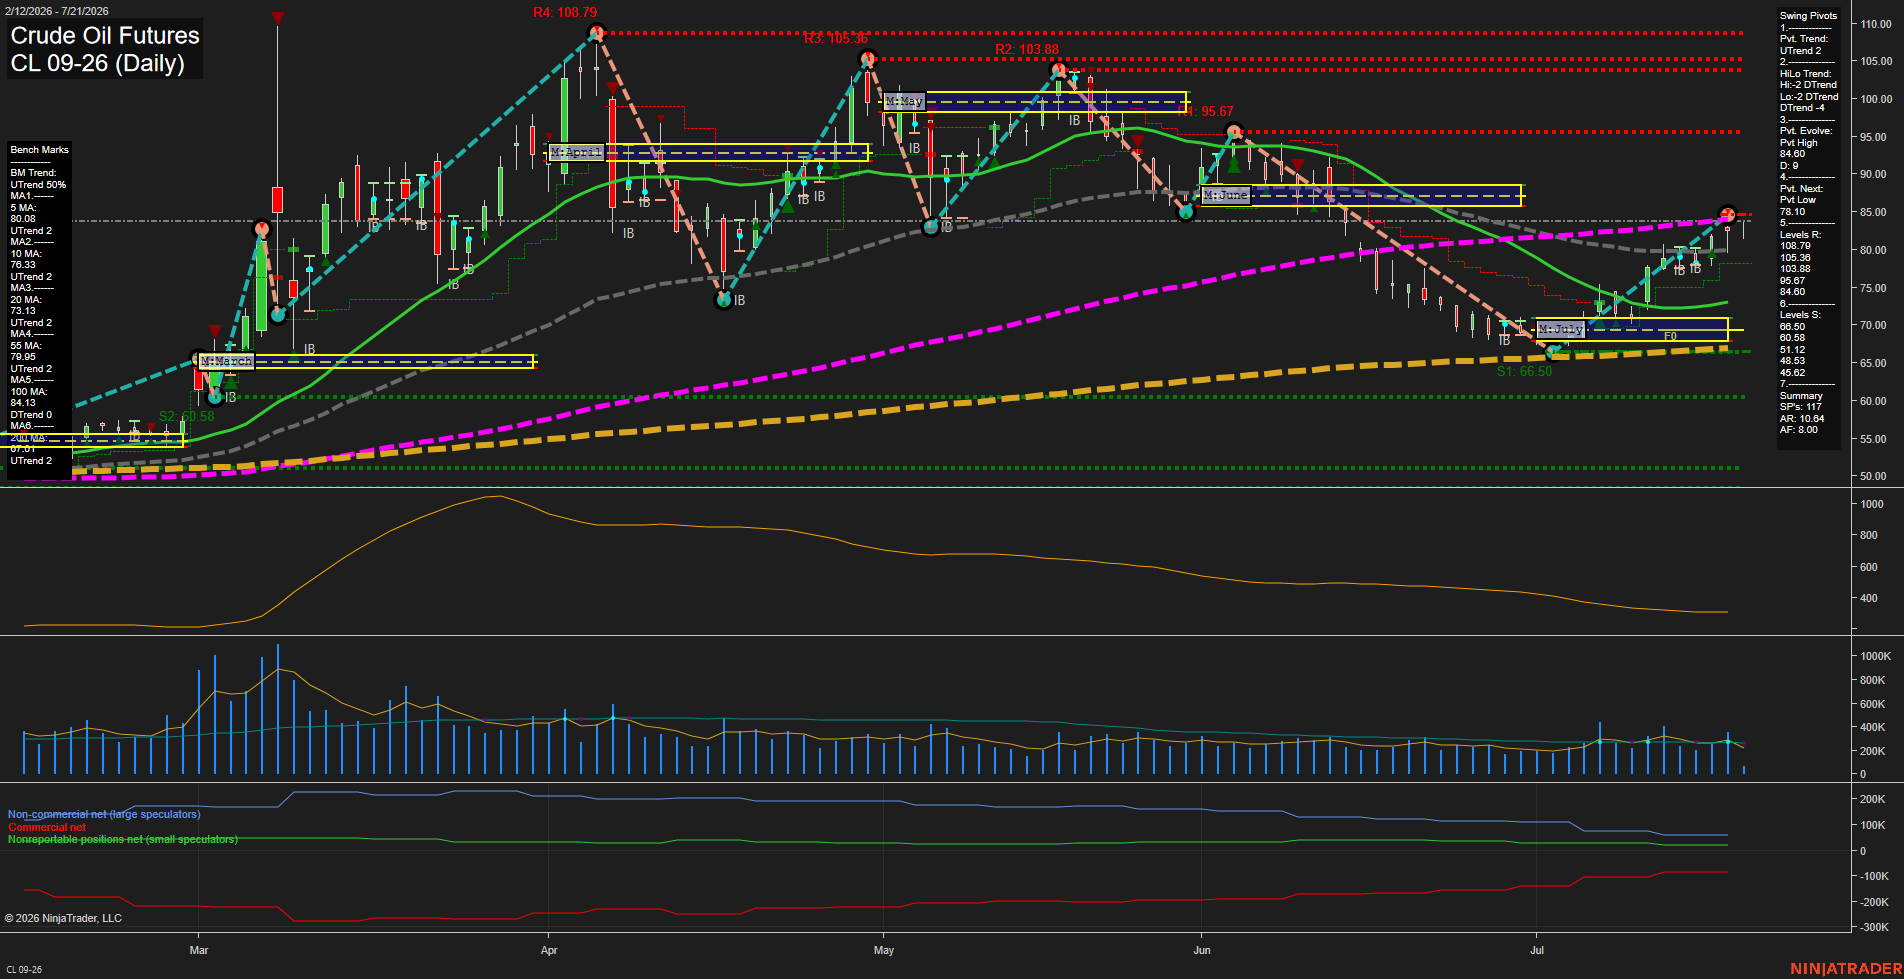
Overall Rating
- Short-Term: Bullish
- Intermediate-Term: Bullish
- Long-Term: Bullish.
Key Insights Summary
CL has completed a sharp V-style recovery from the early-July low near 66.50 and is holding above the weekly and monthly F0%/NTZ structures. Short-term pivot structure is upward, with price above all short- and intermediate-term benchmarks and reclaiming the declining 100-day average near 84.13. The intermediate HiLo pivot trend remains down, reflecting the broader decline from the April and May highs, but the recovery has established higher lows and shifted momentum higher. The 84.60 pivot-high level has been exceeded, making 95.67 the next major overhead pivot resistance, while 78.10 is the nearby pivot-reversal reference. Volume has remained moderate versus earlier peaks and ATR is declining from spring extremes, indicating a less volatile but still active recovery phase.
View charts on: AlphaWebTrader HTF Charts
GC Daily View
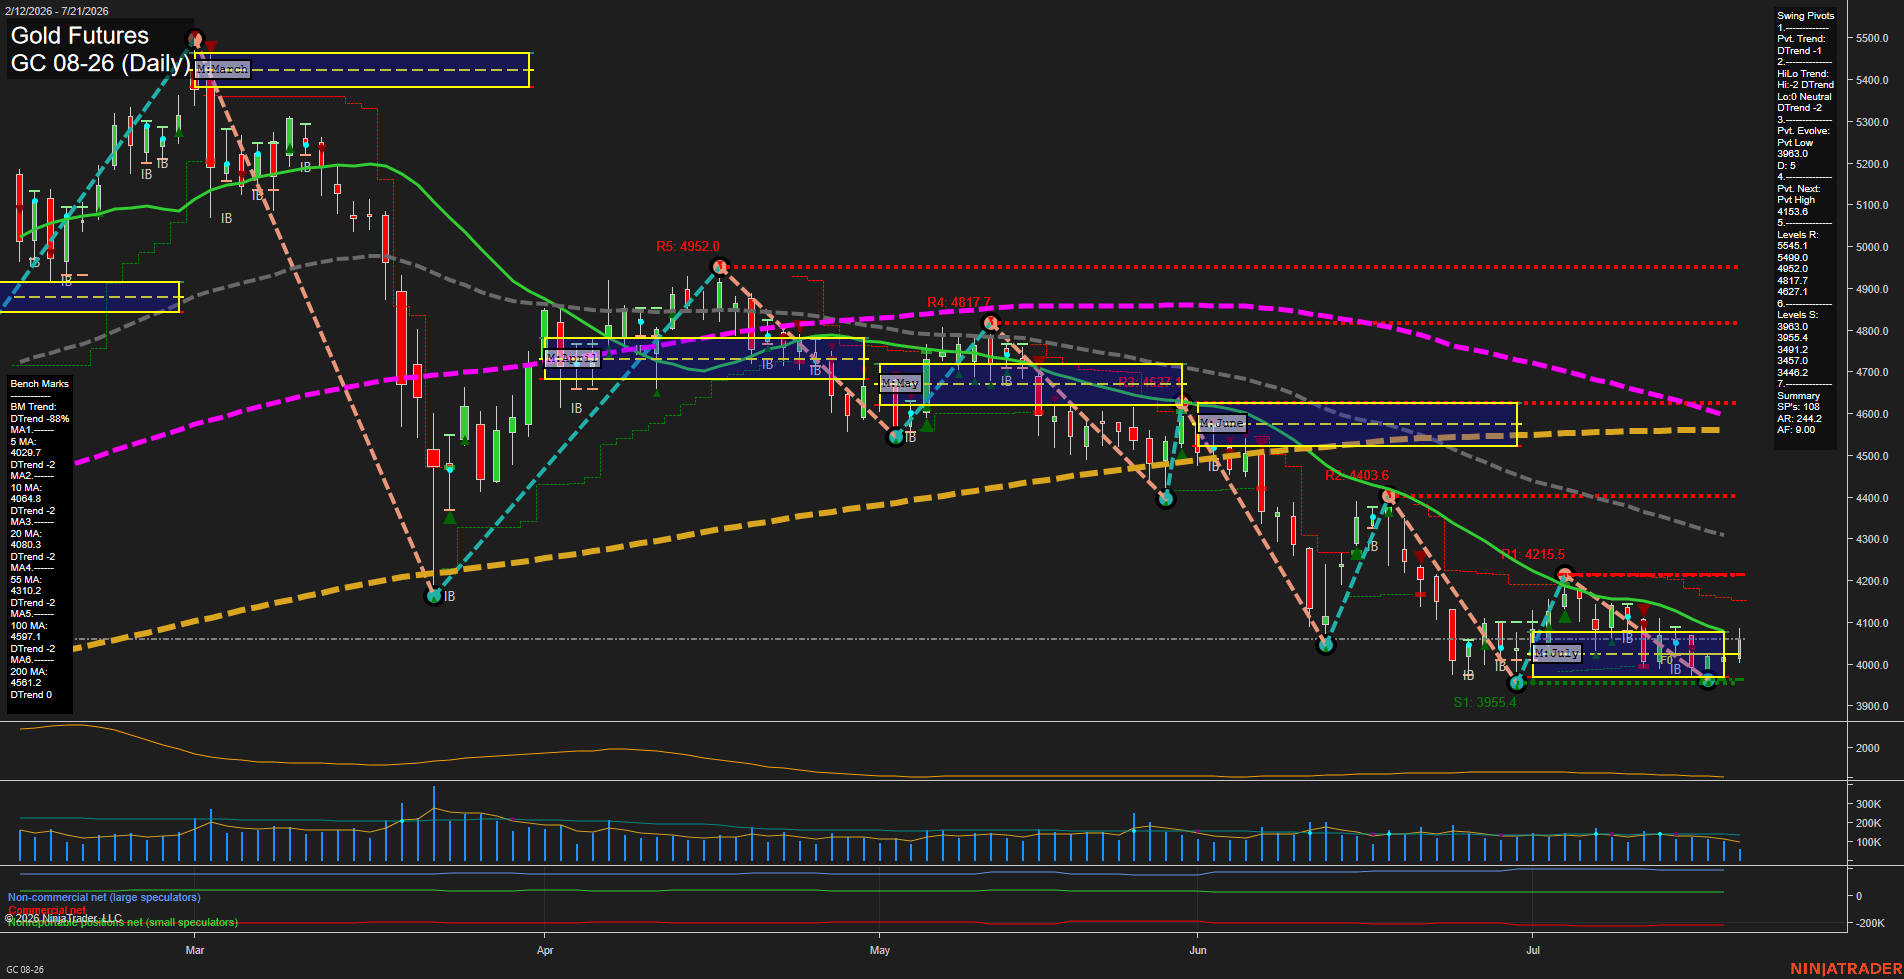
Overall Rating
- Short-Term: Neutral
- Intermediate-Term: Bearish
- Long-Term: Bearish.
Key Insights Summary
Gold is consolidating in a narrow, low-momentum range just above the clustered 3951.9-3955.4 swing-support area following a broader sequence of lower highs and lower lows. Short-term WSFG structure is constructive, but price remains beneath the declining 10-, 20-, 55-, 100-, and 200-day benchmarks, while both pivot-trend measures remain in DTrend. The 4153.6 pivot-next level and 4215.5 resistance define the near-term upside swing threshold; the July range has so far displayed compression rather than a confirmed trend reversal. Intermediate and long-term structure remains dominated by the decline from the spring highs, despite the current stabilization above support.
View charts on: AlphaWebTrader HTF Charts