NYSE pre-market futures slipped as U.S.-Iran tensions lifted oil, while ETF movers, mixed daily charts and major tech earnings remained in focus.
Fundamentals: U.S. index futures weakened as escalating U.S.-Iran hostilities pushed crude prices toward $95 per barrel and renewed concerns about energy-driven inflation. Nasdaq 100 futures led losses ahead of Alphabet, IBM and Tesla earnings, with semiconductor exposure and AI spending pressures weighing on technology sentiment. Energy shares, gold and silver advanced, while crude inventory data remained on the economic calendar.
Technicals: USO, Tesla and IBIT led prior-session ETF gains, while Amazon, Microsoft and Alphabet declined. Futures technical readings show broadly bullish long-term structures across major contracts, though daily charts remain mixed as ES, NQ, YM, EMD and RTY consolidate below recent highs. FDAX retains a constructive intermediate and long-term posture following its rebound.
Pre-Market Trading 360° view Market Radar of: holidays, earnings, eco-news, market-news summary, news sentiment, prior session major ETFs, MAG7, Higher Time Frame Analysis Indices Futures Summary, and E-mini S&P500, Nasdaq 100, NYMEX Crude, Gold Futures Daily Chart analysis.
As of: July 22, 2026 07:16 CT
Earnings Radar
Monitoring for earnings releases by the Magnificent 7, AI-tech-related firms, and major financial institutions.
- INTC Release: 2026-07-23 T:AMC
- GOOGL Release: 2026-07-22 T:AMC
- IBM Release: 2026-07-22 T:AMC
- TSLA Release: 2026-07-22 T:AMC
Conclusion: GOOGL, TSLA, and IBM report after the close on July 22, concentrating broad technology, AI, and index-relevant earnings information into the post-market session; INTC follows after the close on July 23, extending semiconductor focus. Market momentum and volume can slow ahead of these major technology and semiconductor earnings releases.
For full details visit: Yahoo Earnings Calendar
EcoNews Radar U.S. Events
| Day | Time | Impact | Event |
|---|---|---|---|
| Wed | 10:30 | Low | Crude Oil Inventories |
| Thu | 08:30 | Medium | Unemployment Claims |
EcoNews Summary
No qualifying high-impact EcoNews events are listed. The relevant energy-related release is Wednesday’s U.S. Crude Oil Inventories report, which provides a supply-and-demand signal for crude and energy markets. Thursday’s medium-impact Unemployment Claims release is excluded because it is not directly related to oil, crude inventories, energy prices, or petroleum supply.
Event Notes:
- Wednesday 10:30 – USD Crude Oil Inventories: Measures the weekly change in U.S. commercial crude oil stockpiles. Traders monitor inventory draws and builds as indicators of petroleum supply conditions, refinery activity, and demand trends, with implications for crude and energy-price movement.
Conclusion:
The single most important event of the week is Wednesday’s 10:30 USD Crude Oil Inventories release. As an energy-supply report released around the 10 AM time cycle, it serves as a potential market catalyst for reversals or continuations. High oil prices directly affect markets through inflation and geopolitical concerns.
For full details visit: Forex Factory EcoNews
Market News Summary:
U.S. index futures weakened as escalating U.S.-Iran conflict lifted oil prices and investors reduced semiconductor exposure ahead of major technology earnings.
Primary Drivers & Risks:
- Primary Driver: Iran conflict pushes oil toward $95
- Primary Risk: Energy inflation and technology earnings pressure
Tone:
Risk-off, with energy strength offset by technology caution.
Stock Market / ETFs / Indices:
Nasdaq 100 futures led declines before Alphabet and Tesla earnings, following a chip-led rebound. Technology weakness had weighed on major benchmarks, while energy and defensive areas held up better; AI capital spending and GPU depreciation also raised concerns over software-sector margins and Big Tech free cash flow. Elevated S&P 500 valuations and rising short interest added opposing market-positioning signals.
Geopolitical:
U.S. strikes on Iranian military targets continued for an 11th straight night, while Kuwait reported Iranian drone attacks. Officials described Iran as not serious about talks, keeping conflict and supply-disruption concerns elevated.
Oil / Energy:
Oil rose on Middle East supply concerns, with reports placing prices near $95 per barrel and Brent discussion extending toward $98. The conflict also threatened refinery output increases and kept global fuel-stock conditions tight; energy shares gained alongside crude.
Gold / Metals:
Gold and silver advanced, supported by softer bond yields, a weaker dollar, central-bank buying, industrial demand, and technical momentum. Gold commentary focused on the $4,200 level.
Fed / Financials:
Renewed inflation concerns tied to the conflict returned rate-hike discussion for 2026. Upcoming Fed and ECB meetings remained a focus for precious-metals and broader market participants.
Macro / Other:
Planned U.S. tariffs on imported generic drugs include a two-year zero-tariff period followed by a 100% levy in 2028 and a 200% rate a year later. Private-equity assets held in long-running “zombie funds” reached a record as managers struggled to exit remaining holdings.
Conclusion:
Escalating U.S.-Iran hostilities and the oil-price move were the dominant macro drivers. Energy-sector strength contrasted with lower index futures and semiconductor selling before Big Tech results.
Higher energy costs intensified inflation and rate-policy concerns. Technology valuation, AI spending, cash-flow pressure, and elevated short interest remained significant cross-currents.
Market News Sentiment
Market News Articles: 34
- Negative: 38.24%
- Neutral: 35.29%
- Positive: 26.47%
Sentiment Summary: Market news sentiment is mixed to negative, with 38% negative, 35% neutral, and 26% positive articles across 34 reports.
Conclusion: Indices futures day traders are facing a slightly negative news backdrop, while neutral coverage remains a substantial share.
GLD,Gold Articles: 12
- Positive: 66.67%
- Negative: 25.00%
- Neutral: 8.33%
Sentiment Summary: GLD and gold coverage was predominantly positive at 67%, with 25% negative and 8% neutral across 12 articles.
Conclusion: Gold-related sentiment was net positive, indicating a generally supportive news tone relevant to indices futures market context.
USO,Oil Articles: 11
- Positive: 45.45%
- Negative: 36.36%
- Neutral: 18.18%
Sentiment Summary: USO/Oil coverage is mixed-to-positive, with 45% positive, 36% negative, and 18% neutral articles across 11 items.
Conclusion: Oil-related headlines present a modestly positive tone, while substantial negative coverage indicates balanced risk sentiment for indices futures day traders.
Market Data Snapshot
ETF Snapshot of major stock market ETFs, Mag7, and others as of: July 22, 2026 07:16
Top Movers & Losers
- USO 128.85 Bullish 2.66% ▲
- TSLA 378.93 Bullish 2.53% ▲
- IBIT 37.67 Bullish 2.11% ▲
- AMZN 247.55 Bearish -0.98% ▼
- MSFT 397.75 Bearish -1.13% ▼
- GOOG 346.19 Bearish -1.47% ▼
Major Index ETFs: SPY, QQQ, DIA, IWM, IJH
- QQQ 708.97 Bullish 1.85% ▲
- IWM 296.54 Bullish 1.45% ▲
- IJH 75.72 Bullish 1.05% ▲
- SPY 748.28 Bullish 0.83% ▲
- DIA 521.51 Bullish 0.69% ▲
Major Index ETFs are Bullish across the board, led by QQQ at +1.85%, with IWM +1.45% and IJH +1.05% also showing broad strength. SPY gained +0.83%, while DIA at +0.69% is the least positive mover.
Mag 7 Stocks: AAPL, MSFT, GOOG, AMZN, META, NVDA, TSLA
- TSLA 378.93 Bullish 2.53% ▲
- NVDA 207.29 Bullish 1.97% ▲
- AAPL 327.74 Bullish 0.35% ▲
- META 643.81 Bearish -0.32% ▼
- AMZN 247.55 Bearish -0.98% ▼
- MSFT 397.75 Bearish -1.13% ▼
- GOOG 346.19 Bearish -1.47% ▼
Mag7 is Mixed: TSLA is the most bullish mover at +2.53%, followed by NVDA at +1.97%; AAPL is modestly Bullish at +0.35%. GOOG is the most bearish mover at -1.47%, with MSFT at -1.13% and AMZN at -0.98%; META is marginally Bearish at -0.32%.
Cross-Market ETFs: TLT, GLD, USO, IBIT
- USO 128.85 Bullish 2.66% ▲
- IBIT 37.67 Bullish 2.11% ▲
- GLD 374.81 Bullish 1.96% ▲
- TLT 83.66 Bearish -0.27% ▼
Other ETFs are Mixed: USO is the most bullish mover at +2.66%, followed by IBIT at +2.11% and GLD at +1.96%. TLT is the most bearish mover at -0.27%.
ETF, Mag7, and Cross-Market ETF Insights
Overall Tone
Mixed: major equity ETFs were Bullish, while Mag7 performance was selective and cross-market strength favored USO, IBIT, and GLD as TLT was Bearish.
Equity ETFs and Mag7:
Major equity ETFs were broadly Bullish, led by QQQ at +1.85%, followed by IWM at +1.45%, IJH at +1.05%, SPY at +0.83%, and DIA at +0.69%. Mag7 action was Mixed: TSLA was the most bullish mover at +2.53%, with NVDA up +1.97%, while GOOG was the most bearish mover at -1.47%, followed by MSFT at -1.13% and AMZN at -0.98%. AAPL was modestly Bullish at +0.35% and META was Bearish at -0.32%, indicating selective large-cap leadership.
Cross-Market ETFs:
Cross-market action was Mixed, with USO the most bullish mover at +2.66%, while IBIT gained +2.11% and GLD rose +1.96%. TLT was the most bearish and only Bearish cross-market ETF at -0.27%, showing divergence from the Bullish moves in oil, bitcoin exposure, and gold.
Futures Indices – Higher Time Frame Analysis
Summary of the current state of US Indices Futures based on higher time-frame (HTF) technical analysis as of: 2026-07-22: 07:16 CT.
US Indices Futures
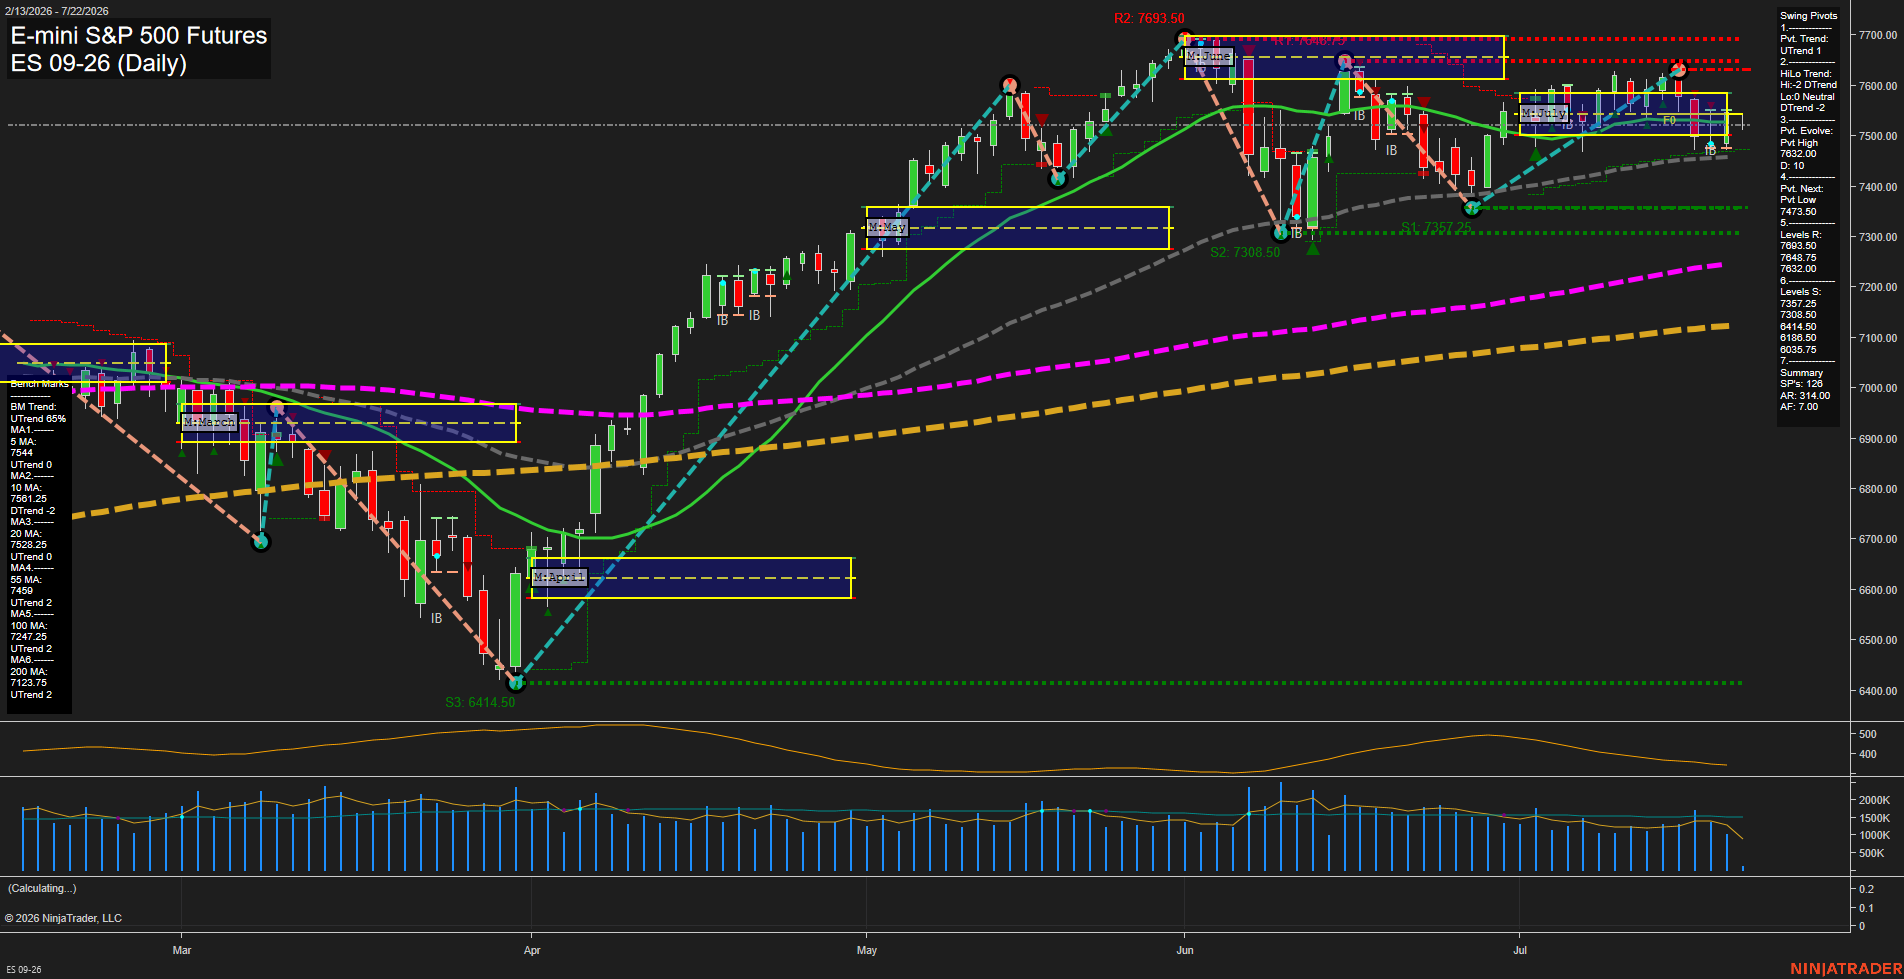
- ES: YSFG/WSFG above F0%, MSFG below F0%; benchmarks rising; pivots UTrend; support 7473.50/7219.50, resistance 7632.00-7693.50.
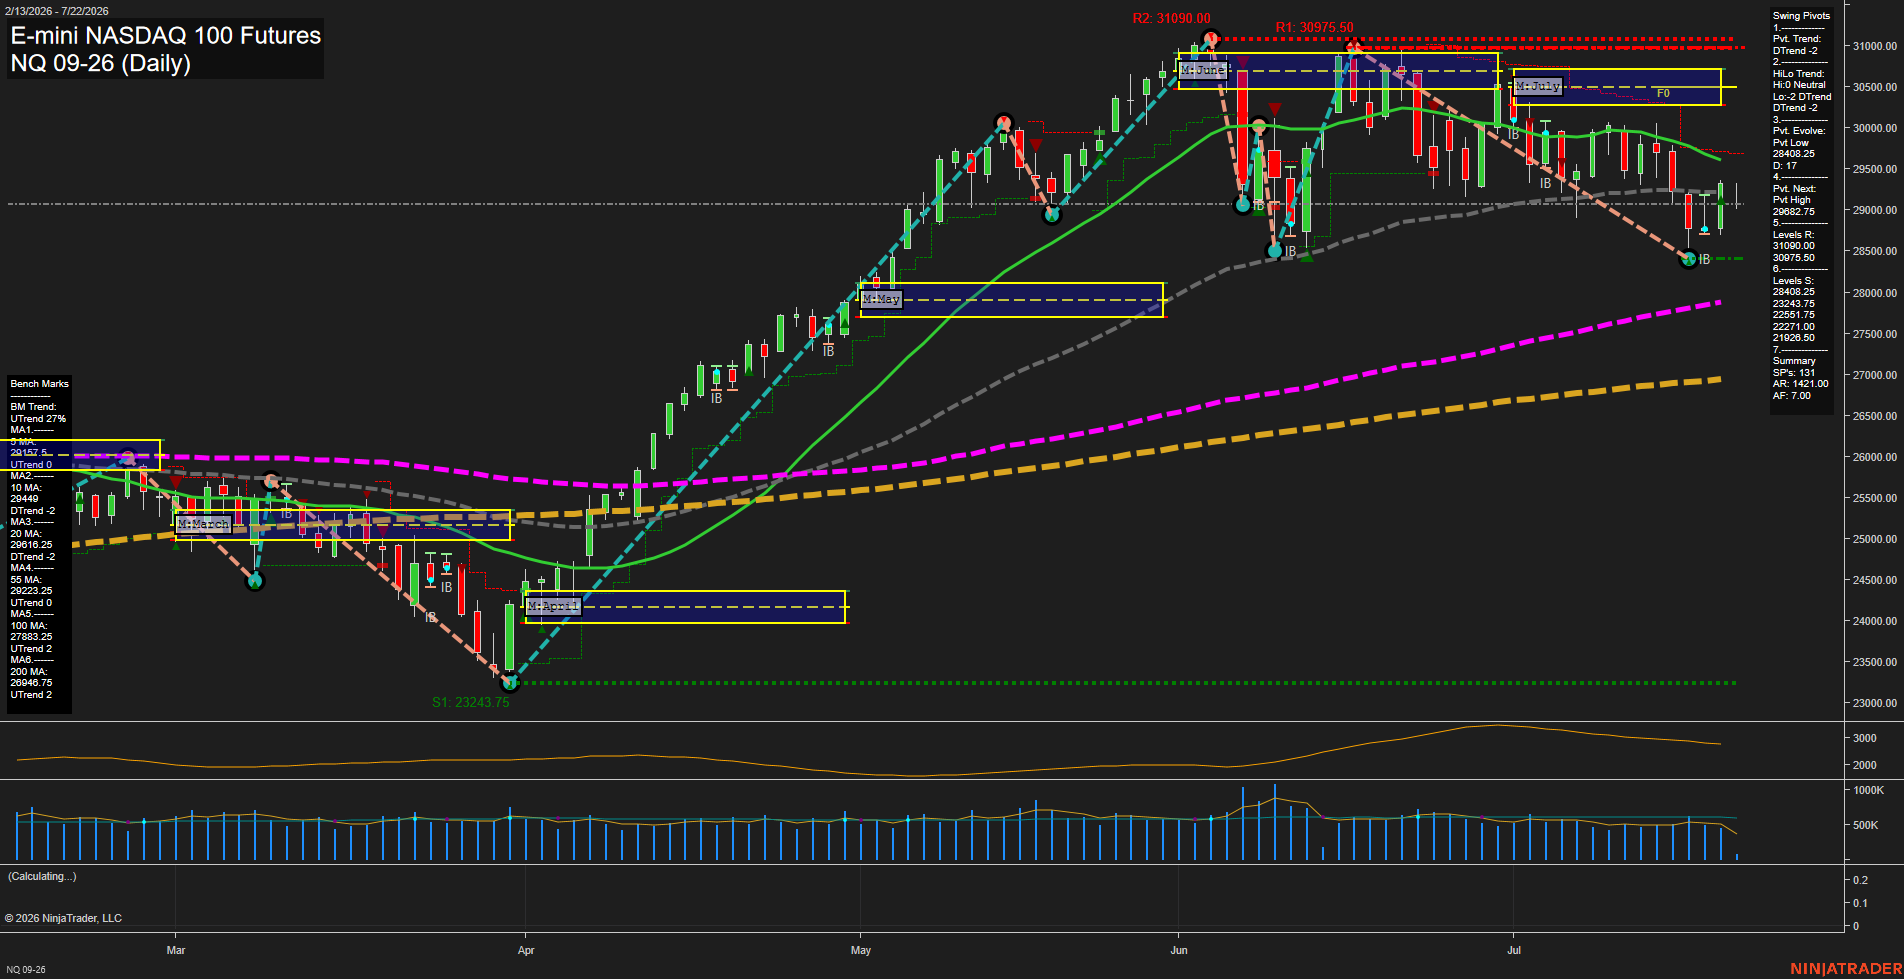
- NQ: YSFG/WSFG above F0%, MSFG below F0%; long benchmarks rising; pivot DTrend, HiLo UTrend; support 28408.25, resistance 29882.75/31090.00.
- YM: YSFG above F0%, MSFG below F0%; long benchmarks rising; consolidation below 53656; support 51999/51069, resistance 53111-53656.
- EMD: YSFG/WSFG above F0%, MSFG below F0%; higher pivots and long benchmarks rising; support 3724.0-3692.9, resistance 3836.8-3892.4.
- RTY: YSFG/WSFG above F0%, MSFG below F0%; rising long benchmarks; pivot support 2943.4/2835.8, resistance 3038.4-3068.4.
- FDAX: YSFG/MSFG/WSFG above F0%; long benchmarks rising; HiLo UTrend; support 24785/24282, resistance 25449/26064.
Overall State
- Short-Term: Neutral
- Intermediate-Term: Bullish
- Long-Term: Bullish
Conclusion
US index futures retain broadly aligned long-term bullish structures, supported by rising 55-, 100-, and 200-period benchmarks and generally firm YSFG readings. ES, NQ, EMD, RTY, and YM show MSFG countertrend conditions and consolidation beneath pivot highs, while FDAX retains alignment above all Fib-grid references. Daily pivot structures remain mixed across US contracts; key swing supports and overhead pivot-resistance levels frame current ranges.
Note: Intra-day counter-trend pullbacks or retracements may occur, HTF is context for informational usage and market structure. Glossary: Session Fib Grids periods of YSFG:’Yearly’, MSFG:’Monthly’, WSFG:’Weekly’
For full details visit: AlphaWebTrader Technicals
ES Daily View
Overall Rating
- Short-Term: Neutral
- Intermediate-Term: Neutral
- Long-Term: Bullish.
Key Insights Summary
Price remains within a July consolidation following the June recovery, with small daily bars and slowing momentum reflecting balance around the 20-day benchmark and the monthly F0% area. The weekly grid remains positive and the short-term pivot trend is upward, but the intermediate pivot structure and July MSFG remain down while price holds beneath the 5-day and 10-day averages. The broader structure remains constructive: price is above the rising 55-day, 100-day, and 200-day benchmarks, and the yearly grid remains positive. The 7473.50 pivot-low reversal level defines the nearby structural floor, while 7632.00 through 7693.50 is the overhead pivot-resistance cluster.
View charts on: AlphaWebTrader HTF Charts
NQ Daily View
Overall Rating
- Short-Term: Neutral
- Intermediate-Term: Neutral
- Long-Term: Bullish.
Key Insights Summary
NQ is consolidating after a sharp July retracement from the 31,000 area, with a rebound from the 28,408 pivot low restoring price above the 20-day benchmark and weekly F0% level. Short-term structure remains mixed because the active pivot trend is down and price remains beneath the declining 10-day benchmark and the 55-day benchmark. The monthly grid remains bearish below F0%, while the higher-timeframe trend remains constructive above rising 100-day and 200-day benchmarks. The 29,882.75 next-pivot level defines the nearby recovery threshold, while 28,408.25 remains the principal swing support beneath the current consolidation.
View charts on: AlphaWebTrader HTF Charts
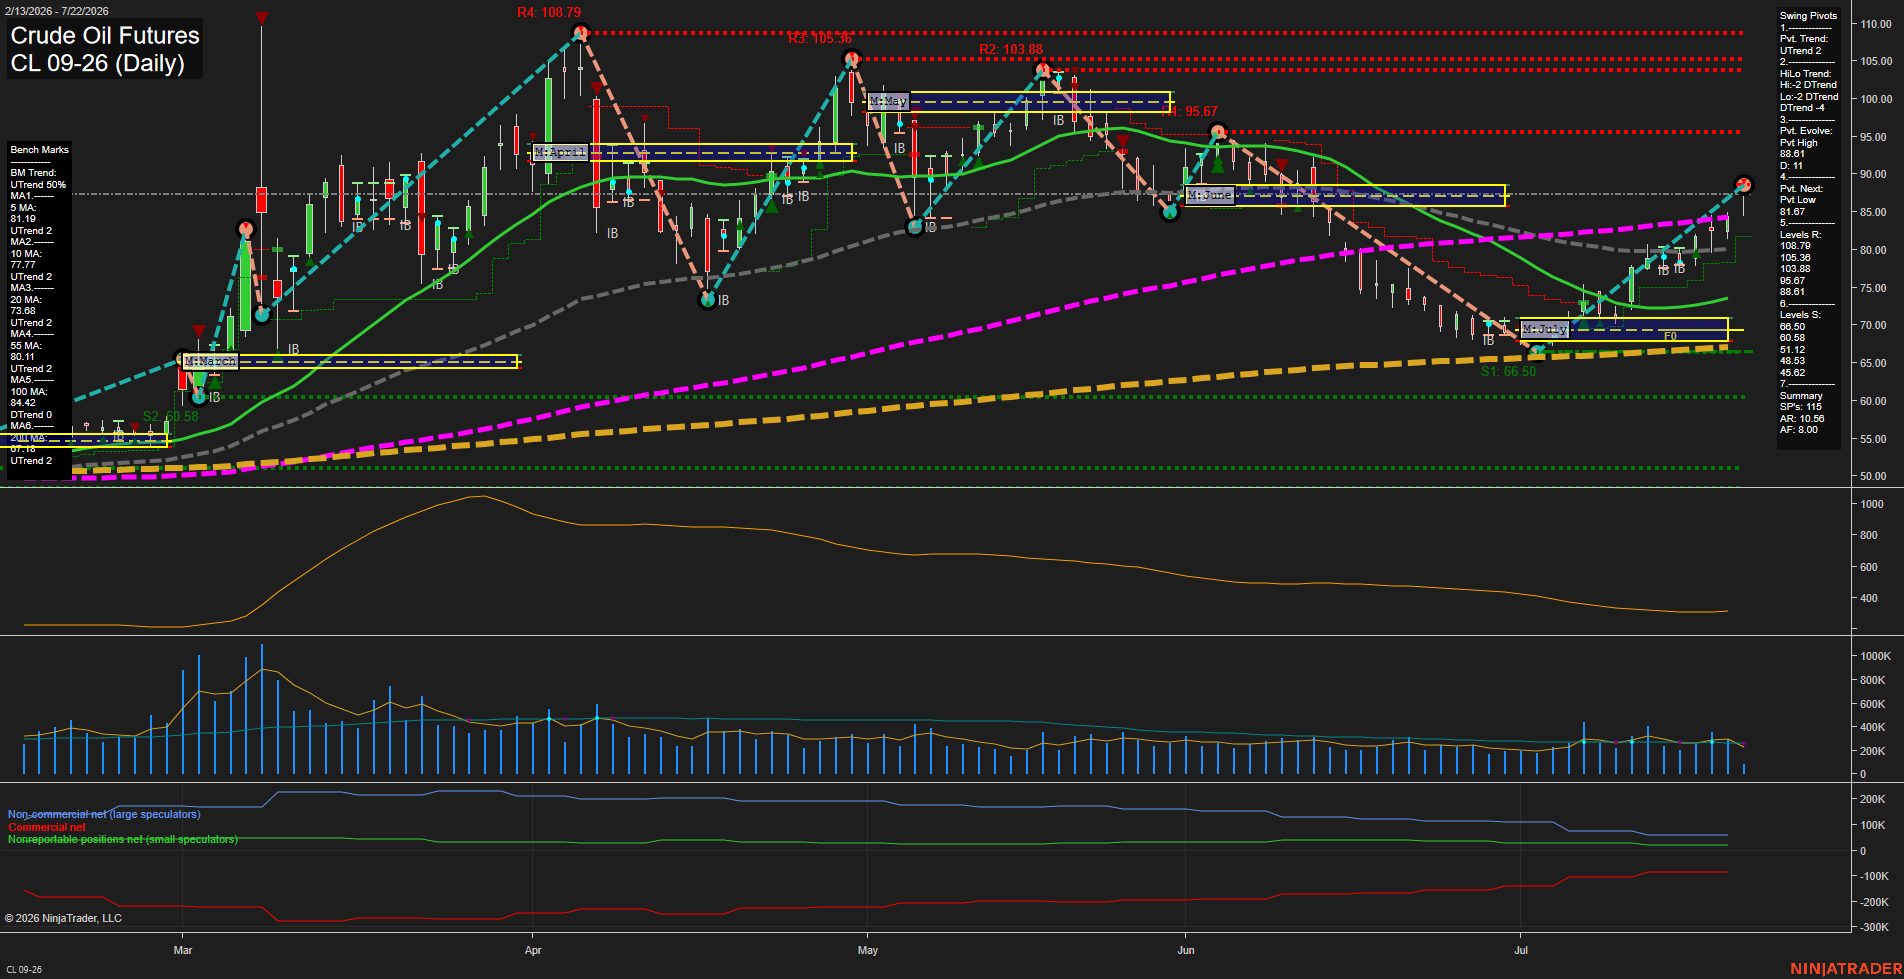
CL Daily View
Overall Rating
- Short-Term: Bullish
- Intermediate-Term: Bullish
- Long-Term: Bullish.
Key Insights Summary
Price is in a strong July recovery leg, holding above the weekly and monthly Fib-grid centers while reclaiming all major daily benchmarks. The short-term pivot structure is upward and momentum is fast, with 88.11 and 88.61 forming the immediate pivot-resistance area. The intermediate HiLo structure remains downtrend-defined despite the rebound, reflecting the prior decline from the May highs and leaving 95.67 as the next major overhead reference. Rising 5-, 10-, 20-, 55-, and 200-day benchmarks support the broader recovery, while the declining 100-day average shows the longer-cycle trend transition remains incomplete.
View charts on: AlphaWebTrader HTF Charts
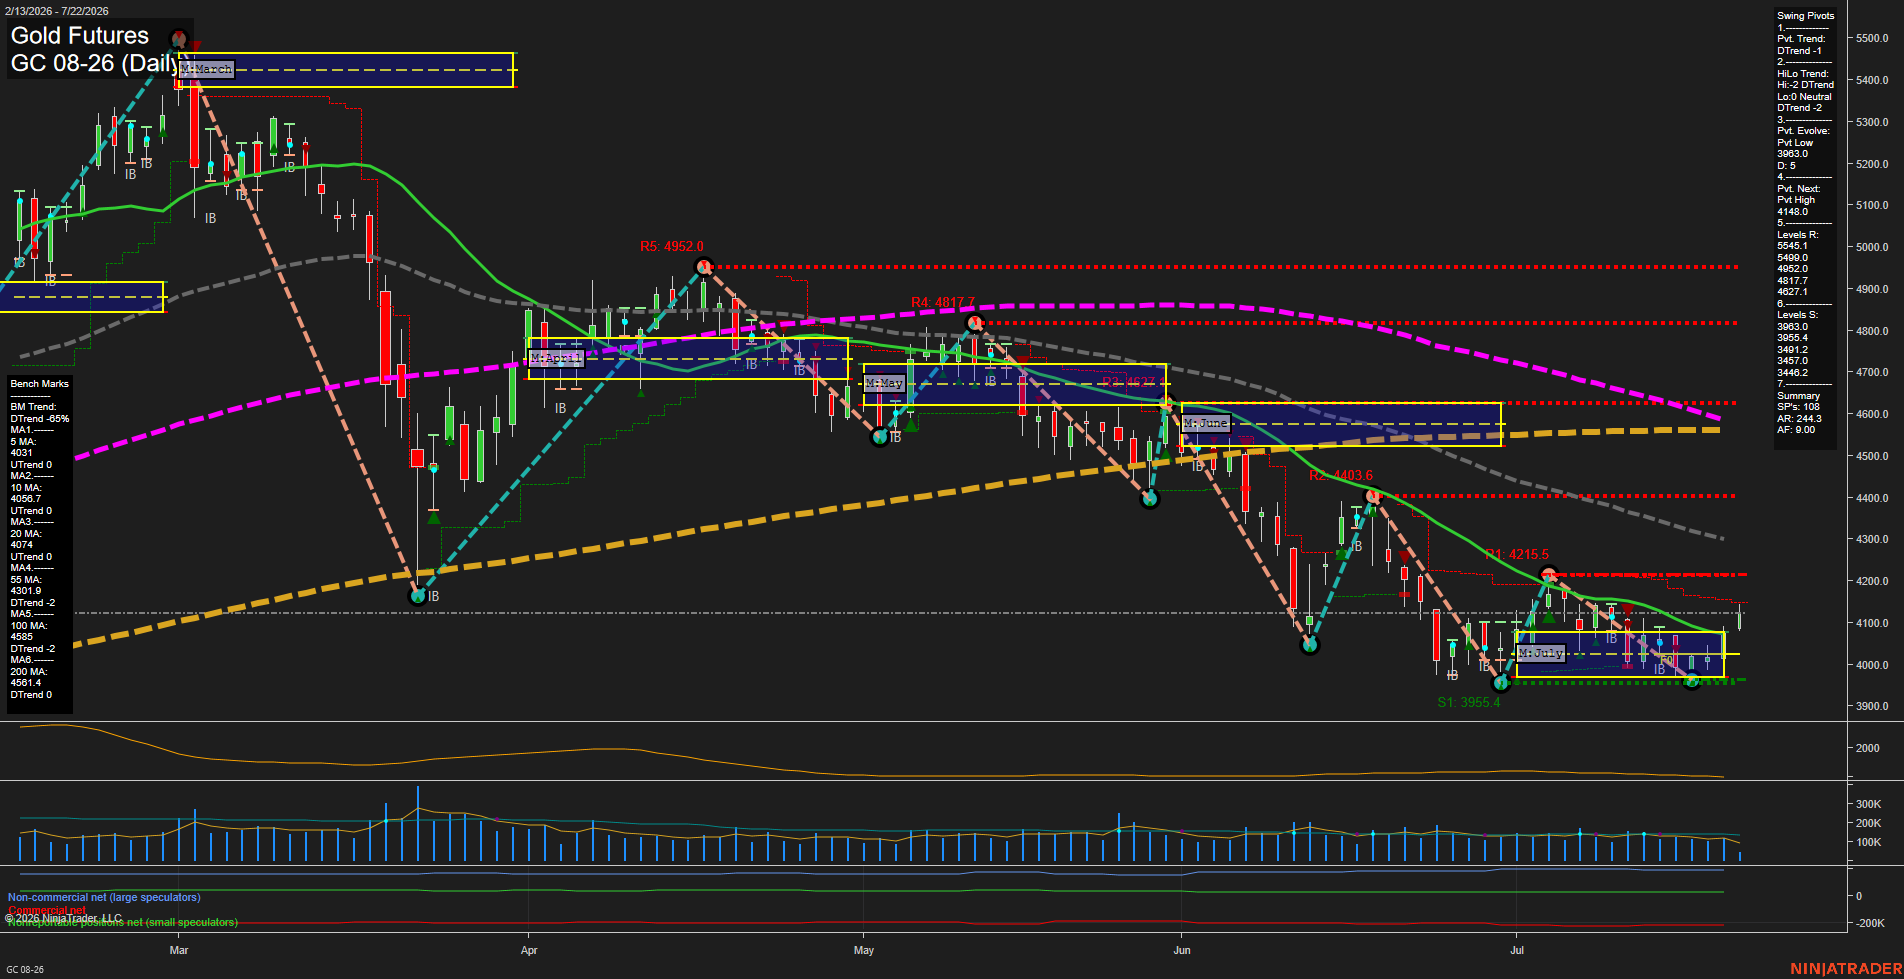
GC Daily View
Overall Rating
- Short-Term: Bullish
- Intermediate-Term: Neutral
- Long-Term: Bearish.
Key Insights Summary
Gold is rebounding from the 3963 pivot-low area, with price above the rising 5-, 10-, and 20-day benchmarks and above the weekly and monthly F0% grids. The immediate swing structure remains classified as a downtrend, however, because the broader sequence retains lower highs and price remains below the declining 55-, 100-, and 200-day averages. The 4148 pivot-high reversal level is the nearby short-term structural test, while 3963-3955 remains the principal support zone. Price action reflects a recovery bounce within a larger bearish long-term trend.
View charts on: AlphaWebTrader HTF Charts