
U.S. stocks fell as Middle East energy disruptions pushed oil toward $100, lifted Treasury yields and renewed concerns about inflation and Fed policy.
Fundamentals: U.S. equities closed lower as attacks on Saudi energy facilities and renewed U.S.-Iran tensions lifted crude prices and intensified inflation concerns. The Dow fell 617 points while the S&P 500 declined, with rising Treasury yields and expectations for tighter Fed policy adding pressure. Gold and silver weakened late as oil, yields and rate expectations climbed.
Technicals: Equity futures closed with mixed technical conditions as Nasdaq futures maintained bullish short-, intermediate- and long-term structures, while S&P 500 futures held a neutral near-term posture within a broader uptrend. Dow, Russell 2000 and DAX futures reflected corrective pressure. Tesla and USO led ETF gains, while Nvidia, IBIT and GLD declined.
After Market Close daily snapshot: market news summary and sentiment, major ETFs, Magnificent 7 analysis, Indices Futures Higher Time Frame Analysis, and E-mini S&P500, Nasdaq 100, NYMEX Crude, Gold Futures Daily Chart analysis.
As of: September 8, 2026 05:00 CT
Market News Summary:
U.S. equities sold off as Middle East energy disruption lifted crude prices, Treasury yields, and Fed-tightening concerns.
Primary Drivers & Risks:
- Primary Driver: Middle East oil shock
- Primary Risk: Inflation and higher-rate pressure
Tone:
Risk-off, with energy-led inflation concerns weighing on equities.
Stock Market / ETFs / Indices:
Major U.S. index futures opened lower following Canadian retaliatory tariffs, and stocks weakened further as oil approached $100. The Dow fell 617 points, or 1.16%, while the S&P 500 declined 0.58%; elevated oil and rate expectations pressured the broader market. Stocks have changed little since June, highlighting late-year consolidation and valuation sensitivity.
Geopolitical:
Attacks on Saudi Arabian energy facilities and renewed U.S.-Iran tensions drove the day’s risk repricing. The escalation pushed crude higher and intensified concern over energy supply and refining capacity.
Oil / Energy:
Brent crude briefly traded above $99 and WTI technical commentary identified a $98–$101 zone. Saudi facility attacks, refinery bottlenecks, record Labor Day gasoline prices, and the Strategic Petroleum Reserve falling to 285.4 million barrels added to supply concerns, although other commentary noted recovered energy flows and adapted supply chains.
Gold / Metals:
Gold and silver fell in late trading as stronger crude, higher Treasury yields, and firmer Fed-hike expectations outweighed safe-haven demand. Longer-term commentary remained constructive, citing broad ETF, futures, and options exposure and technical resistance near $4,511.
Fed / Financials:
Rising oil prices strengthened concerns about inflation ahead of the next Fed decision, while Treasury yields reached multiyear highs. Reports also highlighted division within the FOMC after three officials dissented from holding rates steady at the July meeting.
Macro / Other:
Earlier commentary framed a 10-year Treasury yield near 4.75% against 6.6% nominal U.S. growth, modest job gains, and contained inflation expectations. AI remained a cross-current: strong infrastructure demand and company gains contrasted with concerns over concentrated valuations, debt, and bubble risk.
Conclusion:
Oil’s advance toward $100 and the associated rise in yields and Fed-tightening concerns drove the equity decline. Middle East energy disruptions were the central session catalyst.
Tariff developments, refining constraints, and low strategic crude inventories added inflation and supply-pressure risks. Gold weakened intraday despite longer-term bullish positioning, while AI and earnings narratives provided offsetting equity-market support.
Market News Sentiment
Market News Articles: 37
- Neutral: 56.76%
- Positive: 21.62%
- Negative: 21.62%
Sentiment Summary: Of 37 market news articles, 57% were neutral, while positive and negative articles each represented 22%.
Conclusion: News sentiment for indices futures is balanced, with neutral coverage predominating.
GLD,Gold Articles: 7
- Positive: 71.43%
- Negative: 28.57%
Sentiment Summary: GLD/Gold coverage was 71% positive and 29% negative across 7 articles.
Conclusion: Gold-related news tone was predominantly positive, with a minority of negative coverage.
USO,Oil Articles: 17
- Positive: 47.06%
- Negative: 47.06%
- Neutral: 5.88%
Sentiment Summary: USO/Oil coverage is evenly split, with 47% positive, 47% negative, and 6% neutral articles across 17 items.
Conclusion: Oil-related news sentiment is balanced, offering no clear directional tone for indices futures traders.
Market Data Snapshot
ETF Snapshot of major stock market ETFs, Mag7, and others as of: September 8, 2026 05:00
Top Movers & Losers
- TSLA 368.16 Bullish 3.98% ▲
- USO 146.03 Bullish 2.87% ▲
- GOOG 335.38 Bullish 0.02% ▲
- GLD 399.72 Bearish -1.73% ▼
- IBIT 44.39 Bearish -1.86% ▼
- NVDA 225.73 Bearish -2.01% ▼
Major Index ETFs: SPY, QQQ, DIA, IWM, IJH
- QQQ 718.36 Bearish -0.08% ▼
- IWM 294.67 Bearish -0.45% ▼
- SPY 765.96 Bearish -0.55% ▼
- IJH 75.36 Bearish -0.65% ▼
- DIA 528.03 Bearish -1.13% ▼
Major Index ETFs were Bearish across the group. QQQ was the least negative mover at -0.08%, a marginal decline, while DIA led losses at -1.13%. SPY fell -0.55%, IJH declined -0.65%, and IWM was down -0.45%.
Mag 7 Stocks: AAPL, MSFT, GOOG, AMZN, META, NVDA, TSLA
- TSLA 368.16 Bullish 3.98% ▲
- GOOG 335.38 Bullish 0.02% ▲
- META 613.48 Bearish -0.53% ▼
- AMZN 256.97 Bearish -0.60% ▼
- MSFT 493.95 Bearish -1.15% ▼
- AAPL 316.22 Bearish -1.17% ▼
- NVDA 225.73 Bearish -2.01% ▼
Mixed Mag7 snapshot: TSLA is the most bullish mover at +3.98%, while GOOG is marginally Bullish at +0.02%. META -0.53%, AMZN -0.60%, MSFT -1.15%, and AAPL -1.17% are Bearish; NVDA is the most bearish mover at -2.01%.
Cross-Market ETFs: TLT, GLD, USO, IBIT
- USO 146.03 Bullish 2.87% ▲
- TLT 82.20 Bearish -0.01% ▼
- GLD 399.72 Bearish -1.73% ▼
- IBIT 44.39 Bearish -1.86% ▼
Other ETFs were Mixed: USO was the most bullish mover at +2.87%, while IBIT was the most bearish mover at -1.86%. GLD declined -1.73%, and TLT was marginally lower at -0.01%.
ETF, Mag7, and Cross-Market ETF Insights
Overall Tone
Bearish risk tone, with broad equity weakness, while TSLA and USO posted notable Bullish divergence.
Equity ETFs and Mag7:
Major Index ETFs were broadly Bearish: SPY -0.55%, QQQ -0.08%, IWM -0.45%, IJH -0.65%, and DIA -1.13%, with QQQ marginal and DIA the most bearish index ETF. Mag7 action was selective, led by TSLA as the most bullish mover at +3.98%, while GOOG was near-flat at +0.02%; NVDA was the most bearish Mag7 mover at -2.01%. AAPL -1.17%, MSFT -1.15%, AMZN -0.60%, and META -0.53% reinforced Bearish breadth outside the selective TSLA strength.
Cross-Market ETFs:
Cross-market action diverged from equities as USO was Bullish +2.87%, the group’s most bullish mover, while TLT was marginally Bearish at -0.01%. GLD -1.73% and IBIT -1.86% were Bearish, with IBIT the most bearish cross-market mover, indicating commodity strength was concentrated in USO rather than broadly aligned across alternative assets.
Futures Indices – Higher Time Frame Analysis
Summary of the current state of US Indices Futures based on higher time-frame (HTF) technical analysis as of: 2026-09-08: 17:00 CT.
US Indices Futures
- ES: YSFG/MSFG firm, WSFG short below F0%; UTrend intermediate pivots; 7838.50 resistance, 7476.50 reversal threshold; rising 10–200 benchmarks.
- NQ: YSFG/MSFG/WSFG above F0%; higher low at 27201.50; 30343–31090 resistance, 28987.75 support; rising benchmark alignment.
- YM: YSFG above F0%, MSFG/WSFG below; 54884 resistance, 52540 pivot threshold; short-term benchmarks declining, 20–200 weekly benchmarks rising.
- EMD: YSFG/MSFG/WSFG above F0%; short-term DTrend from 3941.7; 3713.8 support, 3797.4 pivot ceiling; 55–200 benchmarks rising.
- RTY: YSFG/MSFG above F0%, WSFG below; 3079.9 resistance, 2904.5 reversal threshold; intermediate UTrend, declining 5–10 benchmarks.
- FDAX: YSFG above F0%, MSFG/WSFG below; 26665 resistance, 25221 opposite pivot; short signals, rising 20–200 weekly benchmarks.
Overall State
- Short-Term: Neutral
- Intermediate-Term: Bullish
- Long-Term: Bullish
Conclusion
NQ retains aligned bullish YSFG, MSFG, WSFG and benchmark structure. ES, EMD, RTY, YM, and FDAX retain long-term upward benchmark and pivot context while weekly or monthly grid weakness reflects corrective phases. ES and EMD are rebounding from pivot supports; YM and FDAX remain below grid centers. Key overhead pivots are ES 7838.50, NQ 30343–31090, YM 54884, EMD 3941.7, RTY 3079.9, and FDAX 26665.
Note: Intra-day counter-trend pullbacks or retracements may occur, HTF is context for informational usage and market structure. Glossary: Session Fib Grids periods of YSFG:’Yearly’, MSFG:’Monthly’, WSFG:’Weekly’
For full details visit: AlphaWebTrader Technicals
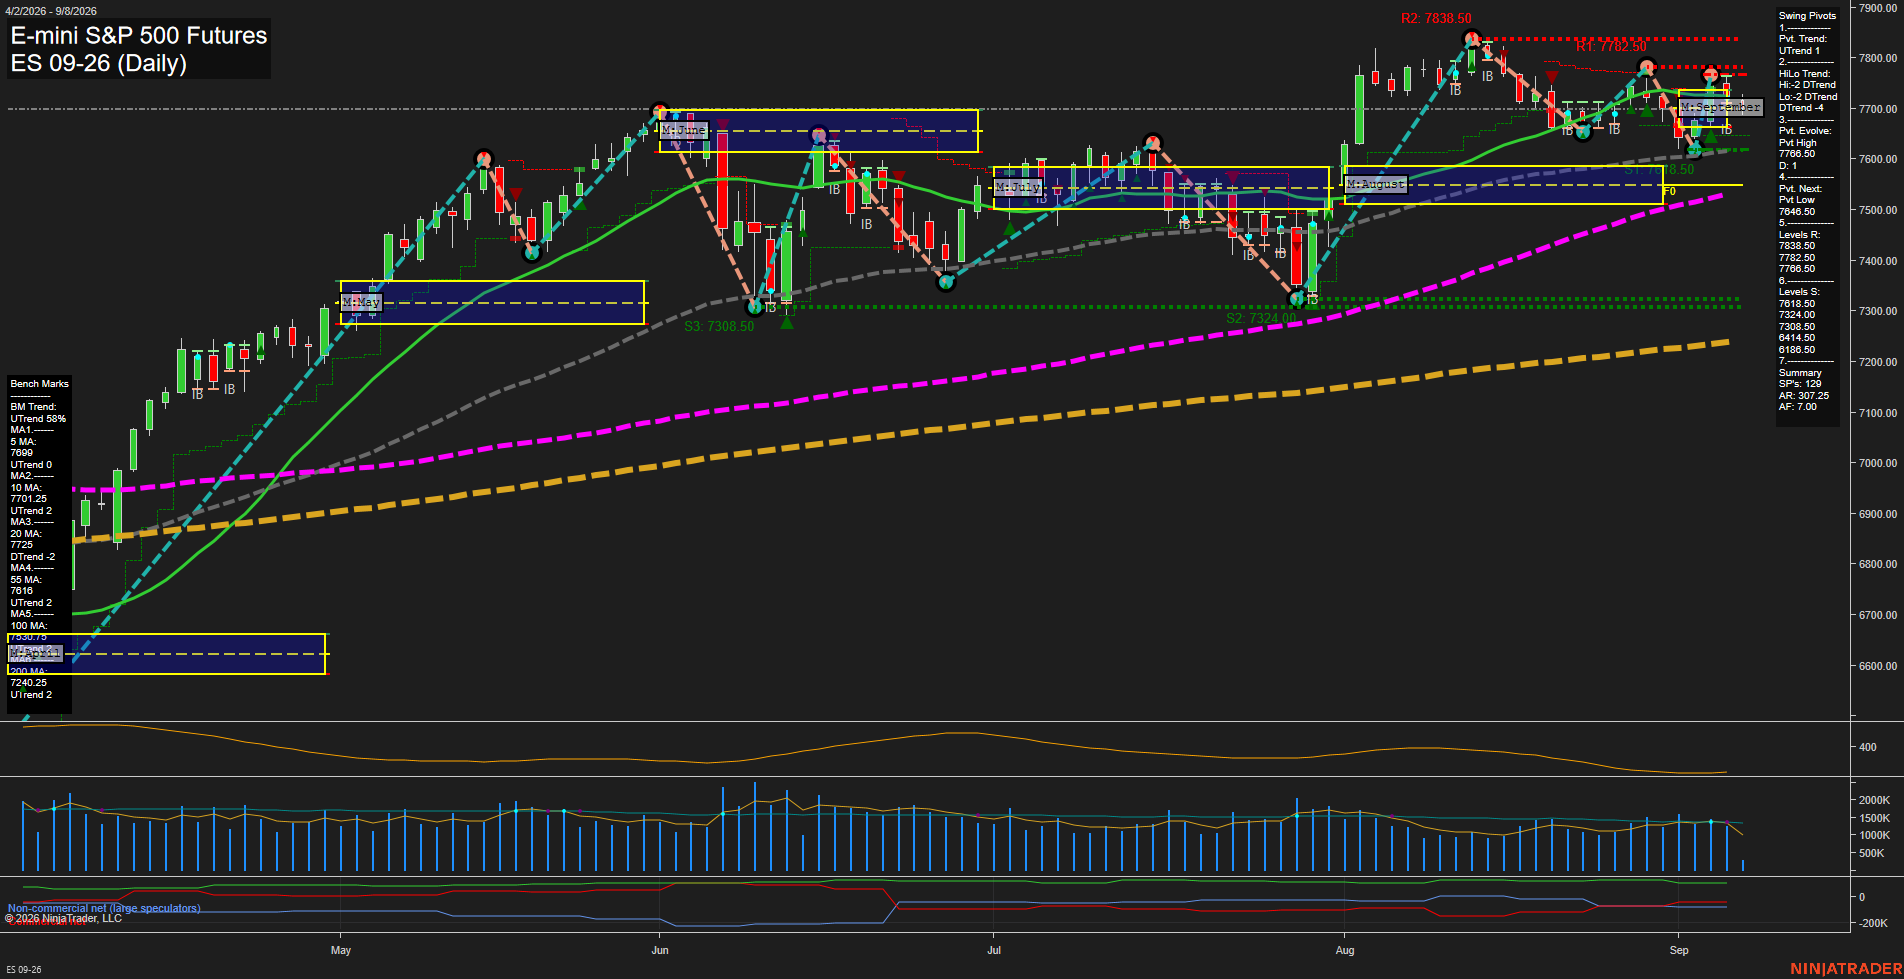
ES Daily View
Overall Rating
- Short-Term: Neutral
- Intermediate-Term: Neutral
- Long-Term: Bullish.
Key Insights Summary
Price has staged a sharp V-shaped rebound from the 7640.50 pivot-low area and is now testing the 7760.50 to 7782.50 resistance band. The short-term pivot structure is positive, but the weekly fib-grid remains below its F0% reference and the intermediate HiLo structure remains in a downtrend, defining a countertrend recovery within a mixed swing environment. The 20-day average remains declining near price, while the rising 55-, 100-, and 200-day benchmarks preserve the broader bullish trend structure. Resistance is concentrated at 7760.50, 7782.50, and 7838.50; support is layered at 7618.50, 7480.50, and 7308.50. ATR remains elevated, reflecting continued wide daily rotation and active September volatility.
View charts on: AlphaWebTrader HTF Charts
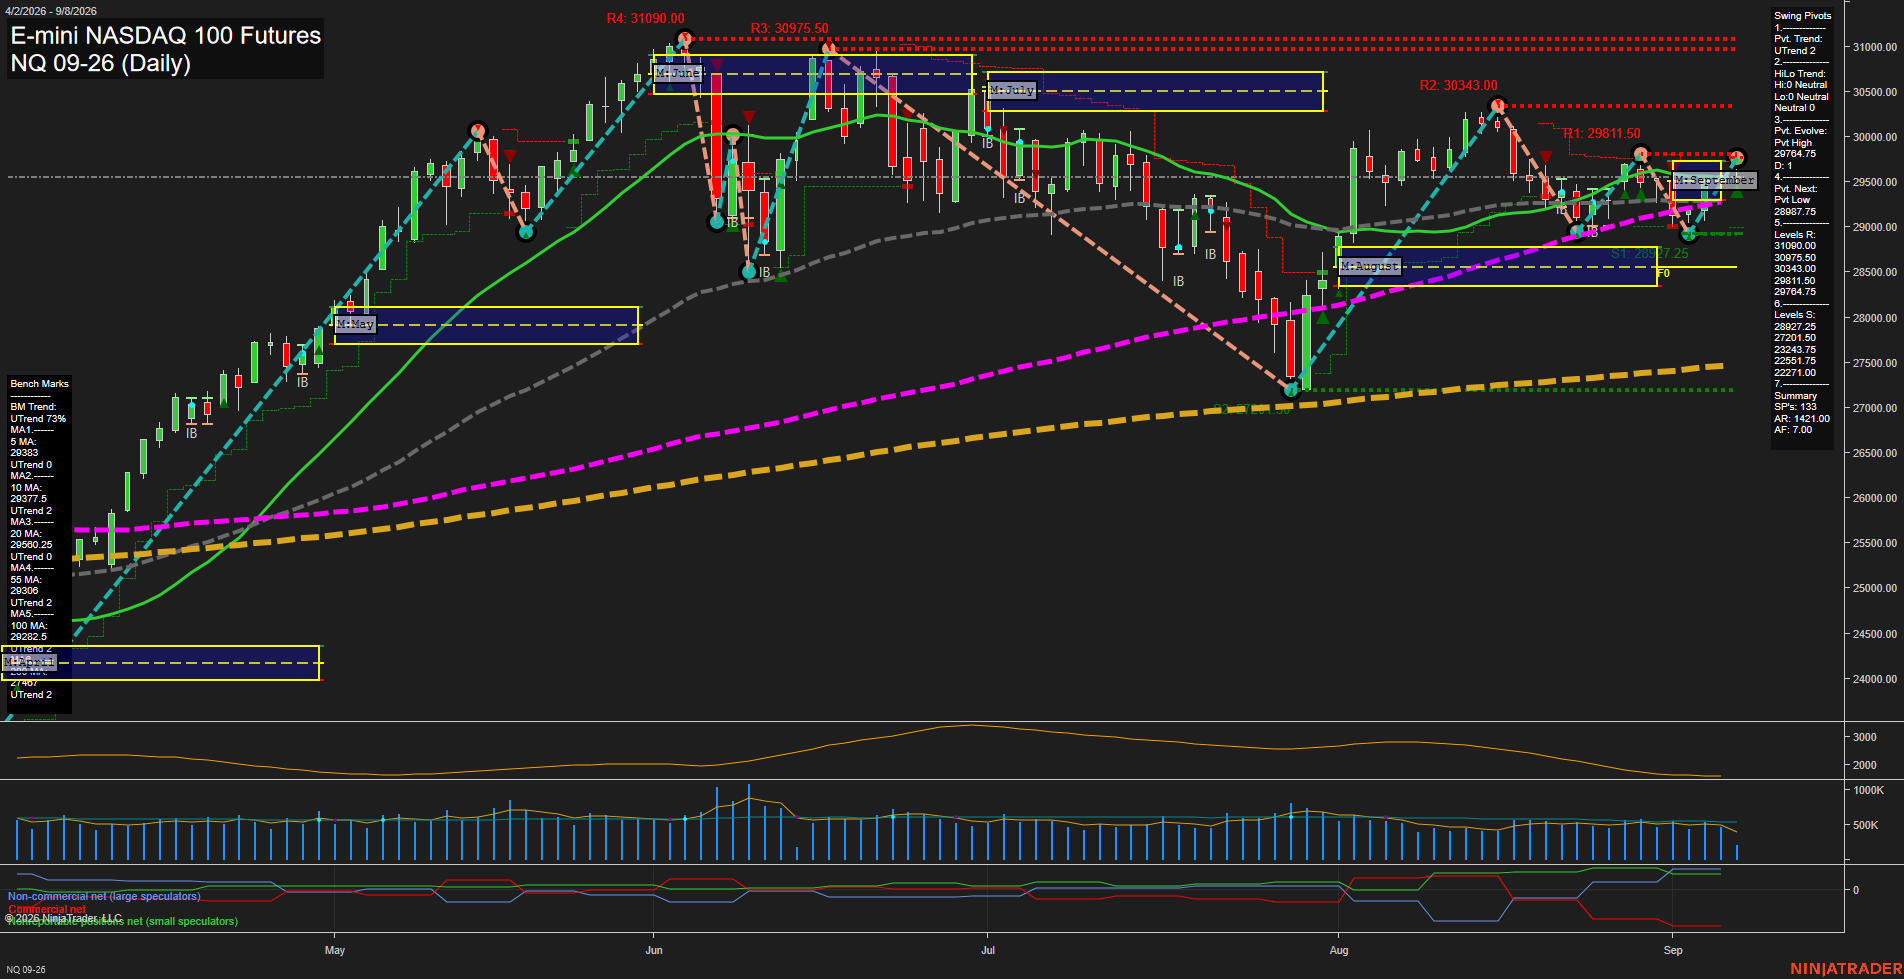
NQ Daily View
Overall Rating
- Short-Term: Bullish
- Intermediate-Term: Bullish
- Long-Term: Bullish.
Key Insights Summary
NQ remains in a broadly constructive swing structure, holding above the rising 5, 10, 55, 100, and 200-day benchmarks while the weekly, monthly, and yearly Fib-grid biases remain positive. Short-term price action is consolidating around the 20-day benchmark following a rebound from the late-August pivot low, with 29752.75 acting as the active pivot-high reference. The 29811.50 to 30343.00 resistance zone defines the next overhead supply area, while 28987.75 and 28927.25 mark the nearest structural support. ATR remains elevated, reflecting wide daily rotation and a choppy recovery phase rather than a smooth directional advance.
View charts on: AlphaWebTrader HTF Charts
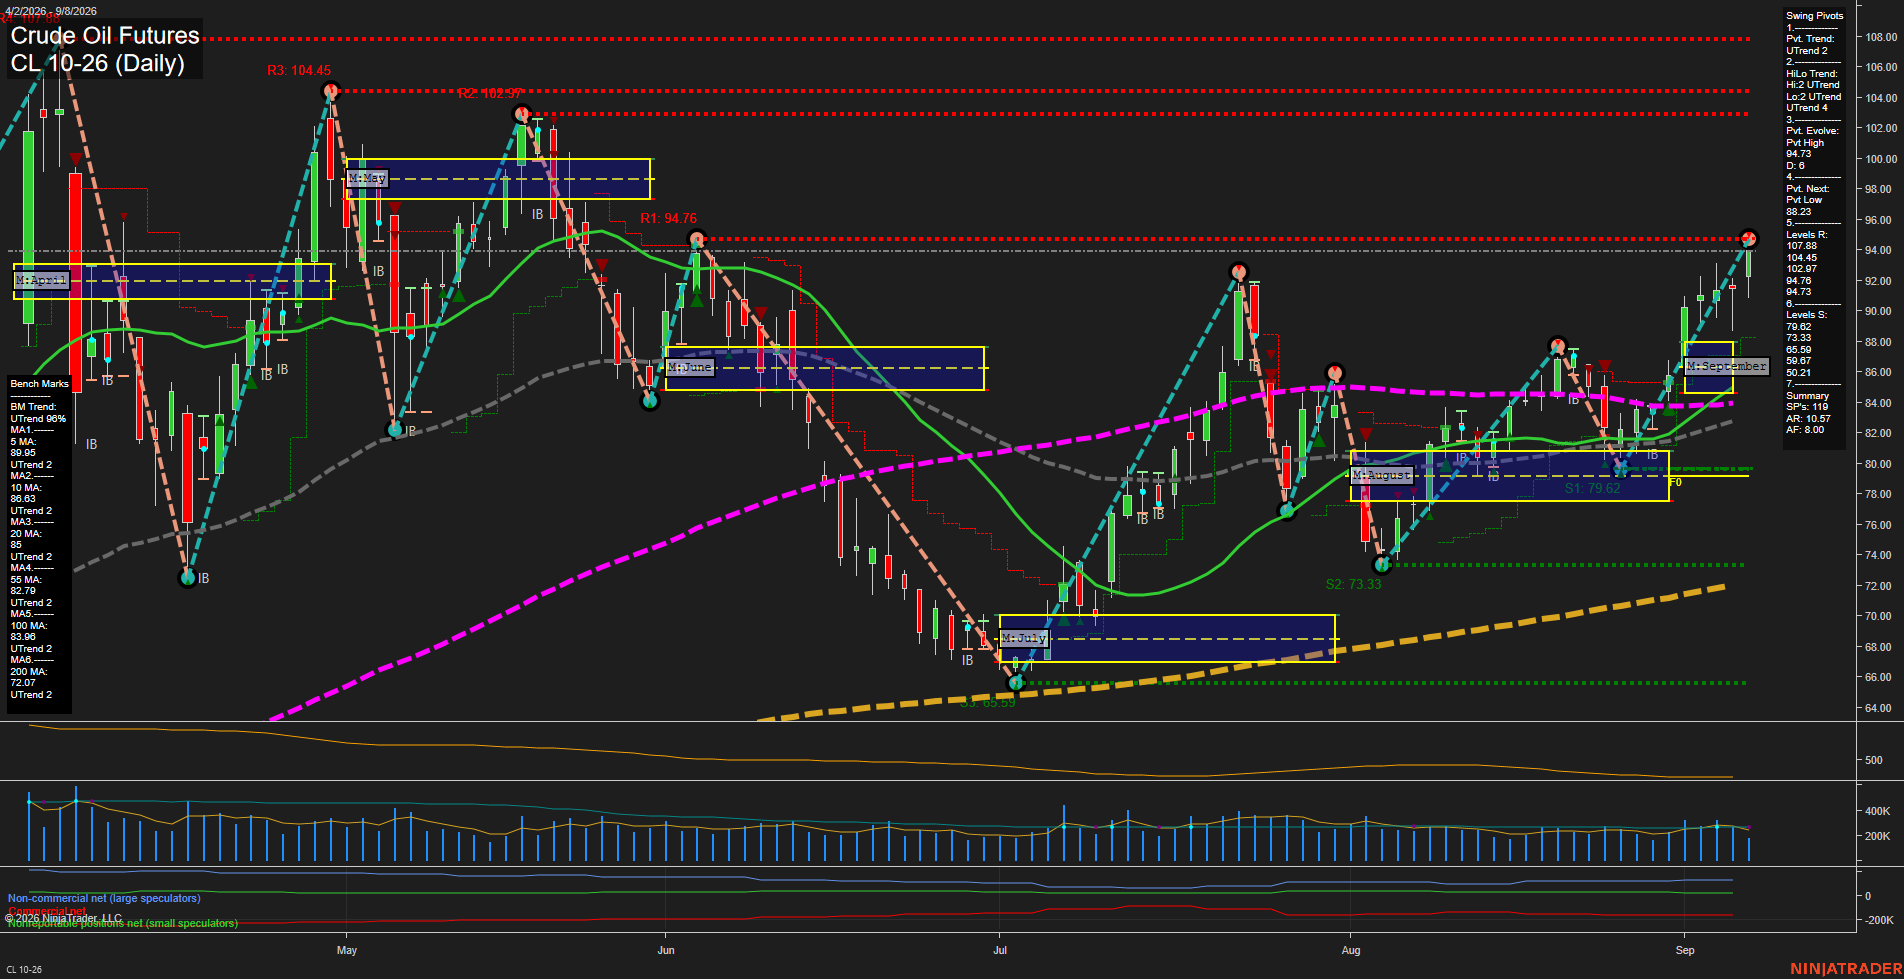
CL Daily View
Overall Rating
- Short-Term: Bullish
- Intermediate-Term: Bullish
- Long-Term: Bullish.
Key Insights Summary
Price is advancing in a fast upside swing, holding above every benchmark moving average and maintaining aligned upward short-, intermediate-, and long-term trend structure. The recovery from the August pivot low produced higher lows and a breakout through the September grid area, bringing price into the 94.73 to 94.76 pivot-resistance zone. The active pivot remains a high, while 88.23 defines the opposite-pivot reversal level; broader support is layered at 79.62, 73.33, and 65.59. The next higher resistance sequence is 102.97, 104.45, and 107.88, reflecting substantial overhead room if the current expansion continues.
View charts on: AlphaWebTrader HTF Charts
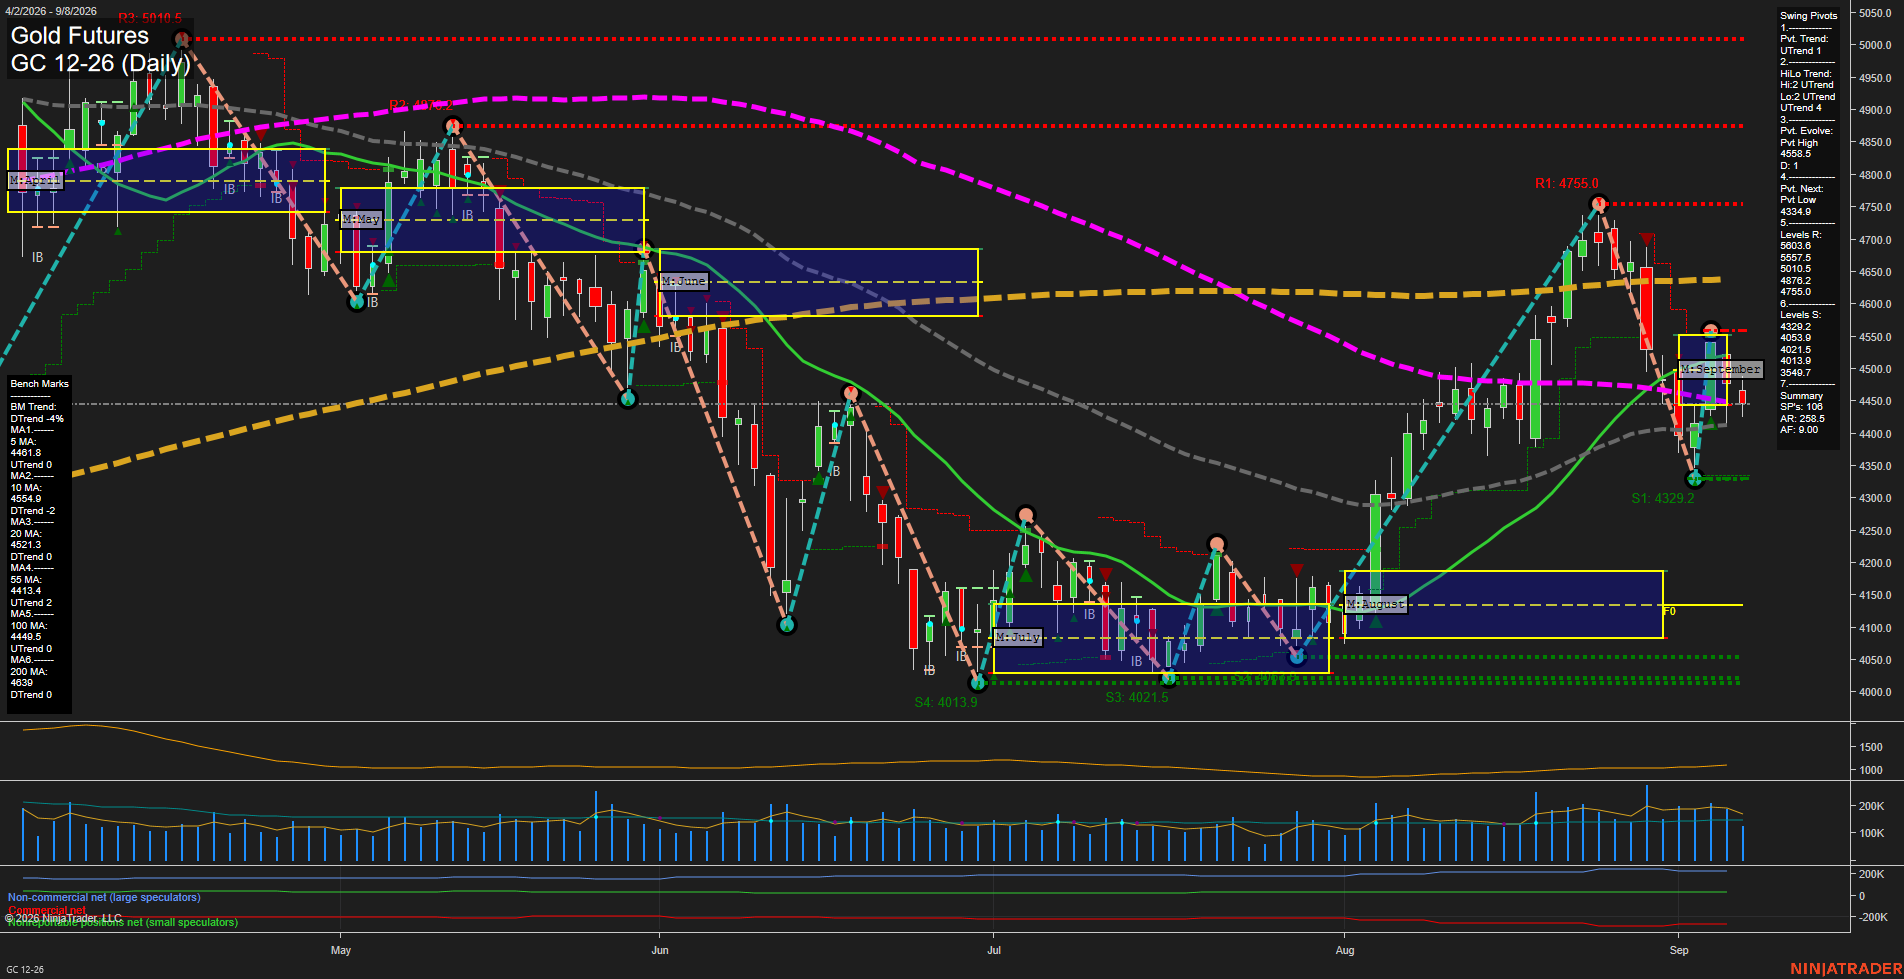
GC Daily View
Overall Rating
- Short-Term: Neutral
- Intermediate-Term: Neutral
- Long-Term: Bearish.
Key Insights Summary
GC is consolidating near 4451 following a sharp August rally, a rejection from the 4755 swing-high resistance area, and a retracement into the 4329 pivot-low area. The active pivot structure remains UTrend, but price is below the 5-day, 10-day, and 20-day benchmark cluster, while the weekly and monthly fib-grid readings remain down. Small daily bars and slowing momentum indicate compression after the high-volatility decline and rebound. The 4413 55-day and 4449.5 100-day averages are immediate trend-reference levels, while 4512, 4521, and 4555 form nearby overhead resistance. The long-term structure remains mixed-to-bearish because price is below the declining 200-day benchmark near 4639 and the yearly fib-grid trend remains down.
View charts on: AlphaWebTrader HTF Charts