U.S. stocks and bonds rallied as Fed Governor Waller eased rate concerns, while oil, payrolls, inflation and geopolitical risks stayed in focus.
Fundamentals: U.S. equities and Treasuries advanced after Federal Reserve Governor Christopher Waller signaled openness to holding rates steady if inflation data aligned, lowering yields and supporting gold and silver. Investors remained focused on upcoming payrolls and inflation releases, alongside elevated oil prices, services-price pressures, high mortgage rates, AI spending concerns and geopolitical risks.
Technicals: IBIT, Tesla and Meta were the leading ETF gainers, while USO, IWM and TLT posted modest advances. Across ES, NQ, YM, EMD, RTY and FDAX futures, daily and weekly readings showed broad short-term to intermediate corrective pressure below key near-term averages and pivot levels. Longer-term structures remained constructive, supported by rising major benchmarks and positive yearly trend measures.
After Market Close daily snapshot: market news summary and sentiment, major ETFs, Magnificent 7 analysis, Indices Futures Higher Time Frame Analysis, and E-mini S&P500, Nasdaq 100, NYMEX Crude, Gold Futures Daily Chart analysis.
As of: September 3, 2026 05:00 CT
Market News Summary:
U.S. equities and bonds rallied after Federal Reserve Governor Christopher Waller signaled openness to holding rates steady, while payrolls, inflation, oil and geopolitical tensions remained key cross-currents.
Primary Drivers & Risks:
- Primary Driver: Waller comments ease rate fears
- Primary Risk: Payrolls, inflation and elevated oil
Tone:
Risk-on in equities, with significant macro sensitivity.
Stock Market / ETFs / Indices:
The Dow gained more than 600 points and broader U.S. stocks rose as Treasury yields fell following Waller’s comments. Major indexes continued higher despite concerns around services inflation, oil near $90, seasonal September weakness, and large AI investment commitments at major technology firms. Healthcare shares drew support from earnings and M&A activity, though concerns emerged over crowded positioning in some names.
Geopolitical:
Hormuz shipping risks and wider international unrest remained in focus. The Dutch central bank moved substantial gold holdings from New York, citing geopolitical conditions.
Oil / Energy:
Rising oil prices remained an inflation and equity-market concern, with WTI technical commentary describing a breakout toward $94 resistance. Oil near $90 featured alongside hot services prices as a constraint on rate-relief sentiment.
Gold / Metals:
Gold jumped 3% and moved above near-term resistance, supported by geopolitical concerns, central-bank accumulation, and lower rate-hike expectations. Central banks added 23 net tonnes in July, led by China and Poland, while silver also rallied after Fed comments reduced rate-hike pressure.
Fed / Financials:
Waller indicated support for holding rates steady at the September meeting if inflation data aligned, reducing perceived rate-hike odds and weighing on Treasury yields. Mortgage rates nonetheless rose to 6.71%, their highest level in more than a year, while Revolut received conditional approval for a U.S. national bank charter.
Macro / Other:
August nonfarm payrolls are projected at 53,000 after a net loss across the prior two months. Services PMI rose in August, keeping inflation data and labor-market conditions central to the near-term macro narrative.
Conclusion:
Fed communication drove the session’s equity and bond rally by easing rate-hike fears and lowering yields. Gold and silver also benefited from the shift in rate expectations.
Payrolls and upcoming inflation data remain central market catalysts. Elevated oil, services-price pressures, geopolitical tensions, high mortgage rates, and AI spending concerns create offsetting risks.
Market News Sentiment
Market News Articles: 34
- Neutral: 55.88%
- Positive: 26.47%
- Negative: 17.65%
Sentiment Summary: Among 34 market news articles, sentiment was 56% neutral, 26% positive, and 18% negative.
Conclusion: News tone was predominantly neutral, with positive coverage exceeding negative coverage.
GLD,Gold Articles: 21
- Positive: 42.86%
- Neutral: 38.10%
- Negative: 19.05%
Sentiment Summary: GLD/Gold coverage is moderately positive, with 43% positive, 38% neutral, and 19% negative articles across 21 items.
Conclusion: Gold-related sentiment is positive overall, while a substantial neutral share indicates mixed near-term market framing.
USO,Oil Articles: 5
- Negative: 40.00%
- Positive: 40.00%
- Neutral: 20.00%
Sentiment Summary: USO/Oil article sentiment is balanced, with 40% positive, 40% negative, and 20% neutral coverage.
Conclusion: Oil-related news presents mixed directional tone for indices futures traders, without a clear sentiment bias.
Market Data Snapshot
ETF Snapshot of major stock market ETFs, Mag7, and others as of: September 3, 2026 05:00
Top Movers & Losers
- IBIT 46.35 Bullish 5.85% ▲
- TSLA 376.37 Bullish 5.42% ▲
- META 610.68 Bullish 3.01% ▲
- USO 142.09 Bullish 0.67% ▲
- IWM 295.19 Bullish 0.40% ▲
- TLT 82.07 Bullish 0.15% ▲
Major Index ETFs: SPY, QQQ, DIA, IWM, IJH
- DIA 536.93 Bullish 1.19% ▲
- QQQ 717.67 Bullish 1.19% ▲
- SPY 773.17 Bullish 1.05% ▲
- IJH 75.75 Bullish 0.85% ▲
- IWM 295.19 Bullish 0.40% ▲
Major index ETFs were Bullish across the group: DIA and QQQ were the most bullish movers at +1.19% each, followed by SPY at +1.05% and IJH at +0.85%. IWM was the least positive mover at +0.40%, while still Bullish.
Mag 7 Stocks: AAPL, MSFT, GOOG, AMZN, META, NVDA, TSLA
- TSLA 376.37 Bullish 5.42% ▲
- META 610.68 Bullish 3.01% ▲
- MSFT 510.12 Bullish 2.68% ▲
- NVDA 228.45 Bullish 1.80% ▲
- GOOG 339.08 Bullish 1.59% ▲
- AMZN 258.90 Bullish 1.54% ▲
- AAPL 328.21 Bullish 1.00% ▲
Mag7 is Bullish across the group. TSLA is the most bullish mover at +5.42%, followed by META at +3.01% and MSFT at +2.68%. NVDA, GOOG, and AMZN remain Bullish at +1.80%, +1.59%, and +1.54%. AAPL is the least positive mover at +1.00%.
Cross-Market ETFs: TLT, GLD, USO, IBIT
- IBIT 46.35 Bullish 5.85% ▲
- GLD 410.22 Bullish 1.85% ▲
- USO 142.09 Bullish 0.67% ▲
- TLT 82.07 Bullish 0.15% ▲
Other ETFs were Bullish across the group: IBIT led gains at +5.85%, followed by GLD at +1.85% and USO at +0.67%. TLT was the least positive mover at +0.15%.
ETF, Mag7, and Cross-Market ETF Insights
Overall Tone
Bullish risk tone, with all equity, Mag7, and cross-market ETFs positive, led by high-beta technology and IBIT.
Equity ETFs and Mag7:
Major equity ETFs were broadly Bullish: DIA and QQQ each gained +1.19%, SPY rose +1.05%, IJH added +0.85%, and IWM was the least positive at +0.40%. Mag7 leadership was selective and strong, led by TSLA at +5.42%, followed by META at +3.01% and MSFT at +2.68%; AAPL was the least positive Mag7 mover at +1.00%. The most bullish mover across equity ETFs and Mag7 was TSLA, while IWM was the least positive major equity ETF.
Cross-Market ETFs:
Cross-market ETFs were Bullish alongside equities, led decisively by IBIT at +5.85%, the most bullish mover in the full snapshot. GLD gained +1.85% and USO added +0.67%, while TLT was marginally positive at +0.15% and the least positive cross-market mover. Strength in IBIT, GLD, and USO contrasted with the near-flat TLT move.
Futures Indices – Higher Time Frame Analysis
Summary of the current state of US Indices Futures based on higher time-frame (HTF) technical analysis as of: 2026-09-03: 17:00 CT.
US Indices Futures
- ES: YSFG up, MSFG/WSFG below F0%, benchmarks mixed; resistance 7732.50-7838.50, support 7618.50 then 7324.00-7308.50; daily pivots DTrend.
- NQ: YSFG up, MSFG/WSFG below F0%; declining short benchmarks, rising 200-day; resistance 29292.75-29577.75, support 28927.25; weekly pivot high 30390.00.
- YM: YSFG up, MSFG/WSFG lower; short benchmarks declining, long benchmarks rising; resistance 53614-53862 and 54884, support 52720 then 51630.
- EMD: YSFG above F0%, MSFG/WSFG below centers; falling short benchmarks, rising long benchmarks; resistance 3796.4 then 3923.8-3941.7, support 3713.8.
- RTY: YSFG up, MSFG/WSFG lower; below short benchmarks, above rising 100/200-day; resistance 2982.3 then 3079.9, support 2914.5-2902.3.
- FDAX: YSFG up, MSFG/WSFG below F0%; declining short benchmarks, rising 55/100/200-day; resistance 26207 then 26665, support 25759-25790.
Overall State
- Short-Term: Bearish
- Intermediate-Term: Bearish
- Long-Term: Bullish
Conclusion
Daily structures are broadly bearish, with price below weekly and monthly Fib-grid references and short-term benchmarks across the index complex. ES, YM, EMD, RTY, and FDAX retain neutral-to-mixed weekly conditions, while NQ and FDAX weekly readings remain bearish. Yearly Fib Grids and rising longer-term benchmarks maintain bullish long-term structure across all instruments. Recent pivot highs define overhead resistance, while listed swing lows are active support references.
Note: Intra-day counter-trend pullbacks or retracements may occur, HTF is context for informational usage and market structure. Glossary: Session Fib Grids periods of YSFG:’Yearly’, MSFG:’Monthly’, WSFG:’Weekly’
For full details visit: AlphaWebTrader Technicals
ES Daily View
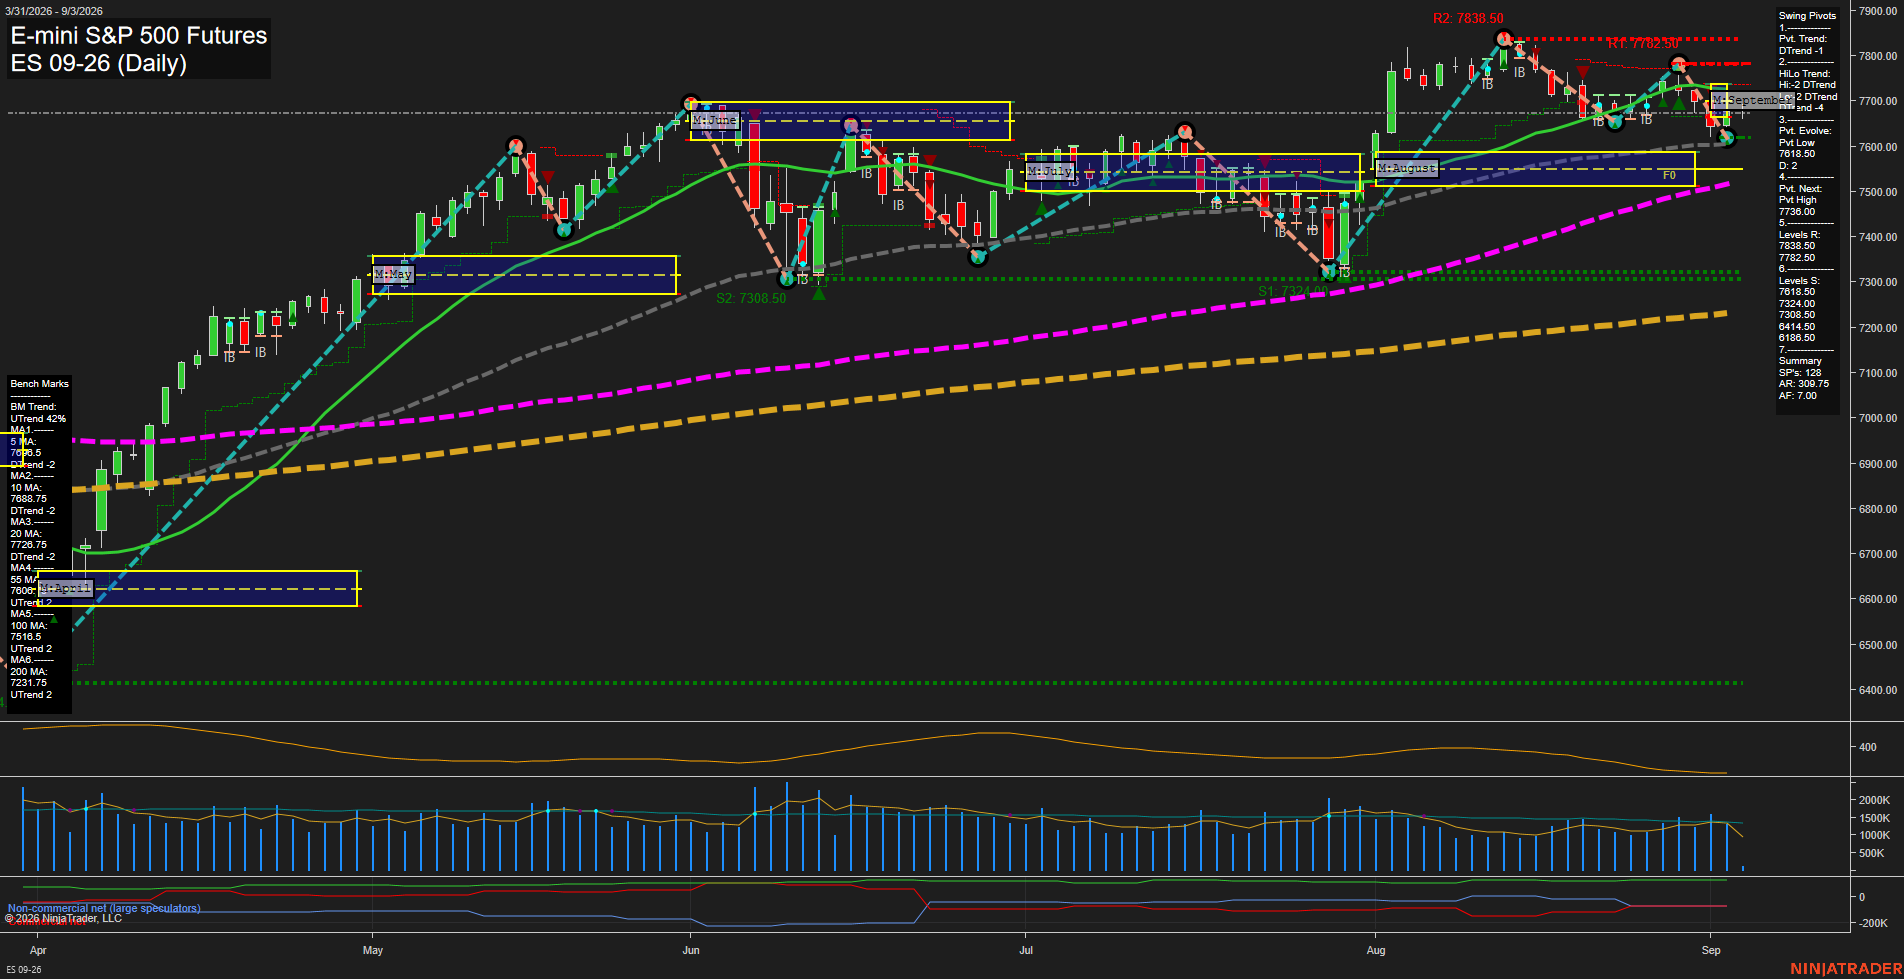
Overall Rating
- Short-Term: Bearish
- Intermediate-Term: Bearish
- Long-Term: Bullish.
Key Insights Summary
Price has shifted into a fast short-term decline, trading below the weekly and September monthly F0% areas and beneath the declining 5, 10, and 20-day benchmarks. Pivot structure is bearish on both the short-term and intermediate-term readings, with 7732.50 to 7838.50 defining overhead resistance. The 7618.50 pivot-low area is the immediate structural support, while 7324.00 and 7308.50 are the larger downside support cluster. The broader yearly structure remains constructive because price is still above rising 55, 100, and 200-day benchmarks, framing the current move as an intermediate pullback within a longer-term uptrend.
View charts on: AlphaWebTrader HTF Charts
NQ Daily View
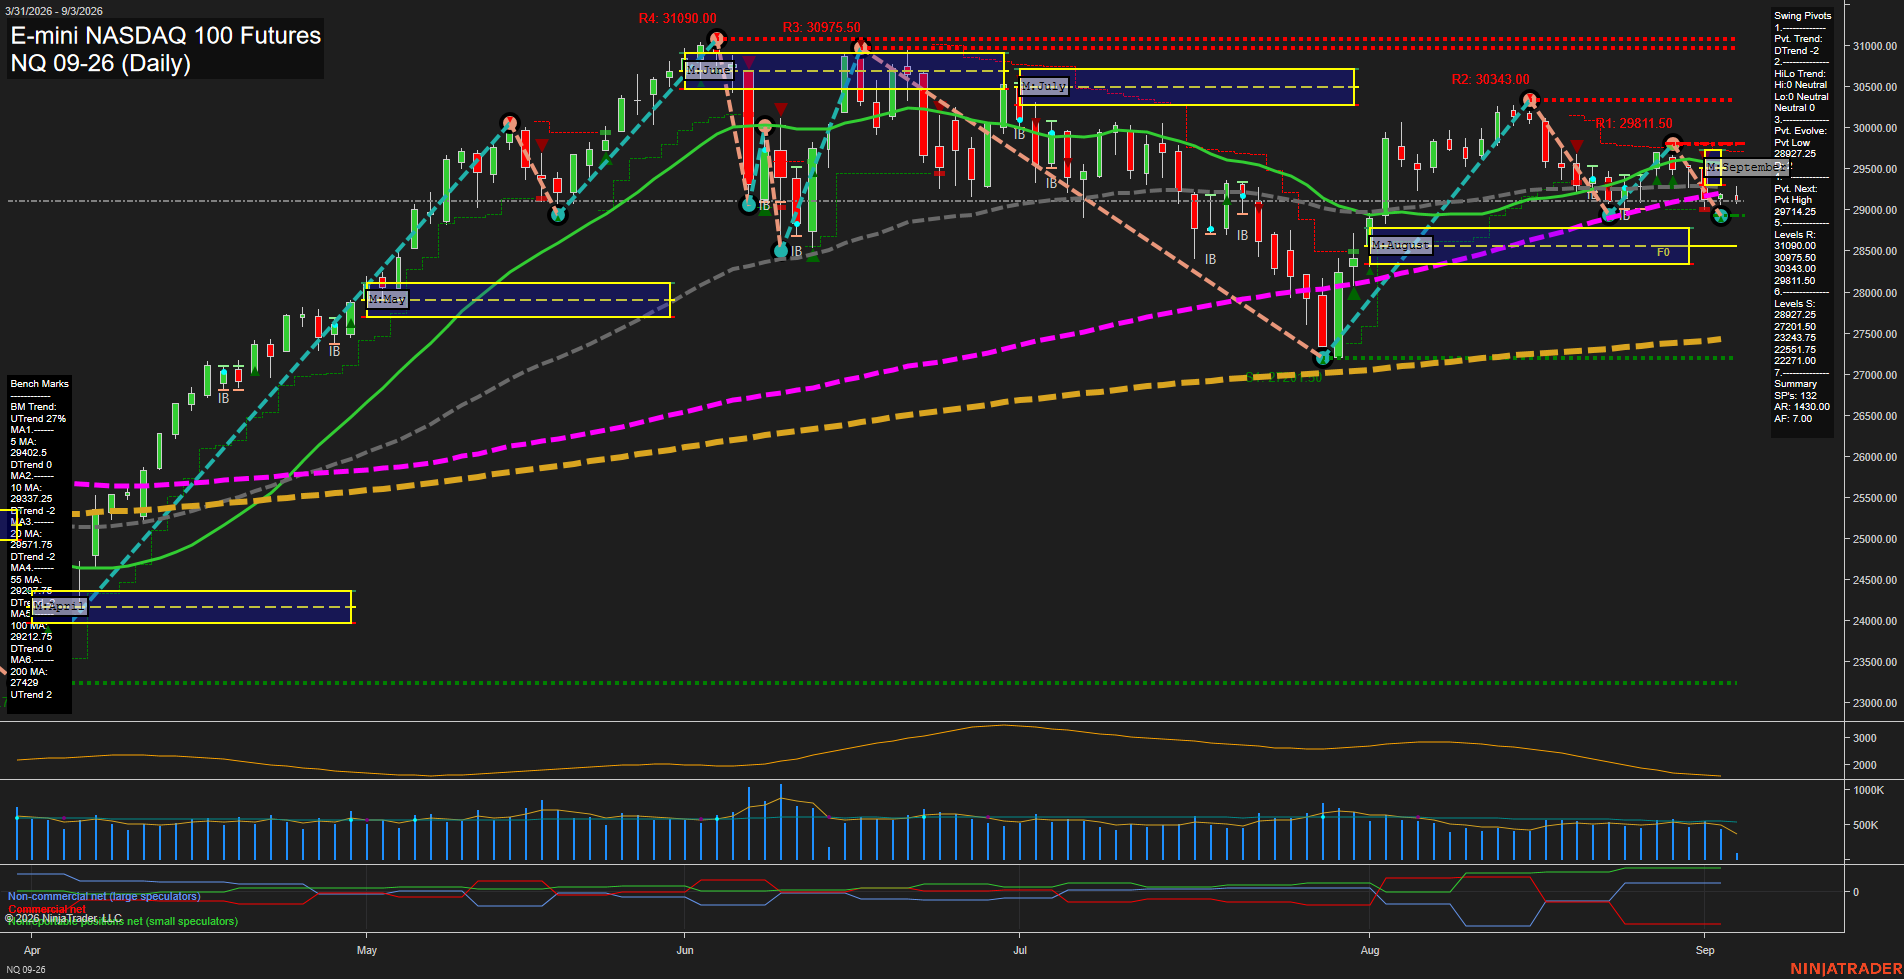
Overall Rating
- Short-Term: Bearish
- Intermediate-Term: Bearish
- Long-Term: Bullish.
Key Insights Summary
Price is trading beneath the short- and intermediate-term benchmark cluster, with the 5, 10, 20, 55, and 100 day averages all declining. The daily pivot structure remains in a DTrend and recent price action has formed lower highs following the August rebound. The 28927.25 pivot support is the immediate structural reference, while 29142.5 is the next pivot reversal level and 29292.75 to 29577.75 defines the nearby moving-average resistance band. Intermediate conditions remain corrective under the September monthly grid, while the yearly grid and rising 200 day average preserve the broader long-term uptrend context. ATR remains elevated, reflecting a volatile consolidation and retracement phase rather than a smooth directional advance.
View charts on: AlphaWebTrader HTF Charts
CL Daily View
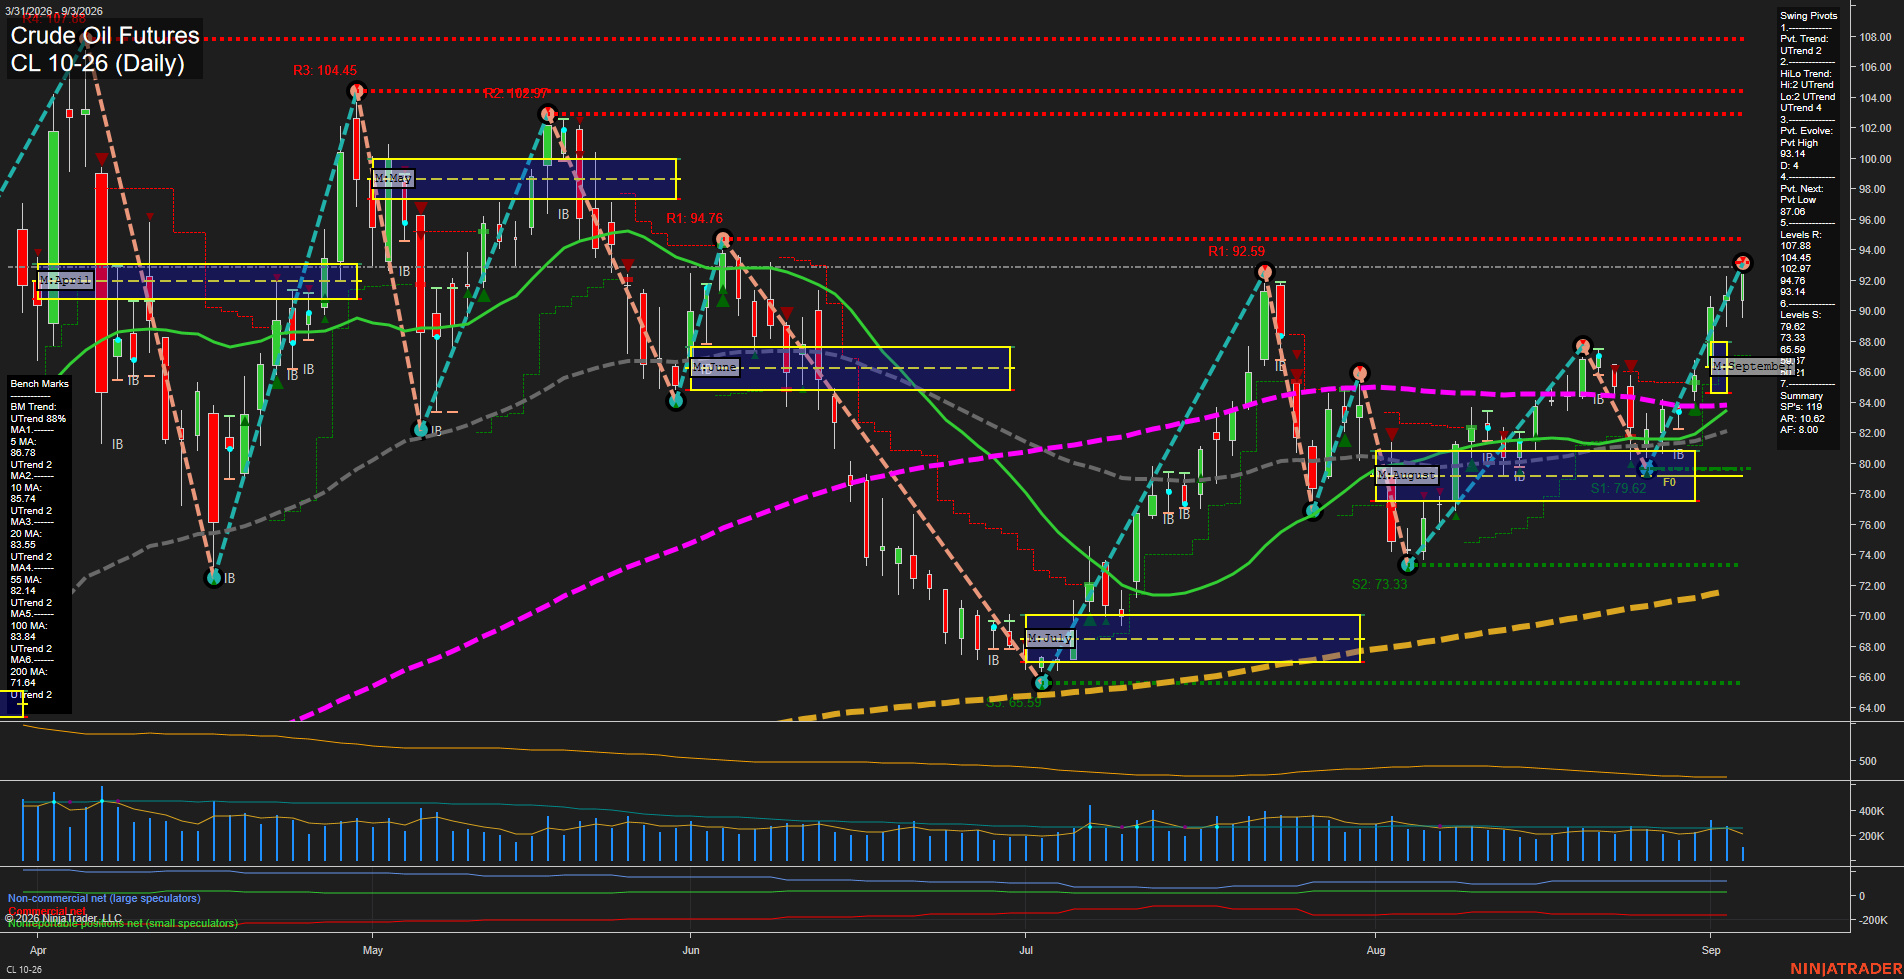
Overall Rating
- Short-Term: Bullish
- Intermediate-Term: Bullish
- Long-Term: Bullish.
Key Insights Summary
Price is advancing in a fast, large-bar rally and has established a new short-term pivot high at 93.14. The pivot structure is aligned upward across both short-term and intermediate-term measures, while price holds above every benchmark moving average. The recent advance extends from the August higher low near 79.62 and has pushed through the prior 87.06 reversal area. The 94.76 pivot resistance is the nearest overhead structural level, followed by the 102.97 to 104.45 resistance zone. The trend remains broadly constructive, although the sharp recovery has produced elevated swing volatility and a comparatively extended distance above the 20-day, 55-day, and 100-day averages.
View charts on: AlphaWebTrader HTF Charts
GC Daily View
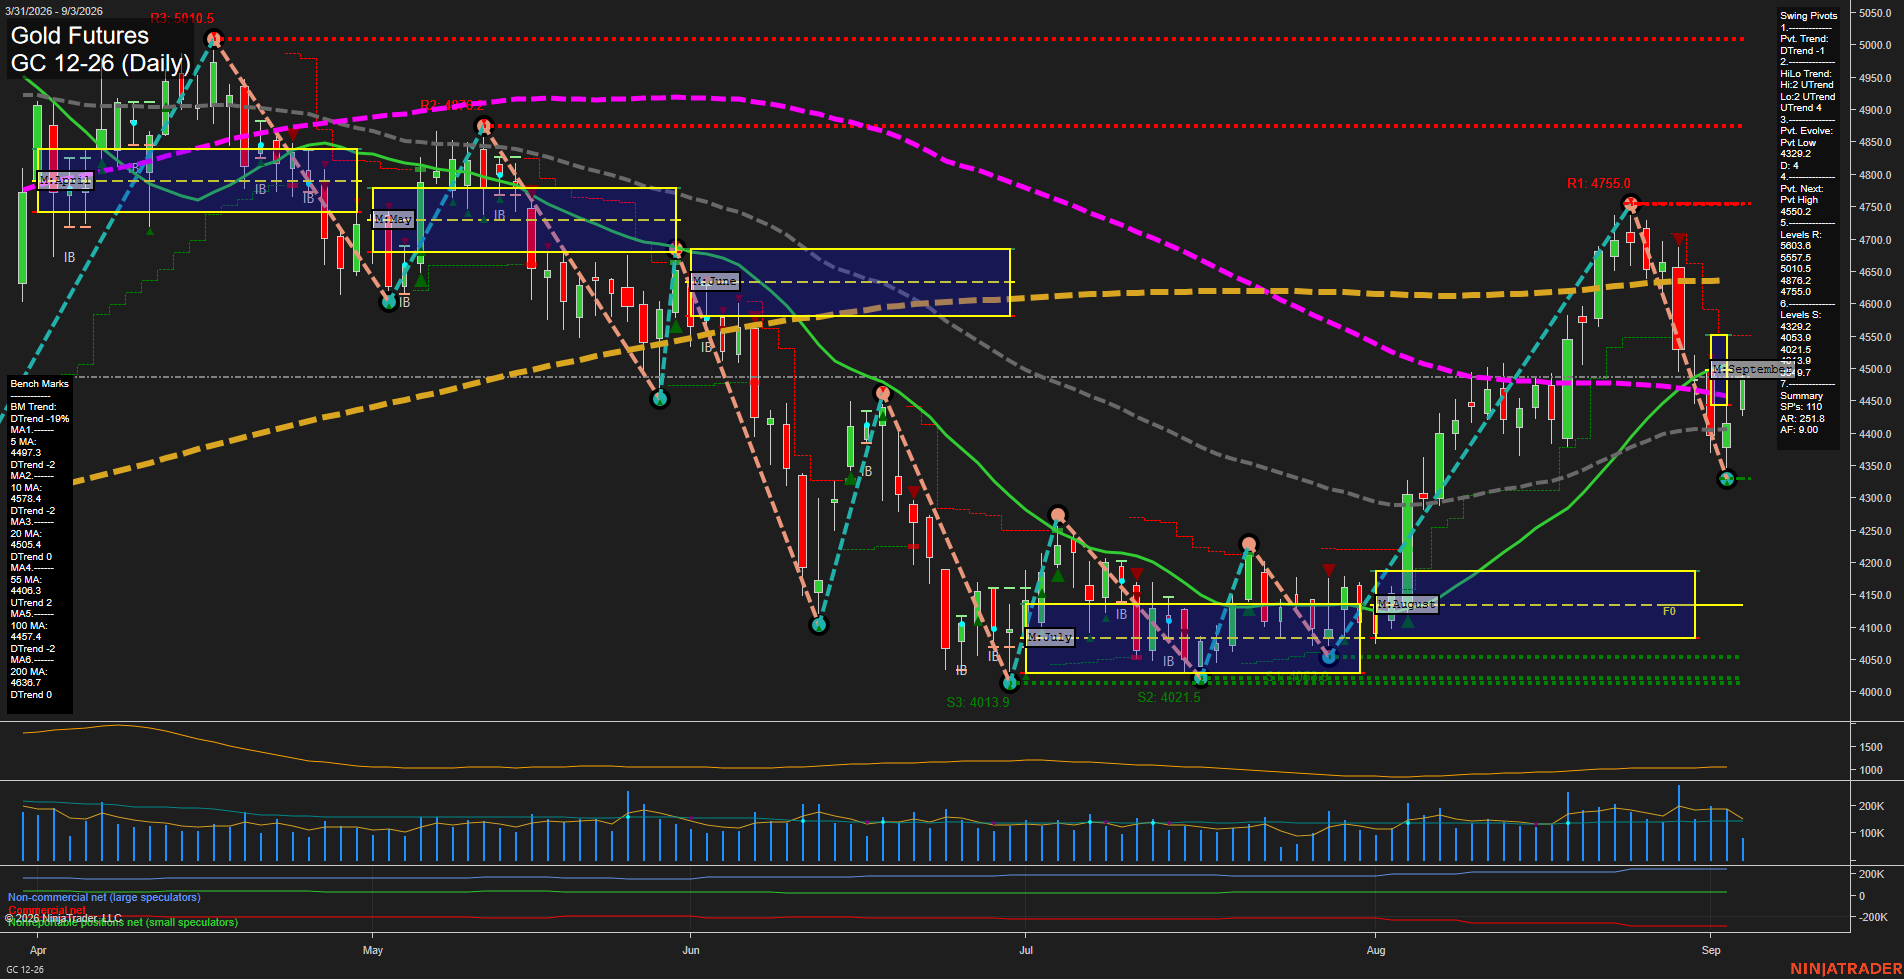
Overall Rating
- Short-Term: Bearish
- Intermediate-Term: Neutral
- Long-Term: Bearish.
Key Insights Summary
GC has undergone a fast counter-trend selloff from the 4755.0 pivot high into the newly established 4329.2 pivot low, followed by a modest rebound toward 4437.4. Short-term structure remains bearish, with price under the 5-, 10-, and 20-day benchmarks and a DTrend pivot reading. The intermediate picture is mixed: the monthly and weekly Fib-grid trends remain positive and the 55-day average is rising, while price is still below the 20-day average and the 4550.2 pivot threshold. Long-term conditions remain negative beneath declining 100- and 200-day averages and a bearish yearly Fib-grid posture. The current pattern reflects elevated volatility, a sharp retracement, and a possible stabilization attempt above the 4329.2 swing-low support.
View charts on: AlphaWebTrader HTF Charts