U.S. stocks extended losses as Strait of Hormuz hostilities lifted oil and Treasury yields, intensifying inflation concerns and Fed rate-hike repricing.
Fundamentals: U.S. equities fell for a third session as escalating hostilities around the Strait of Hormuz pushed Brent crude above $94 a barrel and lifted Treasury yields. The bond selloff renewed inflation and Fed-rate concerns, weighing on growth and semiconductor shares. Gold declined as the stronger dollar and higher yields offset geopolitical haven demand.
Technicals: USO, AAPL and META led ETF gains, while IBIT, GLD and TSLA declined. Futures analysis showed bearish short- and intermediate-term conditions across ES, NQ, YM, EMD, RTY and FDAX following recent pullbacks from key highs. Despite weakening momentum, declining short-term averages and lower Fib-grid positioning, longer-term trend structures remained broadly bullish above major benchmark averages.
After Market Close daily snapshot: market news summary and sentiment, major ETFs, Magnificent 7 analysis, Indices Futures Higher Time Frame Analysis, and E-mini S&P500, Nasdaq 100, NYMEX Crude, Gold Futures Daily Chart analysis.
As of: September 1, 2026 05:00 CT
Market News Summary:
U.S.-Iran hostilities around the Strait of Hormuz drove oil higher, lifted bond yields, and pressured U.S. equities.
Primary Drivers & Risks:
- Primary Driver: Hormuz conflict lifts oil and yields
- Primary Risk: Inflation and Fed-hike repricing
Tone:
Risk-off, with energy-led inflation concerns dominating.
Stock Market / ETFs / Indices:
U.S. stocks fell for a third consecutive session, with the Dow down roughly 400–450 points and the S&P 500 and Nasdaq also lower. Higher crude prices and the bond selloff weighed especially on growth and AI-linked semiconductor shares. Separately, ETF flows showed continued U.S. large-cap demand alongside gold allocations.
Geopolitical:
The U.S. struck Iranian targets after attacks on commercial shipping and U.S. forces near the Strait of Hormuz. The escalation revived concerns over sustained disruption to a major global oil transit route.
Oil / Energy:
Brent crude moved above $94 a barrel after crossing $90 the prior day, while WTI broke its post-March downtrend and its 100-day moving average. The advance reflected renewed supply-flow risks tied to hostilities around Hormuz.
Gold / Metals:
Gold fell despite renewed war risk, pressured by higher Treasury yields, a stronger dollar, elevated oil prices, and firmer Fed-hike odds. Prices tested support near $4,311 after breaking below key moving averages; nickel prices also weakened on higher-supply expectations.
Fed / Financials:
The 10-year Treasury yield rose above 4.8%, its highest level in nearly 20 months, while the 30-year approached 5.28%. Higher energy costs intensified inflation concerns and lifted expectations for a September Fed rate increase; rising yields also raised concerns around fiscal deficits and long-duration debt supply, including AI infrastructure financing.
Macro / Other:
AI infrastructure spending remained a constructive corporate theme, with large technology firms increasingly using debt to fund data-center buildouts. Hardware names tied to AI connectivity received favorable analyst attention, though higher rates pressured the broader growth-stock complex.
Conclusion:
Hormuz-related conflict, surging crude, and rising Treasury yields were the central forces behind the equity decline. Inflation concerns and Fed policy repricing reinforced pressure across major U.S. indices.
Gold failed to act as an immediate haven as yields and the dollar rose. AI investment remained a supportive company-level theme but faced rate-sensitive valuation pressure.
Market News Sentiment
Market News Articles: 32
- Neutral: 50.00%
- Positive: 28.12%
- Negative: 21.88%
Sentiment Summary: Of 32 market news articles, 50% were neutral, 28% positive, and 22% negative, indicating predominantly neutral coverage with a positive skew over negative items.
Conclusion: Indices futures day traders face a broadly balanced news backdrop, with neutral reporting representing the largest share.
GLD,Gold Articles: 14
- Negative: 57.14%
- Positive: 35.71%
- Neutral: 7.14%
Sentiment Summary: GLD/Gold coverage is predominantly negative, with 57% negative, 36% positive, and 7% neutral articles across 14 items.
Conclusion: The news tone around gold is net negative, which may be relevant for indices futures traders monitoring safe-haven sentiment.
USO,Oil Articles: 13
- Positive: 53.85%
- Negative: 30.77%
- Neutral: 15.38%
Sentiment Summary: USO/Oil coverage is moderately positive, with 54% positive, 31% negative, and 15% neutral articles across 13 items.
Conclusion: Oil-related news sentiment is net positive but includes a meaningful negative share relevant to index futures market context.
Market Data Snapshot
ETF Snapshot of major stock market ETFs, Mag7, and others as of: September 1, 2026 05:00
Top Movers & Losers
- USO 141.00 Bullish 5.46% ▲
- AAPL 325.13 Bullish 2.61% ▲
- META 578.54 Bullish 1.08% ▲
- IBIT 43.76 Bearish -2.04% ▼
- GLD 396.75 Bearish -2.86% ▼
- TSLA 356.09 Bearish -3.22% ▼
Major Index ETFs: SPY, QQQ, DIA, IWM, IJH
- SPY 761.78 Bearish -0.69% ▼
- DIA 527.75 Bearish -0.72% ▼
- IJH 74.60 Bearish -1.00% ▼
- IWM 290.57 Bearish -1.14% ▼
- QQQ 707.64 Bearish -1.27% ▼
Major index ETFs were uniformly Bearish: QQQ led losses at -1.27%, followed by IWM at -1.14% and IJH at -1.00%. DIA was the least negative mover at -0.72%, while SPY declined -0.69%.
Mag 7 Stocks: AAPL, MSFT, GOOG, AMZN, META, NVDA, TSLA
- AAPL 325.13 Bullish 2.61% ▲
- META 578.54 Bullish 1.08% ▲
- GOOG 332.03 Bearish -1.01% ▼
- MSFT 501.02 Bearish -1.24% ▼
- NVDA 217.44 Bearish -1.51% ▼
- AMZN 254.92 Bearish -1.87% ▼
- TSLA 356.09 Bearish -3.22% ▼
Mixed Mag7 snapshot: AAPL is the most bullish mover at +2.61%, followed by META at +1.08%. TSLA is the most bearish mover at -3.22%, with additional Bearish pressure in AMZN -1.87%, NVDA -1.51%, MSFT -1.24%, and GOOG -1.01%.
Cross-Market ETFs: TLT, GLD, USO, IBIT
- USO 141.00 Bullish 5.46% ▲
- TLT 81.87 Bearish -0.79% ▼
- IBIT 43.76 Bearish -2.04% ▼
- GLD 396.75 Bearish -2.86% ▼
Mixed cross-market snapshot: USO is the most bullish mover at +5.46%. GLD is the most bearish mover at -2.86%, followed by IBIT at -2.04%; TLT is also Bearish at -0.79%.
ETF, Mag7, and Cross-Market ETF Insights
Overall Tone
Mixed tone: broad equity ETFs were Bearish while selective strength in AAPL, META, and USO contrasted with pronounced weakness in TSLA, GLD, and IBIT.
Equity ETFs and Mag7:
Major Index ETFs were broadly Bearish, led lower by QQQ -1.27%, IWM -1.14%, IJH -1.00%, DIA -0.72%, and SPY -0.69%, indicating weakness across large-cap, mid-cap, and small-cap equities. Mag7 action was selective: AAPL was the most bullish mover at +2.61% and META gained +1.08%, while GOOG -1.01%, MSFT -1.24%, NVDA -1.51%, AMZN -1.87%, and TSLA were Bearish; TSLA was the most bearish mover at -3.22%.
Cross-Market ETFs:
Cross-market action was Mixed, with USO the most bullish mover at +5.46%, diverging sharply from Bearish equities and signaling commodity strength. TLT was the least negative mover at -0.79%, while IBIT fell -2.04% and GLD was the most bearish mover at -2.86%, showing weakness in both gold and bitcoin exposure.
Futures Indices – Higher Time Frame Analysis
Summary of the current state of US Indices Futures based on higher time-frame (HTF) technical analysis as of: 2026-09-01: 17:00 CT.
US Indices Futures
- ES YSFG above F0%, MSFG/WSFG below F0%, benchmarks mixed, pivots 7648.50/7838.50, support 7465.50, resistance 7782.50-7838.50.
- NQ YSFG constructive, MSFG/WSFG down, benchmarks above long-term averages, pivots 29013.50/29864.25, support 28946.75, resistance 30343.00-31090.00.
- YM YSFG above F0%, MSFG/WSFG corrective, above long-term benchmarks, pivots 52812-52871/53739, support 52500, resistance 53739-54884.
- EMD YSFG constructive, MSFG/WSFG below F0%, below daily 100-day benchmarks, pivots 3724.0/3941.7, support 3724.0-3736.8, resistance 3941.7.
- RTY YSFG constructive, MSFG/WSFG down, below short benchmarks but above 100/200-day, pivots 2940.5/3006.7, support 2902.3, resistance 3079.9.
- FDAX YSFG constructive, MSFG/WSFG below F0%, above long-term benchmarks, pivots 25173/26665, support 25173-25965, resistance 26662-26665.
Overall State
- Short-Term: Bearish
- Intermediate-Term: Bearish
- Long-Term: Bullish
Conclusion
All listed contracts show short-term bearish correlations, with MSFG and WSFG positioning generally below F0% and recent short signals following August swing highs. ES, NQ, YM, EMD, RTY, and FDAX retain bullish long-term structure through YSFG context and rising longer-period benchmarks. Current price action is centered on nearby pivot-support tests, while recent swing highs remain the principal resistance references.
Note: Intra-day counter-trend pullbacks or retracements may occur, HTF is context for informational usage and market structure. Glossary: Session Fib Grids periods of YSFG:’Yearly’, MSFG:’Monthly’, WSFG:’Weekly’
For full details visit: AlphaWebTrader Technicals
ES Daily View
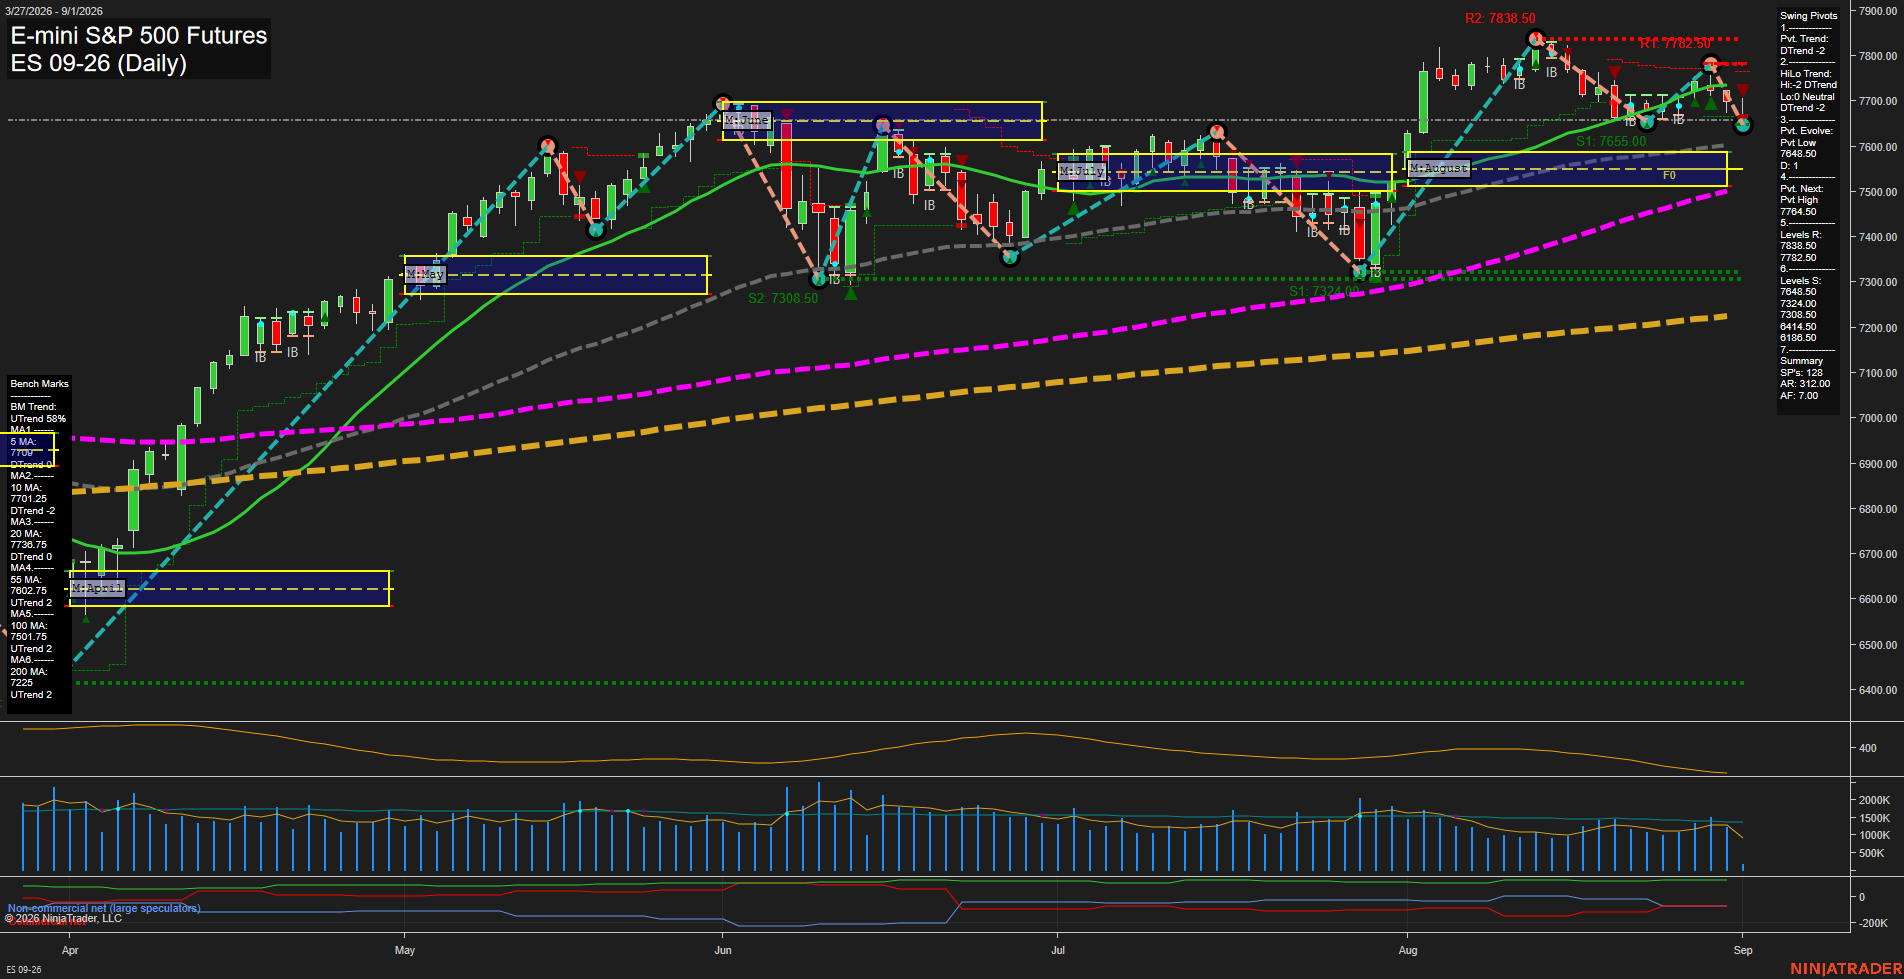
Overall Rating
- Short-Term: Bearish
- Intermediate-Term: Bearish
- Long-Term: Bullish.
Key Insights Summary
Price has rolled over sharply from the 7838.50 swing-high region, creating a short-term lower-high and lower-low sequence. The close beneath the weekly and monthly Fib-grid centers, the declining 5-, 10-, and 20-day benchmarks, and aligned DTrend pivot readings define the active swing structure as bearish. The 7648.50 pivot-low support is the immediate structural reference, while 7782.50 and 7838.50 remain the overhead pivot-resistance zone. Longer-term structure remains constructive because price is still above rising 55-, 100-, and 200-day benchmarks and the yearly Fib-grid bias remains positive; the current move is therefore a meaningful intermediate pullback within a broader long-term uptrend. Declining ATR from the late-August peak indicates volatility compression following the reversal, while volume remains active relative to recent sessions.
View charts on: AlphaWebTrader HTF Charts
NQ Daily View
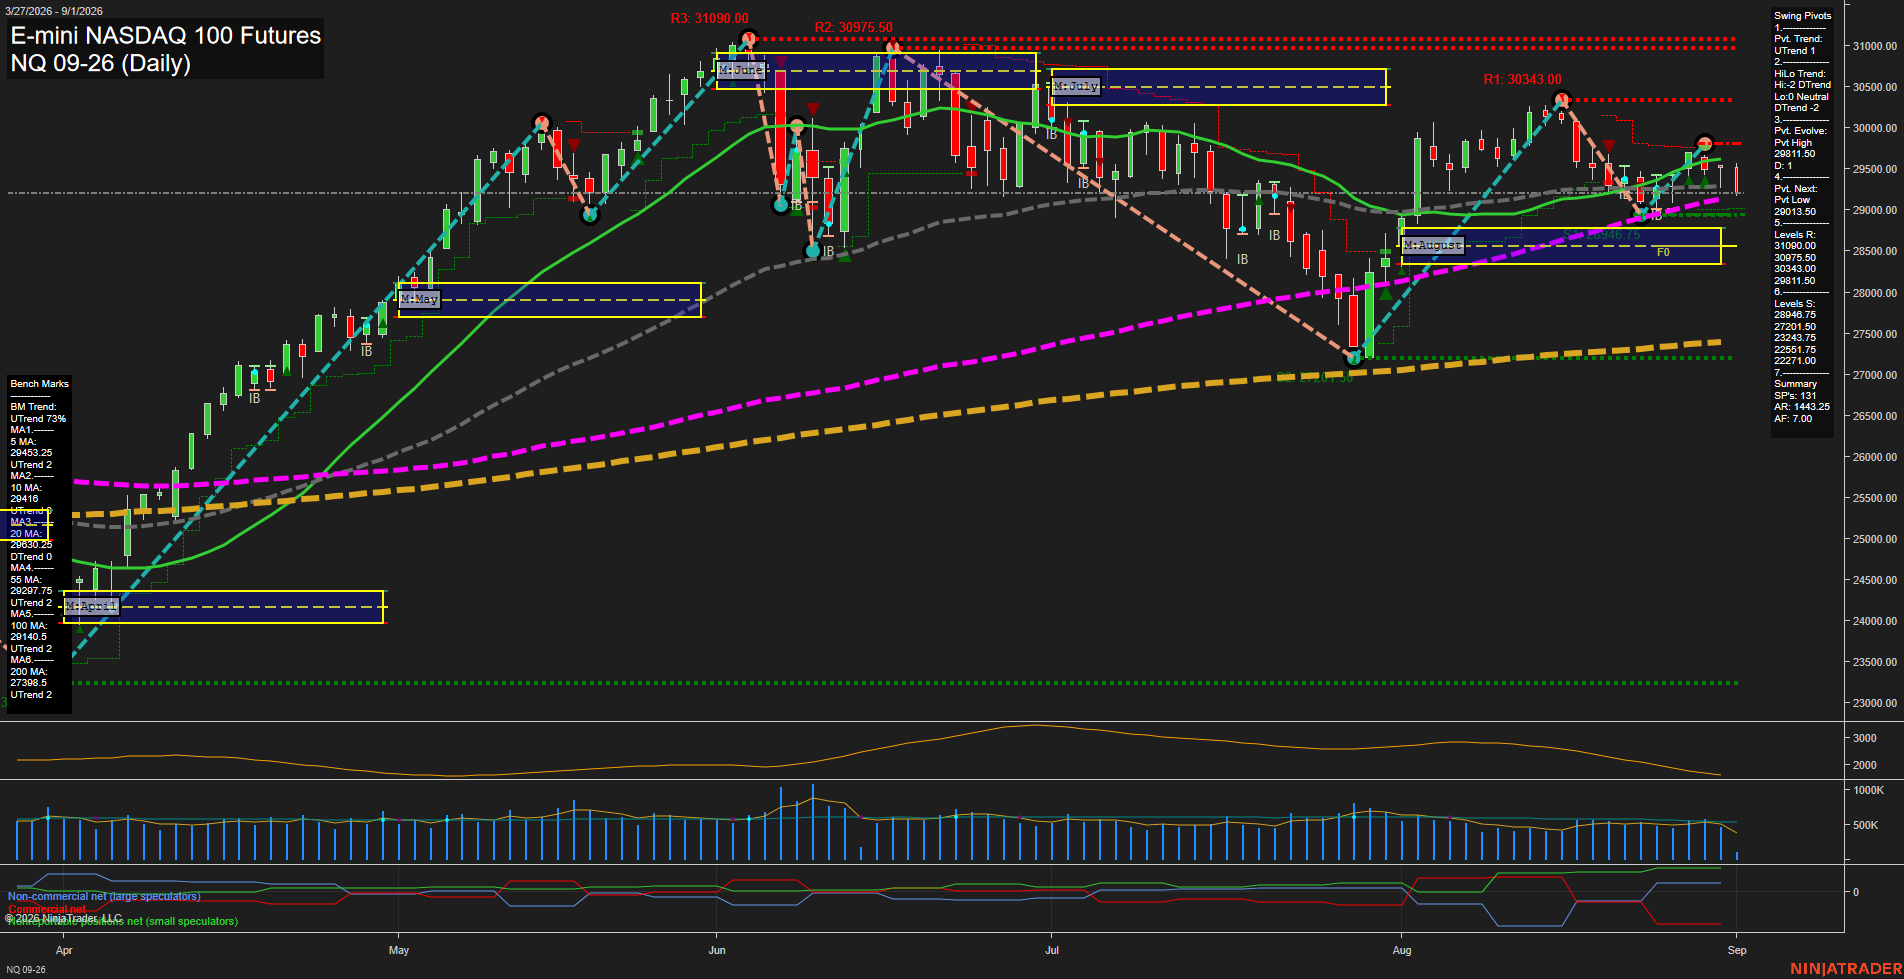
Overall Rating
- Short-Term: Bearish
- Intermediate-Term: Bearish
- Long-Term: Bullish.
Key Insights Summary
Price is consolidating beneath the weekly and September monthly F0% reference areas after a sharp August recovery, leaving short-term action choppy with muted momentum. The active short-term pivot remains upward, but the intermediate pivot structure remains in a downtrend and the recent advance stalled below 30343 resistance. Price is holding near the 55-day and 100-day benchmarks while remaining above the rising 200-day average, preserving the broader 2026 uptrend. The 29864.25 pivot high and 30343.00 resistance define the overhead recovery zone, while 29013.50 and 28946.75 form the nearest downside pivot-support area.
View charts on: AlphaWebTrader HTF Charts
CL Daily View
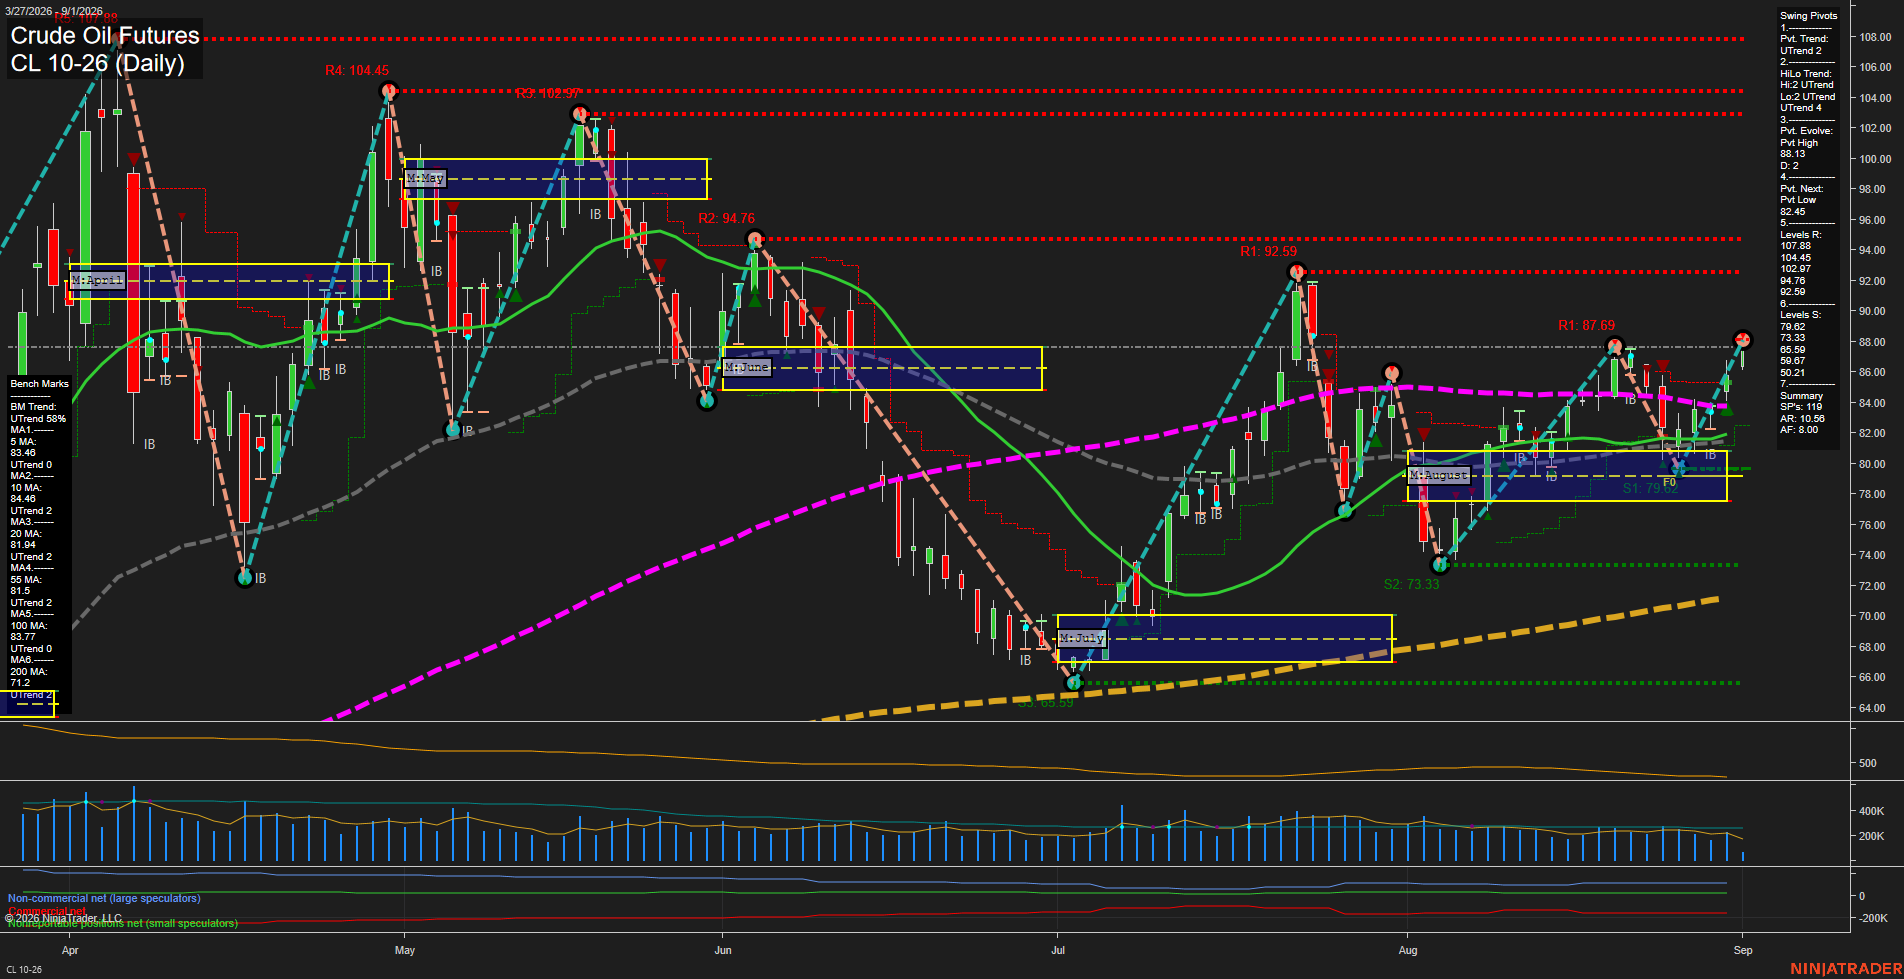
Overall Rating
- Short-Term: Bullish
- Intermediate-Term: Bullish
- Long-Term: Bullish.
Key Insights Summary
Price is extending a sharp late-August recovery into the 87.69 pivot-resistance area, with the latest advance holding above all six daily benchmark averages. The swing-pivot structure is UTrend on both short- and intermediate-term measures, supported by higher lows from the 73.33 August low and a new evolving pivot high at 88.13. The 82.45 pivot-next level defines the nearest structural reversal threshold, while 92.59 and 94.76 are the next overhead pivot-resistance references. Fast upside momentum and the price position above the weekly, monthly, and yearly Fib-grid centers align with a broad bullish continuation phase, although the immediate move is testing a prior swing-high zone after a rapid rally.
View charts on: AlphaWebTrader HTF Charts
GC Daily View
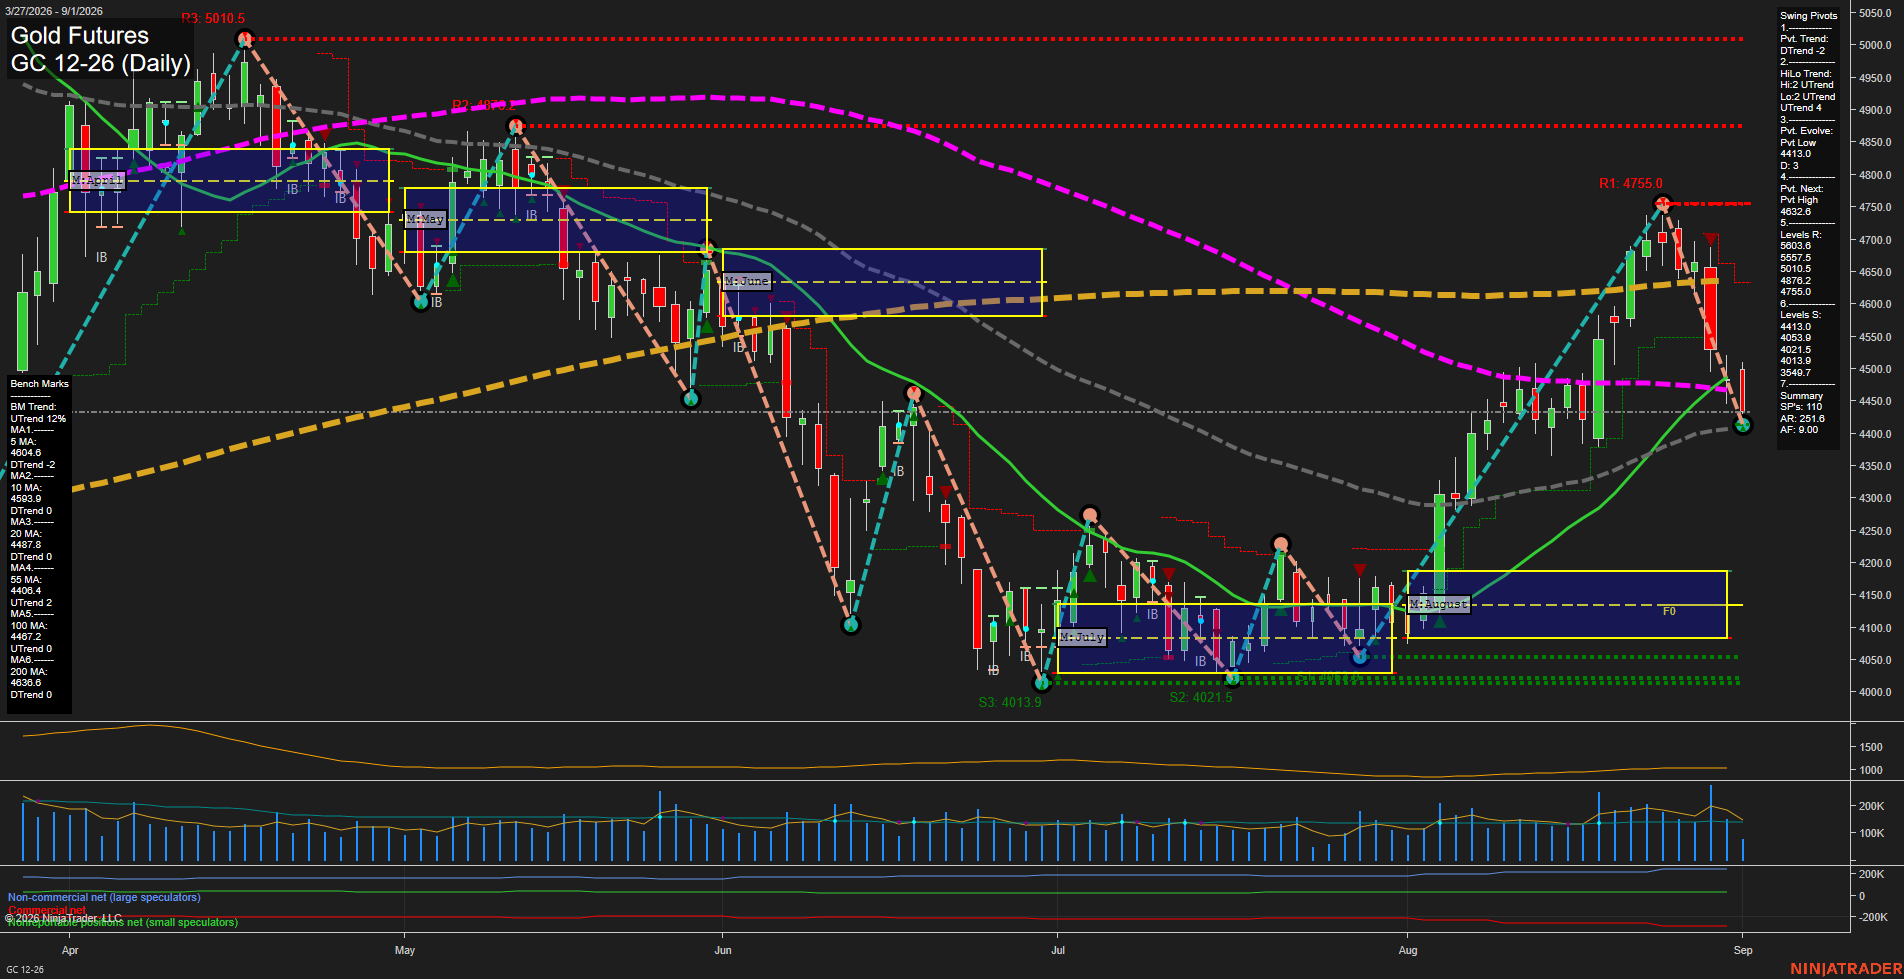
Overall Rating
- Short-Term: Bearish
- Intermediate-Term: Bearish
- Long-Term: Bearish.
Key Insights Summary
GC has undergone a fast, high-volatility reversal from the 4755 pivot high into the 4413 pivot-low area. Price remains below the 5-, 10-, 20-, 100-, and 200-day benchmarks, while the weekly and monthly Fib-grid structures are both down. The short-term pivot sequence is bearish despite the intermediate HiLo structure remaining upward, reflecting a sharp countertrend selloff within a previously broader recovery. The 4408 55-day average and 4413 pivot-low area form a tightly clustered near-term reference zone, while 4487 to 4467 marks overhead moving-average resistance. Volume expanded during the decline, consistent with an impulsive liquidation phase rather than a quiet consolidation.
View charts on: AlphaWebTrader HTF Charts