U.S. futures edge lower as oil tops $95 and yields rise, while ETF movers and index charts signal short-term pressure within constructive trends.
Fundamentals: U.S. index futures moved lower in pre-market trading as Brent crude climbed above $95 and long-term bond yields rose amid renewed U.S.-Iran tensions and concerns over Strait of Hormuz shipping. Technology shares faced added pressure from valuation scrutiny, while investors tracked oil inventories, jobs data, CPI and the Federal Reserve decision. AVGO and SNOW report after the close.
Technicals: Pre-market conditions show mixed ETF leadership, with USO, Apple and Meta higher in the prior session while IBIT, gold and Tesla declined. ES, NQ, YM, EMD, RTY and FDAX futures retain broadly constructive longer-term structures, but daily and weekly readings indicate short-term bearish corrective pressure below key near-term benchmarks and pivot levels.
Pre-Market Trading 360° view Market Radar of: holidays, earnings, eco-news, market-news summary, news sentiment, prior session major ETFs, MAG7, Higher Time Frame Analysis Indices Futures Summary, and E-mini S&P500, Nasdaq 100, NYMEX Crude, Gold Futures Daily Chart analysis.
As of: September 2, 2026 07:16 CT
Holiday Radar
- 2026-09-07 Labor Day
Earnings Radar
Monitoring for earnings releases by the Magnificent 7, AI-tech-related firms, and major financial institutions.
- AVGO Release: 2026-09-02 T:AMC
- SNOW Release: 2026-09-02 T:AMC
Conclusion: AVGO reports after the 2026-09-02 close, placing a major semiconductor and AI-linked earnings catalyst after the cash session; SNOW also reports AMC, adding enterprise software and data-cloud sensitivity. Market momentum and volume can slow ahead of these major tech earnings releases, with index futures focused on post-release reactions.
For full details visit: Yahoo Earnings Calendar
EcoNews Radar U.S. Events
| Day | Time | Impact | Event |
|---|---|---|---|
| Wed | 10:30 | Low | Crude Oil Inventories |
| Thu | 08:30 | Medium | Unemployment Claims |
| Thu | 10:00 | Medium | ISM Services PMI |
| Fri | 08:30 | High | Average Hourly Earnings m/m |
| Fri | 08:30 | High | Non-Farm Employment Change |
| Fri | 08:30 | High | Unemployment Rate |
EcoNews Summary
The week centers on Friday’s 08:30 USD labor-market release, featuring three high-impact indicators: Average Hourly Earnings m/m, Non-Farm Employment Change, and the Unemployment Rate. Together, these reports measure wage growth, job creation, and labor-market conditions, making them key inputs for index-futures volatility. Wednesday’s crude oil inventories report adds energy-market context through changes in petroleum supply.
Event Notes:
- Wednesday 10:30 – USD Crude Oil Inventories: Measures the weekly change in U.S. commercial crude-oil stockpiles. Traders monitor inventory changes for signals on petroleum supply, energy-price pressure, and inflation-related market context.
- Friday 08:30 – USD Average Hourly Earnings m/m: Measures the monthly change in average employee pay. It is monitored as an indicator of wage inflation and labor-cost pressure.
- Friday 08:30 – USD Non-Farm Employment Change: Measures the monthly change in employment outside the farm sector. It provides a broad reading of job creation and labor-market strength.
- Friday 08:30 – USD Unemployment Rate: Measures the share of the labor force without work and actively seeking employment. It provides context on labor-market slack and overall employment conditions.
Conclusion:
The single most important event is Friday at 08:30, led by USD Non-Farm Employment Change, alongside the simultaneous wage-growth and unemployment-rate data. The combined labor-market release is the week’s main high-impact catalyst for index futures. Wednesday’s crude inventory data provides additional energy and inflation context; high oil prices directly affect markets through inflation and geopolitical concerns.
For full details visit: Forex Factory EcoNews
Market News Summary:
U.S. index futures pointed lower as Middle East conflict lifted oil prices and bond yields, intensifying pressure on equity valuations and the AI-led market advance.
Primary Drivers & Risks:
- Primary Driver: Oil surge and rising yields
- Primary Risk: Hormuz disruption and inflation pressure
Tone:
Risk-off, with energy and rate pressures dominating.
Stock Market / ETFs / Indices:
Early Wednesday futures showed the Dow down 0.17%, S&P 500 futures down 0.29%, and Nasdaq 100 futures down 0.65%. Higher crude prices, a 10-year Treasury yield near 4.8%, and renewed scrutiny of AI valuations weighed most heavily on technology shares. The S&P 500 remained near highs despite signs of a slowing U.S. labor market.
Geopolitical:
Fresh U.S.-Iran strikes kept focus on the Strait of Hormuz and regional energy flows. Vessel transits ran below the recent average in preliminary data, while Qatar and UAE LNG cargoes were transferred outside the strait for delivery to Asian buyers. China also blocked a unified G20 statement amid disagreement over its trade surplus.
Oil / Energy:
Brent moved above $95 a barrel and WTI prices surged as conflict-related supply concerns intensified. Oil inventories provided additional support, while Hormuz shipping data remained mixed: one report showed reduced vessel traffic, while the U.S. energy secretary cited more than 17 million barrels transiting on Monday. U.S. oil-company agreements in Venezuela were described as supporting a more than doubling of Venezuelan crude output over the next several years.
Gold / Metals:
Gold and silver remained under pressure ahead of U.S. jobs data. Gold support near $4,220-$4,263 and silver support near $60 were in focus, while energy-driven inflation concerns revived discussion of tighter Fed policy.
Fed / Financials:
The jobs report, CPI, and the Fed rate decision have displaced earnings as major market catalysts. Rising oil prices and a global sovereign-bond selloff lifted long-term yields, with German 10-year yields at their highest since 2011 and U.K. 10-year yields at their highest since 2007. U.S. fiscal concerns remained elevated as long-dated Treasury yields stood at their highest since 2007 and national debt exceeded $40 trillion.
Macro / Other:
Intense heat raised blackout risk across U.S. electricity grids from the Midwest through the Mid-Atlantic. Separate commentary highlighted substantial government debt and corporate borrowing tied to AI data-center infrastructure spending.
Conclusion:
Higher oil prices, escalating U.S.-Iran hostilities, and rising sovereign yields drove the weaker equity-futures tone. Jobs data, CPI, and the Fed decision remained central near-term macro events.
Hormuz shipping and LNG-routing developments underscored supply-chain stress in energy markets. Inflation concerns and elevated yields pressured valuation-sensitive AI and technology shares, while gold and silver traded lower ahead of employment data.
Market News Sentiment
Market News Articles: 36
- Neutral: 58.33%
- Positive: 22.22%
- Negative: 19.44%
Sentiment Summary: Of 36 market news articles, 58% were neutral, 22% positive, and 19% negative, indicating predominantly balanced news flow with a modest positive tilt.
Conclusion: Indices futures day traders face a largely neutral headline environment, with positive coverage slightly exceeding negative coverage.
GLD,Gold Articles: 16
- Negative: 56.25%
- Positive: 31.25%
- Neutral: 12.50%
Sentiment Summary: Gold-related coverage is predominantly negative (56%), with 31% positive and 13% neutral sentiment across 16 articles.
Conclusion: The gold news tone is net negative, indicating a cautious sentiment backdrop relevant to indices futures day traders.
USO,Oil Articles: 14
- Negative: 35.71%
- Neutral: 35.71%
- Positive: 28.57%
Sentiment Summary: USO/Oil coverage is mixed to slightly negative, with 36% negative, 36% neutral, and 29% positive articles.
Conclusion: Oil-related news sentiment presents a modest negative tilt for indices futures day traders, while neutral coverage remains equally represented.
Market Data Snapshot
ETF Snapshot of major stock market ETFs, Mag7, and others as of: September 2, 2026 07:16
Top Movers & Losers
- USO 141.00 Bullish 5.46% ▲
- AAPL 325.13 Bullish 2.61% ▲
- META 578.54 Bullish 1.08% ▲
- IBIT 43.76 Bearish -2.04% ▼
- GLD 396.75 Bearish -2.86% ▼
- TSLA 356.09 Bearish -3.22% ▼
Major Index ETFs: SPY, QQQ, DIA, IWM, IJH
- SPY 761.78 Bearish -0.69% ▼
- DIA 527.75 Bearish -0.72% ▼
- IJH 74.60 Bearish -1.00% ▼
- IWM 290.57 Bearish -1.14% ▼
- QQQ 707.64 Bearish -1.27% ▼
Major index ETFs were Bearish across the group: QQQ led losses at -1.27%, followed by IWM at -1.14% and IJH at -1.00%. DIA declined -0.72%, while SPY was the least negative mover at -0.69%.
Mag 7 Stocks: AAPL, MSFT, GOOG, AMZN, META, NVDA, TSLA
- AAPL 325.13 Bullish 2.61% ▲
- META 578.54 Bullish 1.08% ▲
- GOOG 332.03 Bearish -1.01% ▼
- MSFT 501.02 Bearish -1.24% ▼
- NVDA 217.44 Bearish -1.51% ▼
- AMZN 254.92 Bearish -1.87% ▼
- TSLA 356.09 Bearish -3.22% ▼
Mixed Mag7 snapshot: AAPL is the most bullish mover at +2.61%, followed by META at +1.08%. GOOG at -1.01%, MSFT at -1.24%, NVDA at -1.51%, and AMZN at -1.87% are Bearish, while TSLA is the most bearish mover at -3.22%.
Cross-Market ETFs: TLT, GLD, USO, IBIT
- USO 141.00 Bullish 5.46% ▲
- TLT 81.87 Bearish -0.79% ▼
- IBIT 43.76 Bearish -2.04% ▼
- GLD 396.75 Bearish -2.86% ▼
Other ETFs are Mixed: USO is the most bullish mover at +5.46%, while GLD is the most bearish mover at -2.86%. IBIT is Bearish at -2.04%, and TLT is the least negative mover at -0.79%.
ETF, Mag7, and Cross-Market ETF Insights
Overall Tone
Mixed conditions: equity ETFs are broadly Bearish while selective Mag7 strength and a strong USO gain provide isolated Bullish leadership.
Equity ETFs and Mag7:
Major Index ETFs were broadly Bearish, led lower by QQQ at -1.27%, with IWM at -1.14%, IJH at -1.00%, DIA at -0.72%, and SPY the least negative at -0.69%. Mag7 action was selective: AAPL was the most bullish mover at +2.61% and META gained +1.08%, while TSLA was the most bearish mover at -3.22%, followed by AMZN at -1.87% and NVDA at -1.51%. MSFT at -1.24% and GOOG at -1.01% reinforced the Bearish breadth outside the two Bullish leaders.
Cross-Market ETFs:
Cross-market ETFs were Mixed, with USO the most bullish mover at +5.46%, diverging sharply from Bearish equities and other cross-market instruments. GLD was the most bearish mover at -2.86%, while IBIT declined -2.04% and TLT was the least negative mover at -0.79%. Commodity strength was concentrated in USO rather than broadly shared across GLD, IBIT, and TLT.
Futures Indices – Higher Time Frame Analysis
Summary of the current state of US Indices Futures based on higher time-frame (HTF) technical analysis as of: 2026-09-02: 07:16 CT.
US Indices Futures
- ES YSFG above F0%, MSFG/WSFG below F0%, short benchmarks declining, long benchmarks rising; pivots 7618.50 support, 7735.50 reversal, 7838.50 resistance.
- NQ YSFG above F0%, MSFG/WSFG below F0%, beneath 5–100-day benchmarks; pivots 28926.25 support, 29276.25 reversal, 30343–30390 resistance.
- YM YSFG above F0%, MSFG/WSFG below F0%, below short benchmarks but above rising long averages; pivots 52720 support, 53862 resistance, 49709 support.
- EMD YSFG above F0%, MSFG/WSFG below F0%, beneath short/intermediate benchmarks; pivots 3714.1 support, 3692.9 and 3589.2 lower supports, 3941.7 resistance.
- RTY YSFG above F0%, MSFG/WSFG below F0%, beneath 5–100-day benchmarks, above rising 200-day; pivots 2914.5–2902.3 support, 2828.1 lower support, 3079.9 resistance.
- FDAX YSFG above F0%, MSFG/WSFG below F0%, testing rising 55-day benchmark; pivots 25759 support, 26207 reversal, 26662–26665 resistance.
Overall State
- Short-Term: Bearish
- Intermediate-Term: Bearish
- Long-Term: Bullish
Conclusion
US index futures are directionally correlated in short-term and intermediate-term corrective structures, with MSFG and WSFG readings generally below F0% and recent short signals aligned. ES, YM, and FDAX retain neutral intermediate weekly structures, while NQ, EMD, and RTY are intermediate bearish. YSFG positioning and rising longer-term benchmarks maintain broader bullish structures across the group. Current pivot supports define the active downswing references; August pivot highs remain primary overhead resistance.
Note: Intra-day counter-trend pullbacks or retracements may occur, HTF is context for informational usage and market structure. Glossary: Session Fib Grids periods of YSFG:’Yearly’, MSFG:’Monthly’, WSFG:’Weekly’
For full details visit: AlphaWebTrader Technicals
ES Daily View
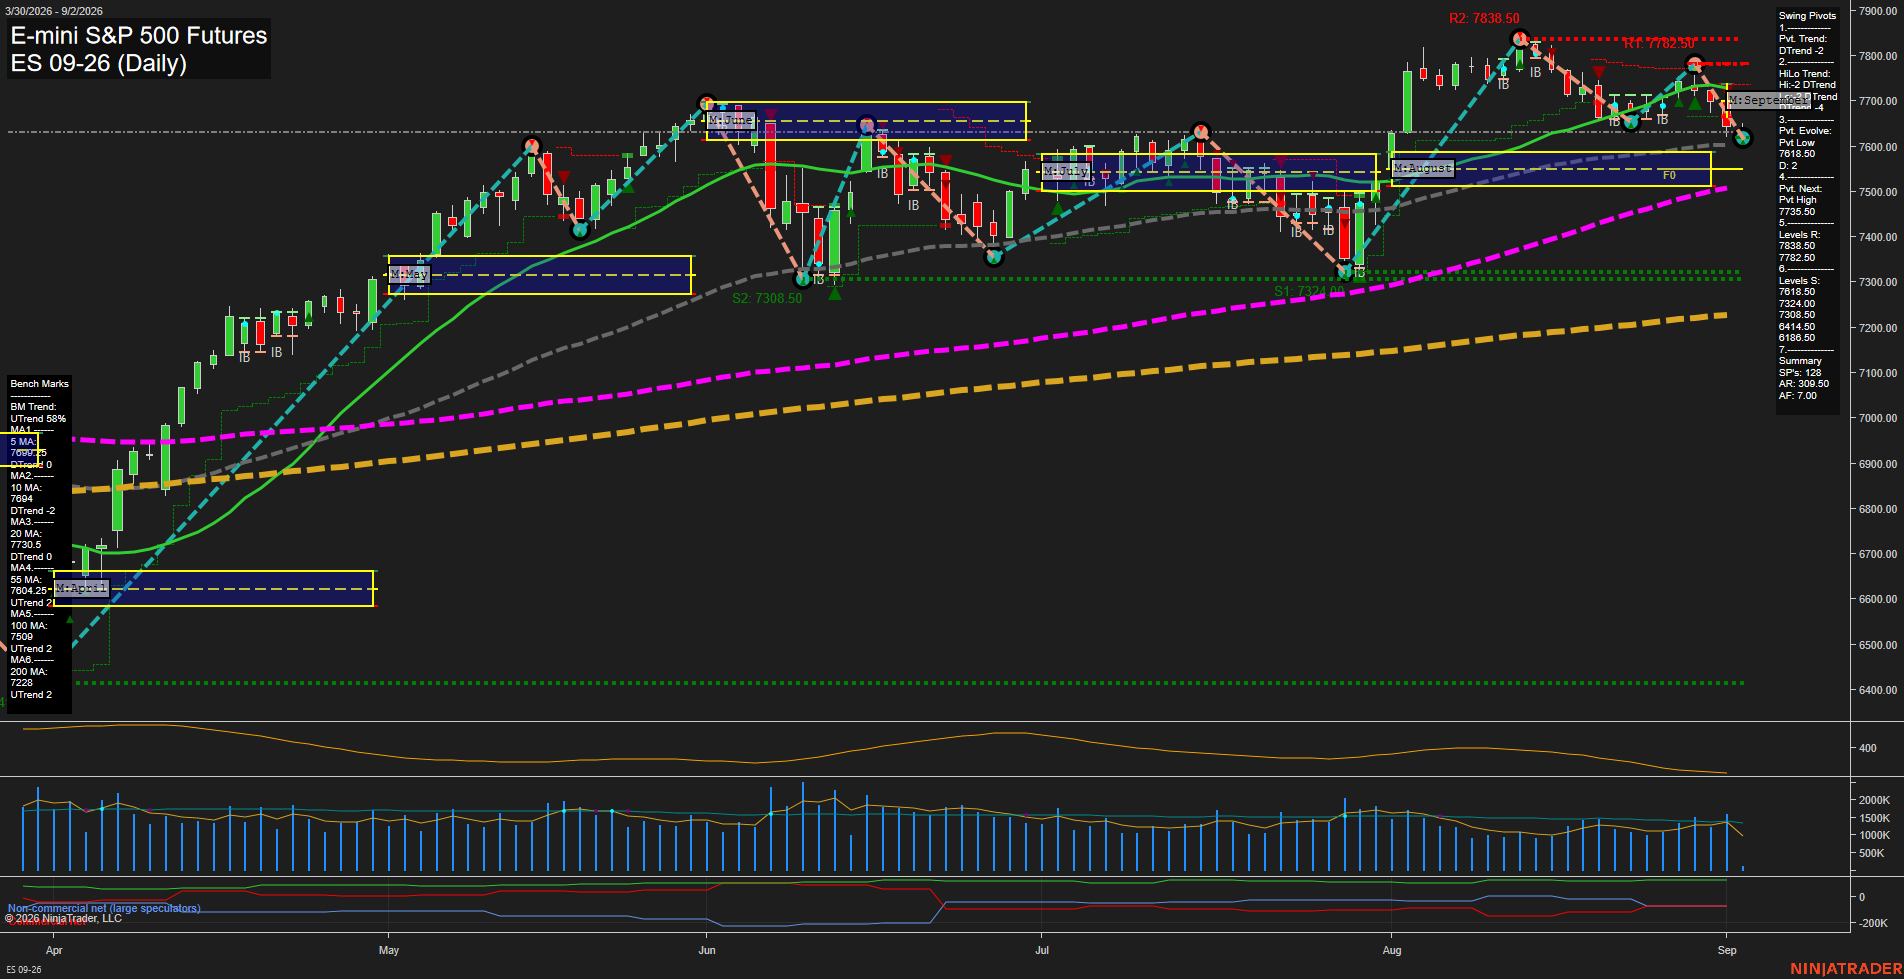
Overall Rating
- Short-Term: Bearish
- Intermediate-Term: Bearish
- Long-Term: Bullish.
Key Insights Summary
Price is in a short-term downswing after rejection from the August 7838.50 pivot high, with lower highs and a new evolving pivot low at 7618.50 defining the current corrective structure. Weekly and monthly Fib-grid readings remain below their respective F0% levels, while price is also beneath the declining 5-, 10-, and 20-day benchmarks. The 55-, 100-, and 200-day averages remain positively aligned beneath price, preserving the larger 2026 uptrend despite the near-term September pullback. The 7618.50 support and 7735.50 pivot-reversal level frame the immediate swing range, while elevated ATR reflects broad daily movement and a volatile consolidation environment.
View charts on: AlphaWebTrader HTF Charts
NQ Daily View
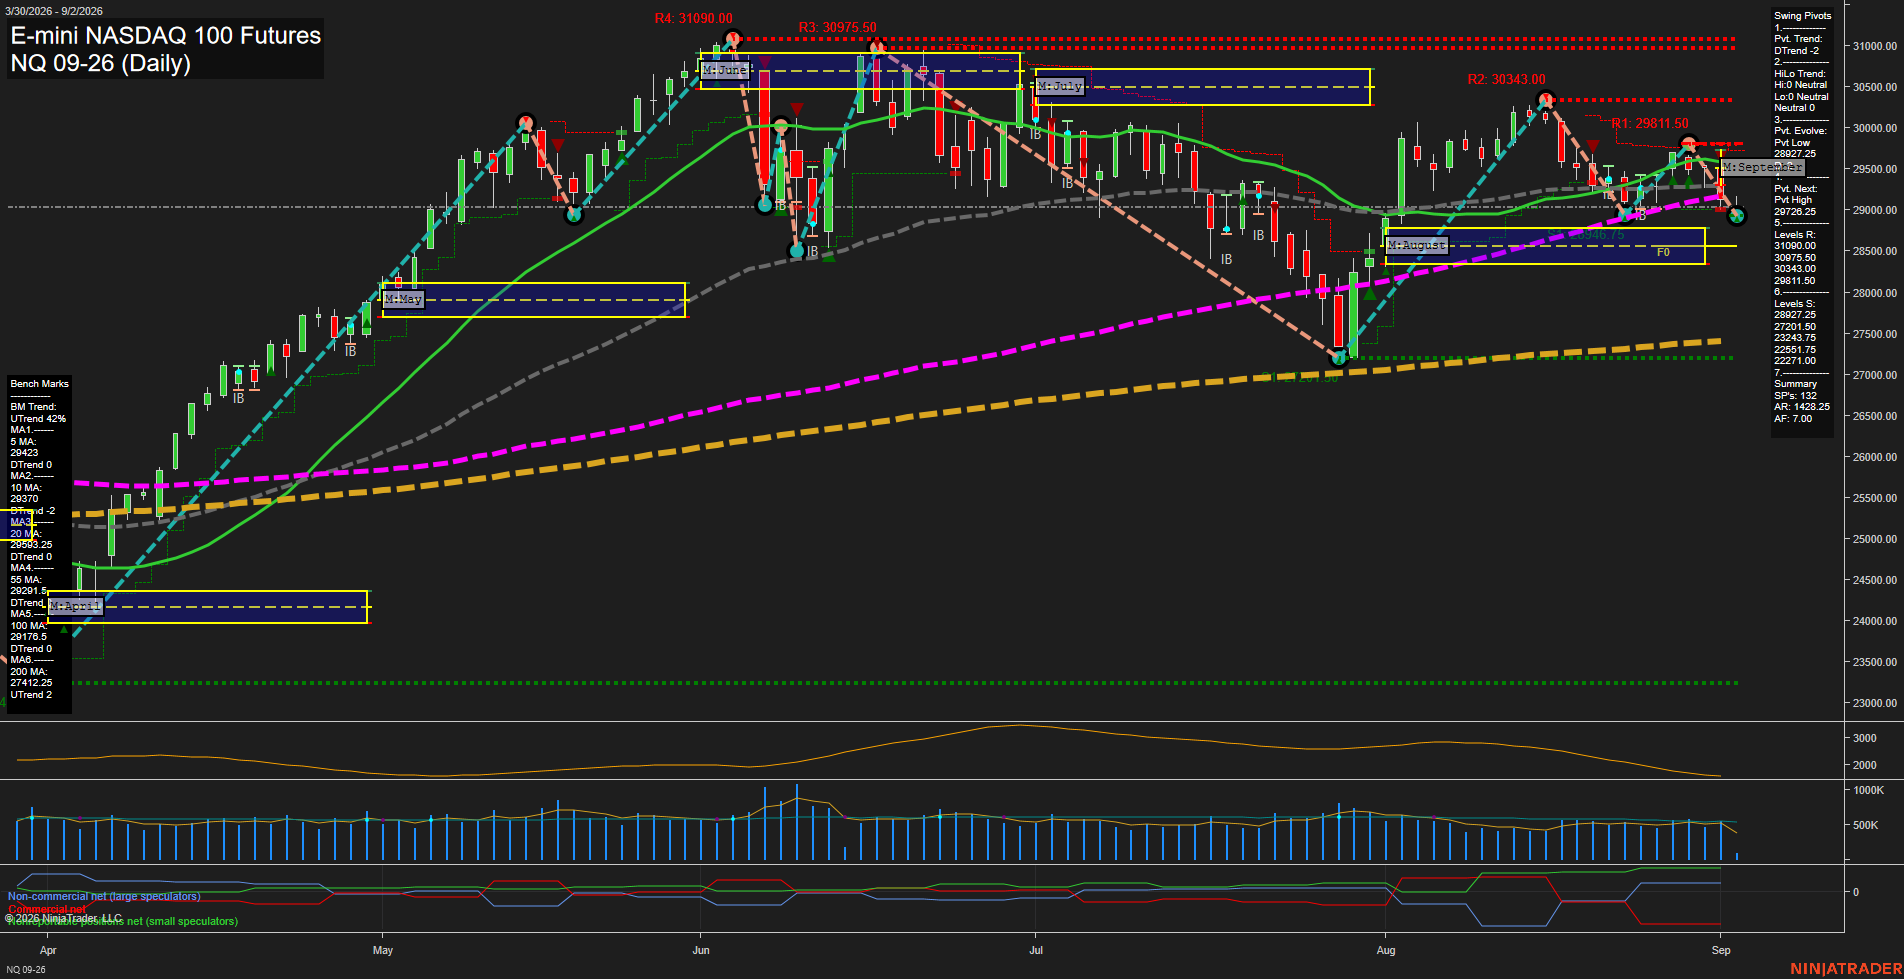
Overall Rating
- Short-Term: Bearish
- Intermediate-Term: Bearish
- Long-Term: Neutral.
Key Insights Summary
Price has rolled over from the late-August lower-high area near 29811.50 and is now pressing the 28927 pivot-support region. Short-term structure is bearish, with price below the 5-, 10-, 20-, 55-, and 100-day benchmarks and both weekly and monthly Fib-grid measures below their F0% zones. The 28926.25 evolving pivot low is the immediate structural reference, while 29276.25 is the next opposing pivot threshold. The broader yearly structure remains positive above the rising 200-day average, but the current daily swing is a volatile countertrend decline within that longer-term advance.
View charts on: AlphaWebTrader HTF Charts
CL Daily View
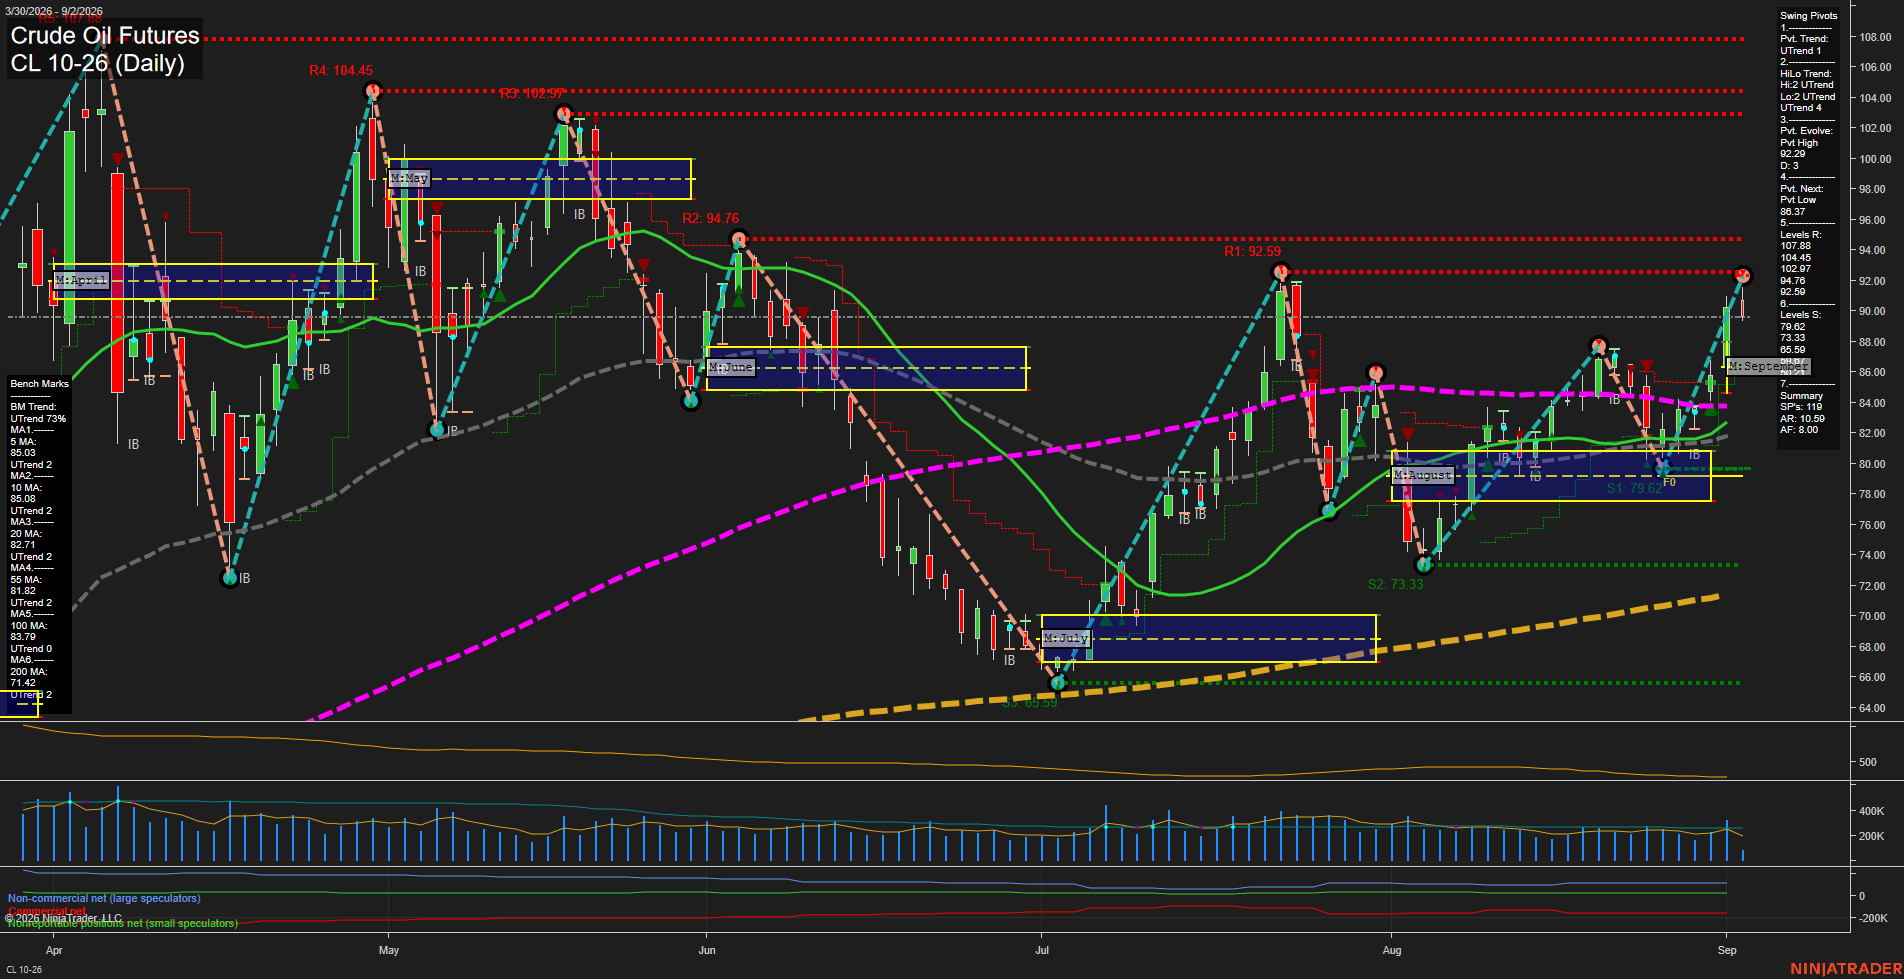
Overall Rating
- Short-Term: Bullish
- Intermediate-Term: Bullish
- Long-Term: Bullish.
Key Insights Summary
CL is in a broad multi-timeframe uptrend, with price accelerating from the August base near 79.62 and printing a fast, large-range advance into the 92.29 pivot high. Price is above all six rising benchmark averages, while weekly, monthly, and yearly fib-grid bias remains above F0%, confirming alignment across short-, intermediate-, and long-term structure. The immediate swing-pivot sequence is bullish, although 92.59 is the nearby resistance threshold and 94.76 is the next notable overhead pivot level. The 86.88 pivot-next level defines the current short-term reversal reference, while the 79.62 August-area support remains the larger breakout-base level. ATR and volume behavior reflect expanded volatility accompanying the rally, consistent with a strong directional repricing phase rather than a low-volatility consolidation.
View charts on: AlphaWebTrader HTF Charts
GC Daily View
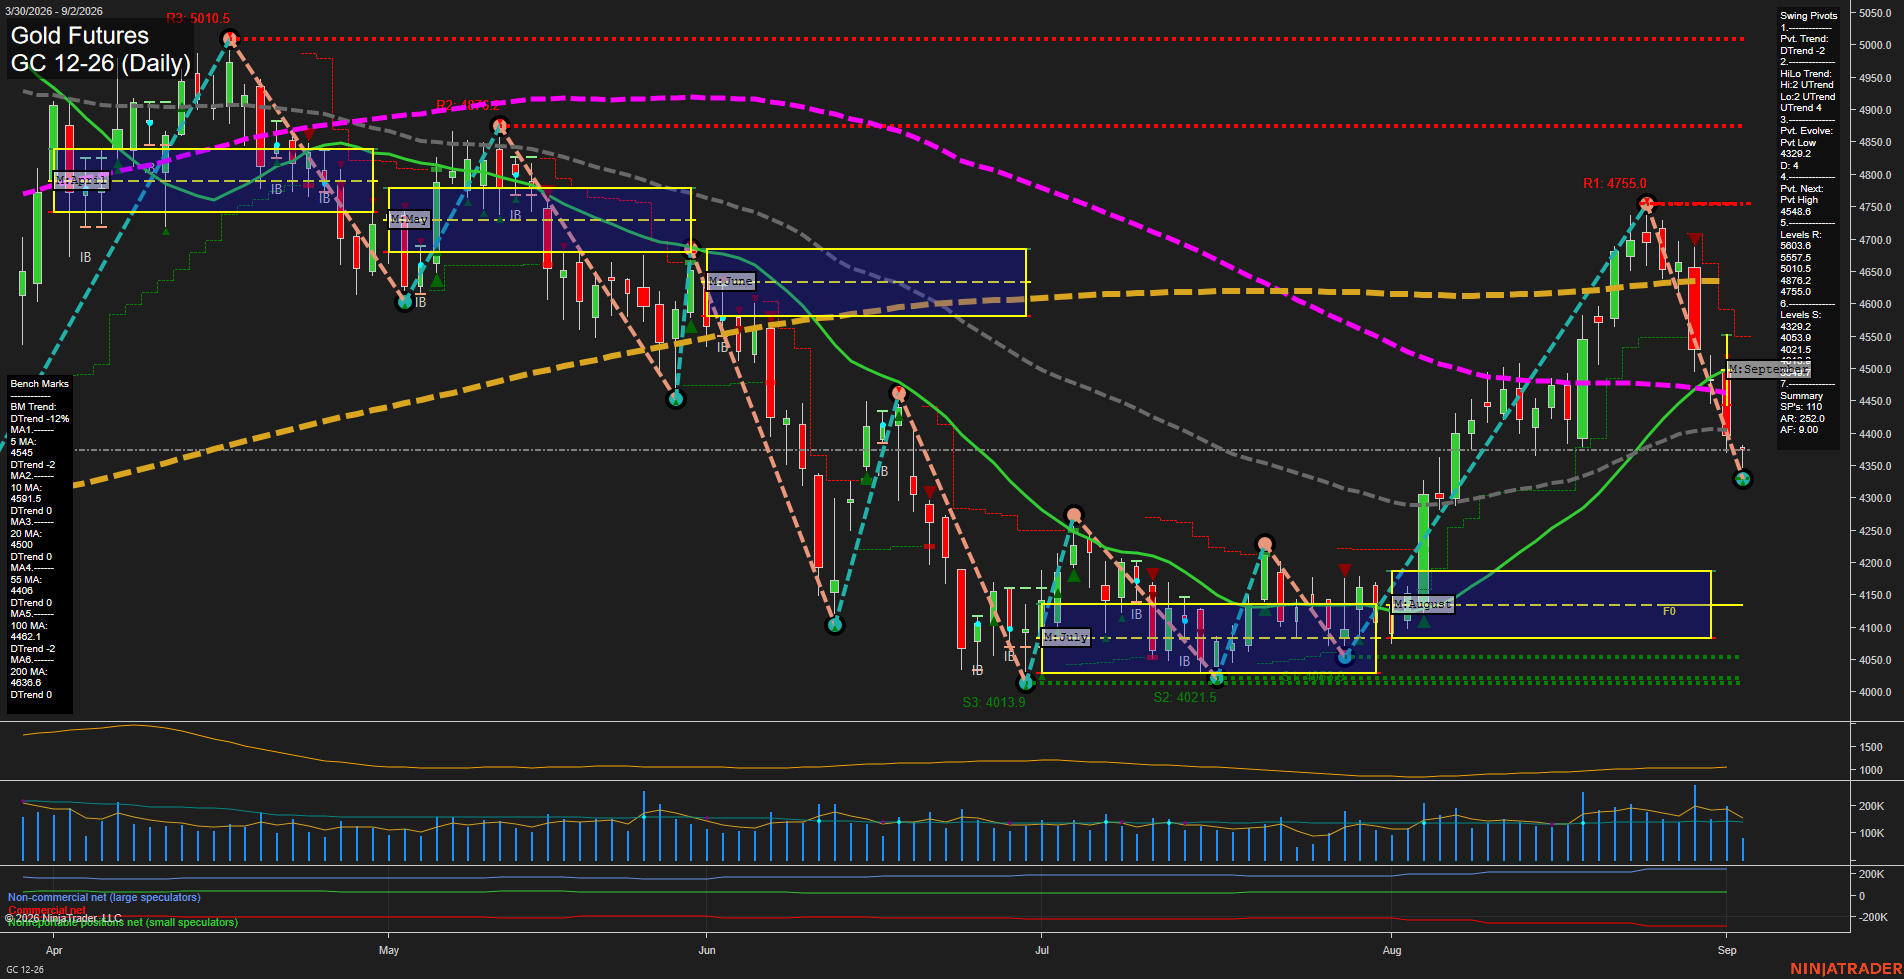
Overall Rating
- Short-Term: Bearish
- Intermediate-Term: Bearish
- Long-Term: Bearish.
Key Insights Summary
Gold futures show a fast, high-range reversal lower following rejection from the 4755.0 pivot resistance area. Price is below the weekly and monthly F0% levels and below every listed benchmark average, confirming broad downside alignment. The short-term pivot structure remains in DTrend, although the intermediate HiLo trend retains an UTrend designation from the prior advance. The 4329.2 pivot low is the nearest structural support, with 4033.9 to 4021.3 forming the deeper support zone. A recovery through 4568.6 would be required to establish the next opposing swing-high pivot, while 4755.0 remains the major nearby resistance reference.
View charts on: AlphaWebTrader HTF Charts