U.S. stocks rebounded as weak ADP hiring eased Treasury yields, while Iran tensions, rising oil, global bond yields and Fed uncertainty remained in focus.
Fundamentals: U.S. equities recovered from a three-day slide after weaker-than-expected private hiring data pushed Treasury yields lower, supporting major indexes. Oil held near recent highs as U.S.-Iran tensions raised supply concerns, while elevated global bond yields, inflation sensitivity and Fed-policy uncertainty remained key cross-currents. September seasonality and upcoming payroll data also stayed in focus.
Technicals: U.S. equities closed with mixed leadership as Nvidia, Meta and gold advanced, while Apple and Microsoft declined. Futures analysis across the S&P 500, Nasdaq, Dow, small caps and global benchmarks showed bearish short-term momentum and active pullbacks from recent highs. Longer-term trend measures generally remained constructive, with key support and pivot levels defining current volatility.
After Market Close daily snapshot: market news summary and sentiment, major ETFs, Magnificent 7 analysis, Indices Futures Higher Time Frame Analysis, and E-mini S&P500, Nasdaq 100, NYMEX Crude, Gold Futures Daily Chart analysis.
As of: September 2, 2026 05:00 CT
Market News Summary:
U.S. equities rebounded as Treasury yields eased after weak private hiring data, while oil and geopolitical tensions remained inflation-sensitive cross-currents.
Primary Drivers & Risks:
- Primary Driver: Easing Treasury yields after ADP miss
- Primary Risk: Iran escalation lifts oil and inflation
Tone:
Cautiously constructive, with elevated macro and energy risks.
Stock Market / ETFs / Indices:
Major U.S. indexes recovered from a three-day decline, with the Dow closing nearly 300 points higher as yields retreated from recent multiyear highs. September seasonality remained a negative backdrop, with the S&P 500 averaging a 1.4% September decline from 2017 through 2025. Company-specific pressure included Uber job cuts and post-earnings selling in Palo Alto Networks.
Geopolitical:
Fresh U.S.-Iran strikes and tensions around the Strait of Hormuz supported energy-market uncertainty. Canada’s retaliatory tariffs on about $20 billion of U.S. goods are set to take effect next week, adding a trade-policy cross-current.
Oil / Energy:
WTI stalled near $92 after crossing $90 amid Iran-related supply concerns. U.S. commercial crude inventories fell 4.5 million barrels, far exceeding the 300,000-barrel analyst estimate, while gasoline inventories also declined and distillate stocks rose.
Gold / Metals:
Gold reversed from $4,283 after buyers reclaimed support. Bullish gold commentary cited geopolitical uncertainty, central-bank diversification, de-dollarization concerns, inflation, and debt-related currency concerns; the Dutch central bank also moved 86 tonnes of gold holdings to London.
Fed / Financials:
ADP reported 38,000 private-sector jobs added in August, below the 47,000 consensus estimate and July’s revised 46,000 gain. The soft report eased yields and supported equities, but elevated crude prices and discussion of Fed hike odds kept inflation and policy focus active; the 10-year Treasury had briefly reached 4.8%.
Macro / Other:
Global sovereign yields remained elevated, with Japan’s 10-year yield reaching 3% and the U.K. 10-year gilt yield reaching 5.27%. AI infrastructure investment projections highlighted a longer-term capital-spending theme, while Bitcoin commentary focused on September volatility across equities and commodities.
Conclusion:
Lower Treasury yields following the weak ADP report supported the U.S. equity rebound. Oil’s advance on U.S.-Iran tensions remained the key opposing market force.
Higher energy prices, elevated global bond yields, and Fed-policy uncertainty maintained inflation-sensitive risk conditions. September’s weak historical equity seasonality and upcoming payroll data remained additional near-term cross-currents.
Market News Sentiment
Market News Articles: 38
- Neutral: 44.74%
- Negative: 34.21%
- Positive: 21.05%
Sentiment Summary: Among 38 market news articles, 45% were neutral, 34% negative, and 21% positive, indicating neutral coverage with a negative skew.
Conclusion: Indices futures day traders are facing a news backdrop with more negative than positive coverage.
GLD,Gold Articles: 11
- Positive: 45.45%
- Neutral: 36.36%
- Negative: 18.18%
Sentiment Summary: GLD/Gold coverage is 45% positive, 36% neutral, and 18% negative across 11 articles, indicating a moderately positive tone.
Conclusion: For indices futures day traders, gold-related news sentiment is positive-leaning with a substantial neutral share and limited negative coverage.
USO,Oil Articles: 15
- Neutral: 40.00%
- Negative: 33.33%
- Positive: 26.67%
Sentiment Summary: USO and oil coverage is mixed, with 40% neutral, 33% negative, and 27% positive articles.
Conclusion: The news tone is slightly cautious overall, as negative coverage exceeds positive coverage.
Market Data Snapshot
ETF Snapshot of major stock market ETFs, Mag7, and others as of: September 2, 2026 05:00
Top Movers & Losers
- NVDA 224.41 Bullish 3.21% ▲
- META 592.85 Bullish 2.47% ▲
- GLD 402.78 Bullish 1.52% ▲
- AMZN 254.98 Bullish 0.02% ▲
- AAPL 324.96 Bearish -0.05% ▼
- MSFT 496.82 Bearish -0.84% ▼
Major Index ETFs: SPY, QQQ, DIA, IWM, IJH
- IWM 294.01 Bullish 1.18% ▲
- IJH 75.11 Bullish 0.68% ▲
- DIA 530.62 Bullish 0.54% ▲
- SPY 765.16 Bullish 0.44% ▲
- QQQ 709.24 Bullish 0.23% ▲
Major index ETFs were Bullish across the group: IWM led with +1.18%, followed by IJH at +0.68%, DIA at +0.54%, SPY at +0.44%, and QQQ at +0.23%. IWM was the most bullish mover, while QQQ was the least positive mover, indicating stronger participation in smaller and mid-cap equities than large-cap technology.
Mag 7 Stocks: AAPL, MSFT, GOOG, AMZN, META, NVDA, TSLA
- NVDA 224.41 Bullish 3.21% ▲
- META 592.85 Bullish 2.47% ▲
- GOOG 333.78 Bullish 0.53% ▲
- TSLA 357.01 Bullish 0.26% ▲
- AMZN 254.98 Bullish 0.02% ▲
- AAPL 324.96 Bearish -0.05% ▼
- MSFT 496.82 Bearish -0.84% ▼
Mixed Mag7 snapshot: NVDA is the most bullish mover at +3.21%, followed by META at +2.47%. GOOG gained +0.53%, while TSLA at +0.26% and AMZN at +0.02% were more marginal. MSFT is the most bearish mover at -0.84%; AAPL was near-flat bearish at -0.05%.
Cross-Market ETFs: TLT, GLD, USO, IBIT
- GLD 402.78 Bullish 1.52% ▲
- USO 141.15 Bullish 0.11% ▲
- TLT 81.95 Bullish 0.10% ▲
- IBIT 43.79 Bullish 0.07% ▲
Other ETFs were Bullish overall: GLD led as the most bullish mover at +1.52%, while USO was the least positive mover at +0.11%. TLT at +0.10% and IBIT at +0.07% were marginal to near-flat.
ETF, Mag7, and Cross-Market ETF Insights
Overall Tone
Mixed, with broadly Bullish equity ETFs and selective Mag7 leadership alongside a Bearish MSFT move.
Equity ETFs and Mag7:
Major Index ETFs were broadly Bullish: IWM led at +1.18%, followed by IJH at +0.68%, DIA at +0.54%, SPY at +0.44%, and QQQ at a marginal +0.23%. Mag7 performance was selective, led by NVDA at +3.21% and META at +2.47%, while MSFT was the most Bearish mover at -0.84%; AAPL was near-flat Bearish at -0.05%. Across all equity ETFs and Mag7, NVDA was the most bullish mover and MSFT was the most bearish mover.
Cross-Market ETFs:
Cross-market ETFs were uniformly Bullish but mostly marginal outside GLD, which led at +1.52%. USO gained a near-flat +0.11%, TLT added a marginal +0.10%, and IBIT was the least positive mover at +0.07%. GLD strength stood out versus the modest gains in TLT, USO, and IBIT.
Futures Indices – Higher Time Frame Analysis
Summary of the current state of US Indices Futures based on higher time-frame (HTF) technical analysis as of: 2026-09-02: 17:00 CT.
US Indices Futures
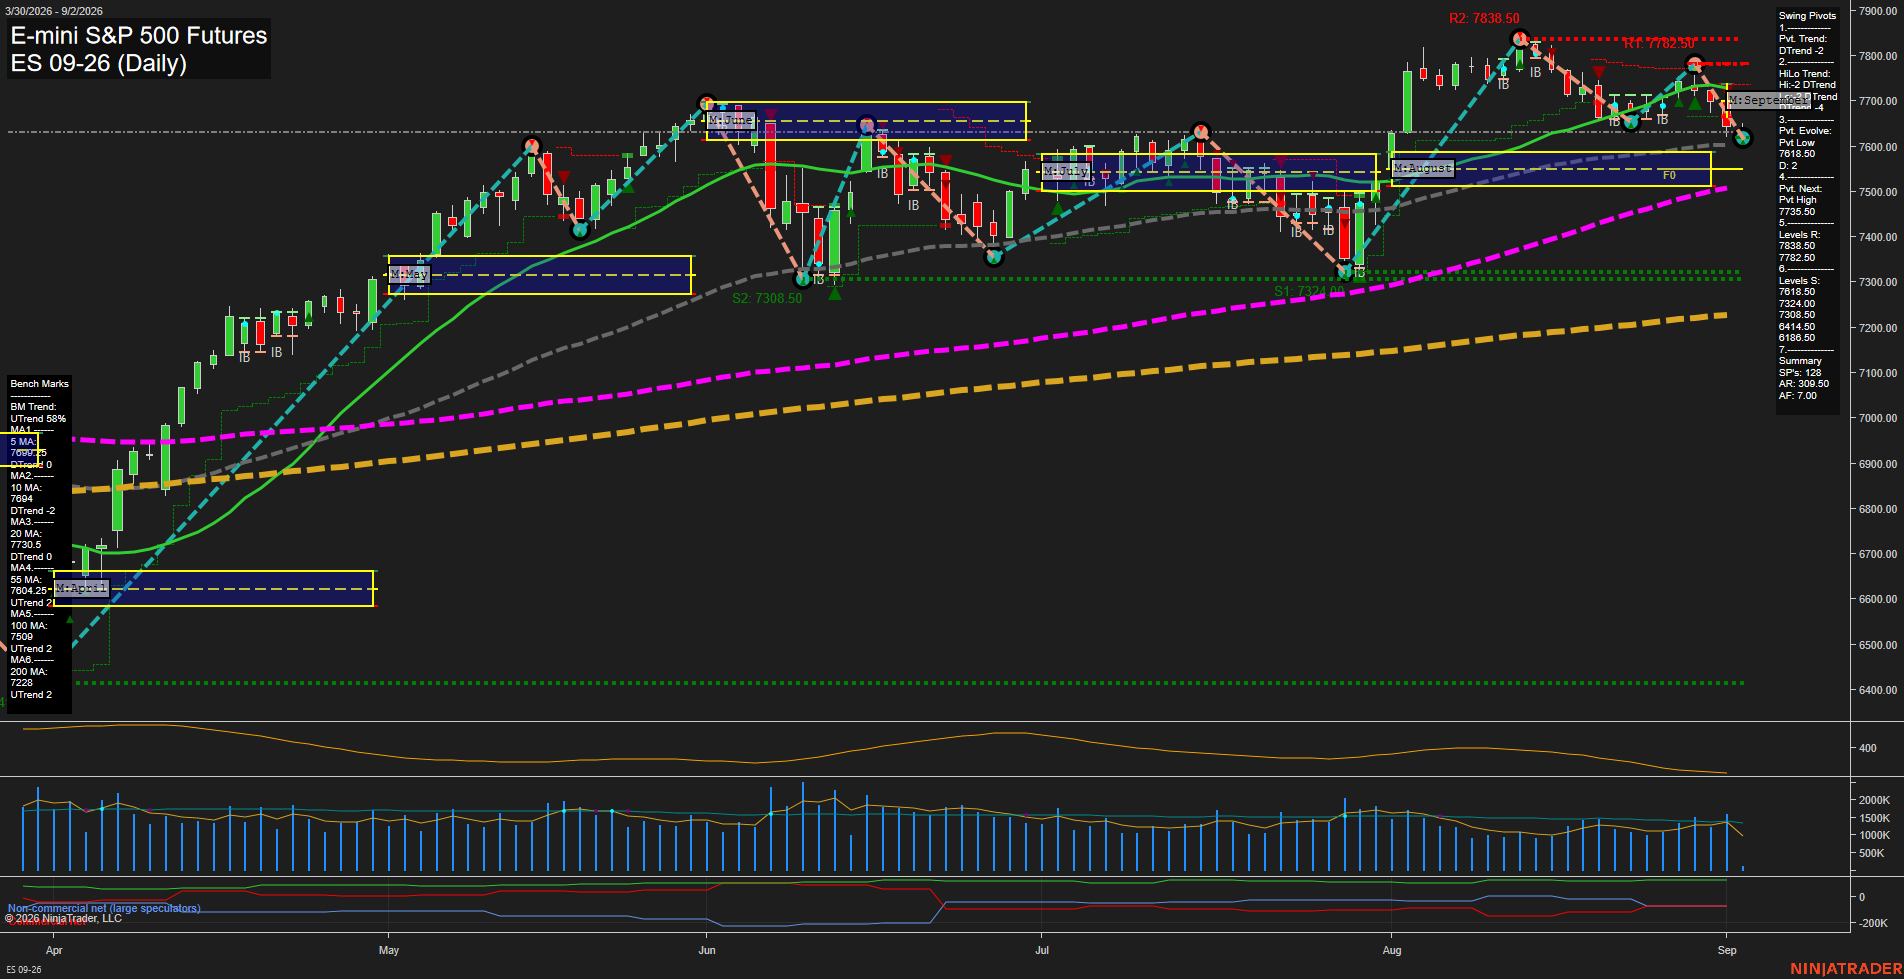
- ES YSFG above F0%, MSFG/WSFG below F0%, 7618.50 support, 7735.50 reversal, 7838.50 resistance; short bearish, intermediate neutral, long bullish.
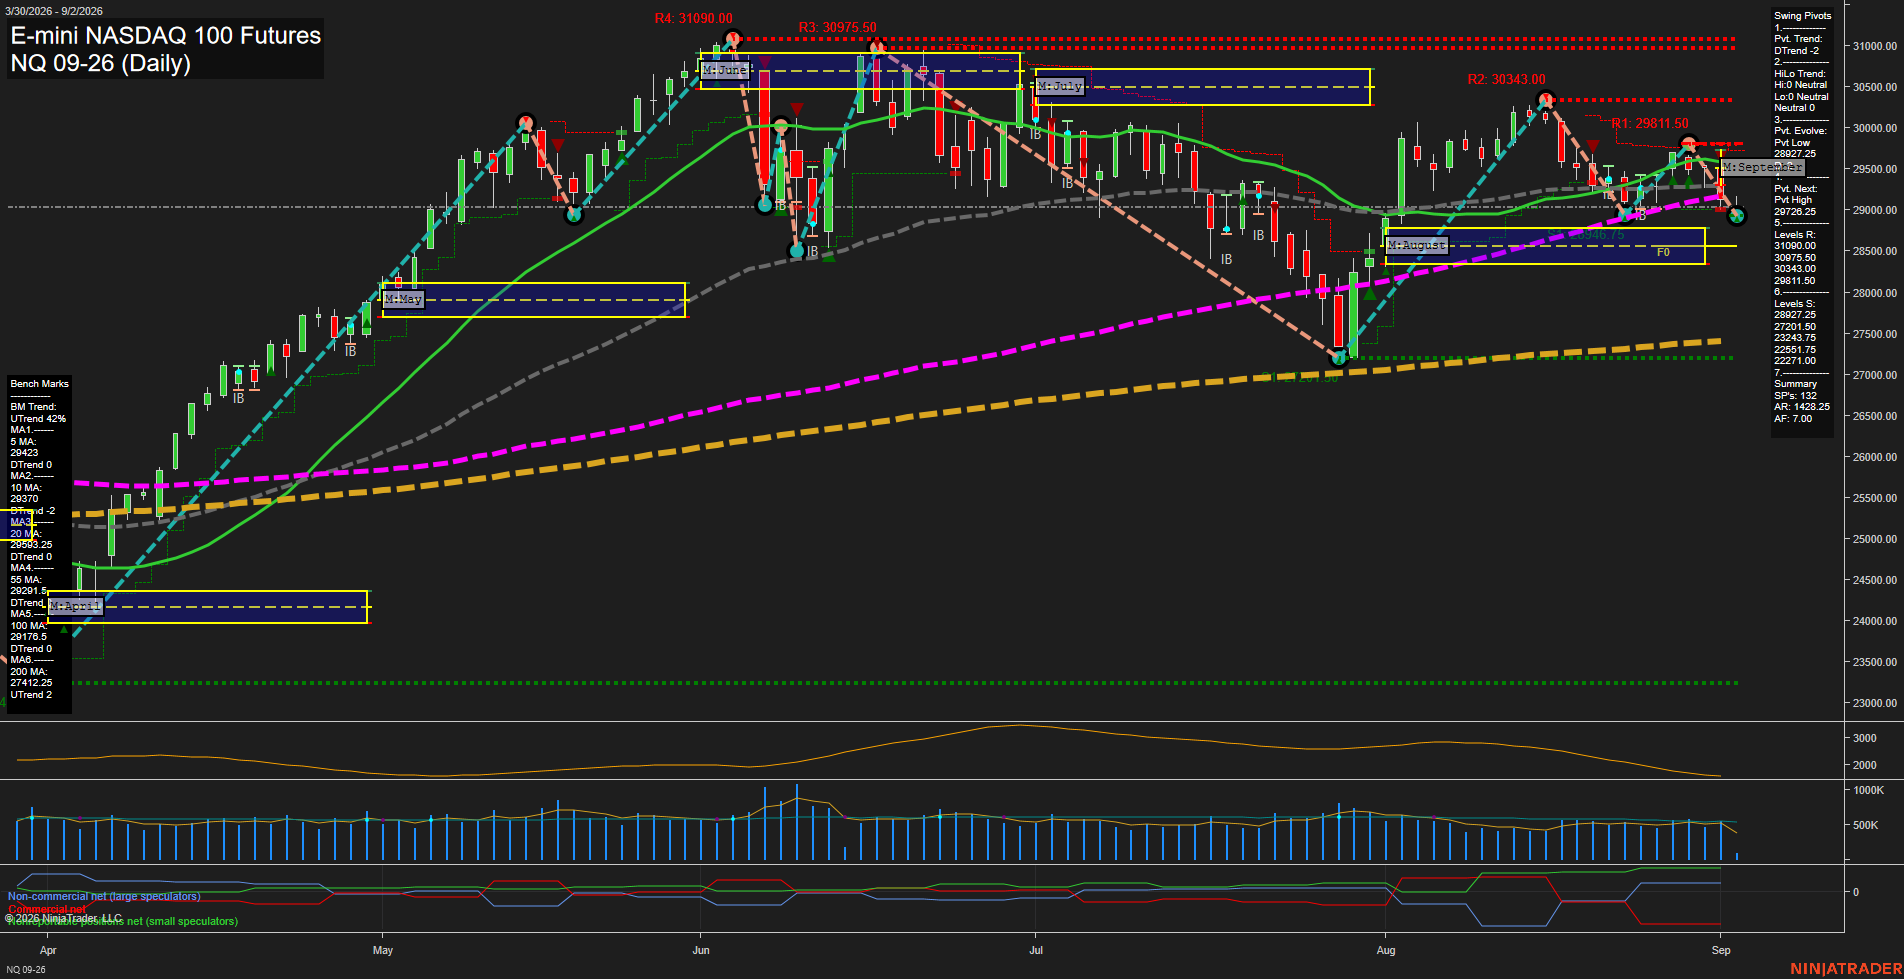
- NQ YSFG constructive, MSFG/WSFG below F0%, 28926.25 support, 29276.25 reversal, 30343-30390 resistance; short/intermediate bearish, long bullish.
- YM YSFG above F0%, MSFG/WSFG below F0%, 52720 support, 52494 pivot reference, 53862-54884 resistance; short bearish, intermediate neutral, long bullish.
- EMD YSFG above F0%, MSFG/WSFG below F0%, 3714.1 support, then 3692.9 and 3589.2; 3941.7 resistance; short/intermediate bearish, long bullish.
- RTY YSFG above F0%, MSFG/WSFG below F0%, 2914.5-2902.3 support, 2828.1 lower support, 3079.9 resistance; short/intermediate bearish, long bullish.
- FDAX YSFG above F0%, MSFG/WSFG below F0%, 25759 support, 26207 reversal, 26662-26865 resistance; short bearish, intermediate neutral-to-bearish, long bullish.
Overall State
- Short-Term: Bearish
- Intermediate-Term: Bearish
- Long-Term: Bullish
Conclusion
All six contracts show correlated short-term retracements from recent pivot highs, with MSFG and WSFG readings generally below F0% and price below key short-term benchmarks. ES, YM, and FDAX retain neutral intermediate weekly structures, while NQ, EMD, and RTY are intermediate bearish. YSFG positions and rising longer-term benchmarks maintain bullish long-term structure across the group. Current pivot supports define the active downside swing references; recent pivot highs remain overhead resistance.
Note: Intra-day counter-trend pullbacks or retracements may occur, HTF is context for informational usage and market structure. Glossary: Session Fib Grids periods of YSFG:’Yearly’, MSFG:’Monthly’, WSFG:’Weekly’
For full details visit: AlphaWebTrader Technicals
ES Daily View
Overall Rating
- Short-Term: Bearish
- Intermediate-Term: Bearish
- Long-Term: Bullish.
Key Insights Summary
Price is in a short-term downswing after rejection from the August 7838.50 pivot high, with lower highs and a new evolving pivot low at 7618.50 defining the current corrective structure. Weekly and monthly Fib-grid readings remain below their respective F0% levels, while price is also beneath the declining 5-, 10-, and 20-day benchmarks. The 55-, 100-, and 200-day averages remain positively aligned beneath price, preserving the larger 2026 uptrend despite the near-term September pullback. The 7618.50 support and 7735.50 pivot-reversal level frame the immediate swing range, while elevated ATR reflects broad daily movement and a volatile consolidation environment.
View charts on: AlphaWebTrader HTF Charts
NQ Daily View
Overall Rating
- Short-Term: Bearish
- Intermediate-Term: Bearish
- Long-Term: Neutral.
Key Insights Summary
Price has rolled over from the late-August lower-high area near 29811.50 and is now pressing the 28927 pivot-support region. Short-term structure is bearish, with price below the 5-, 10-, 20-, 55-, and 100-day benchmarks and both weekly and monthly Fib-grid measures below their F0% zones. The 28926.25 evolving pivot low is the immediate structural reference, while 29276.25 is the next opposing pivot threshold. The broader yearly structure remains positive above the rising 200-day average, but the current daily swing is a volatile countertrend decline within that longer-term advance.
View charts on: AlphaWebTrader HTF Charts
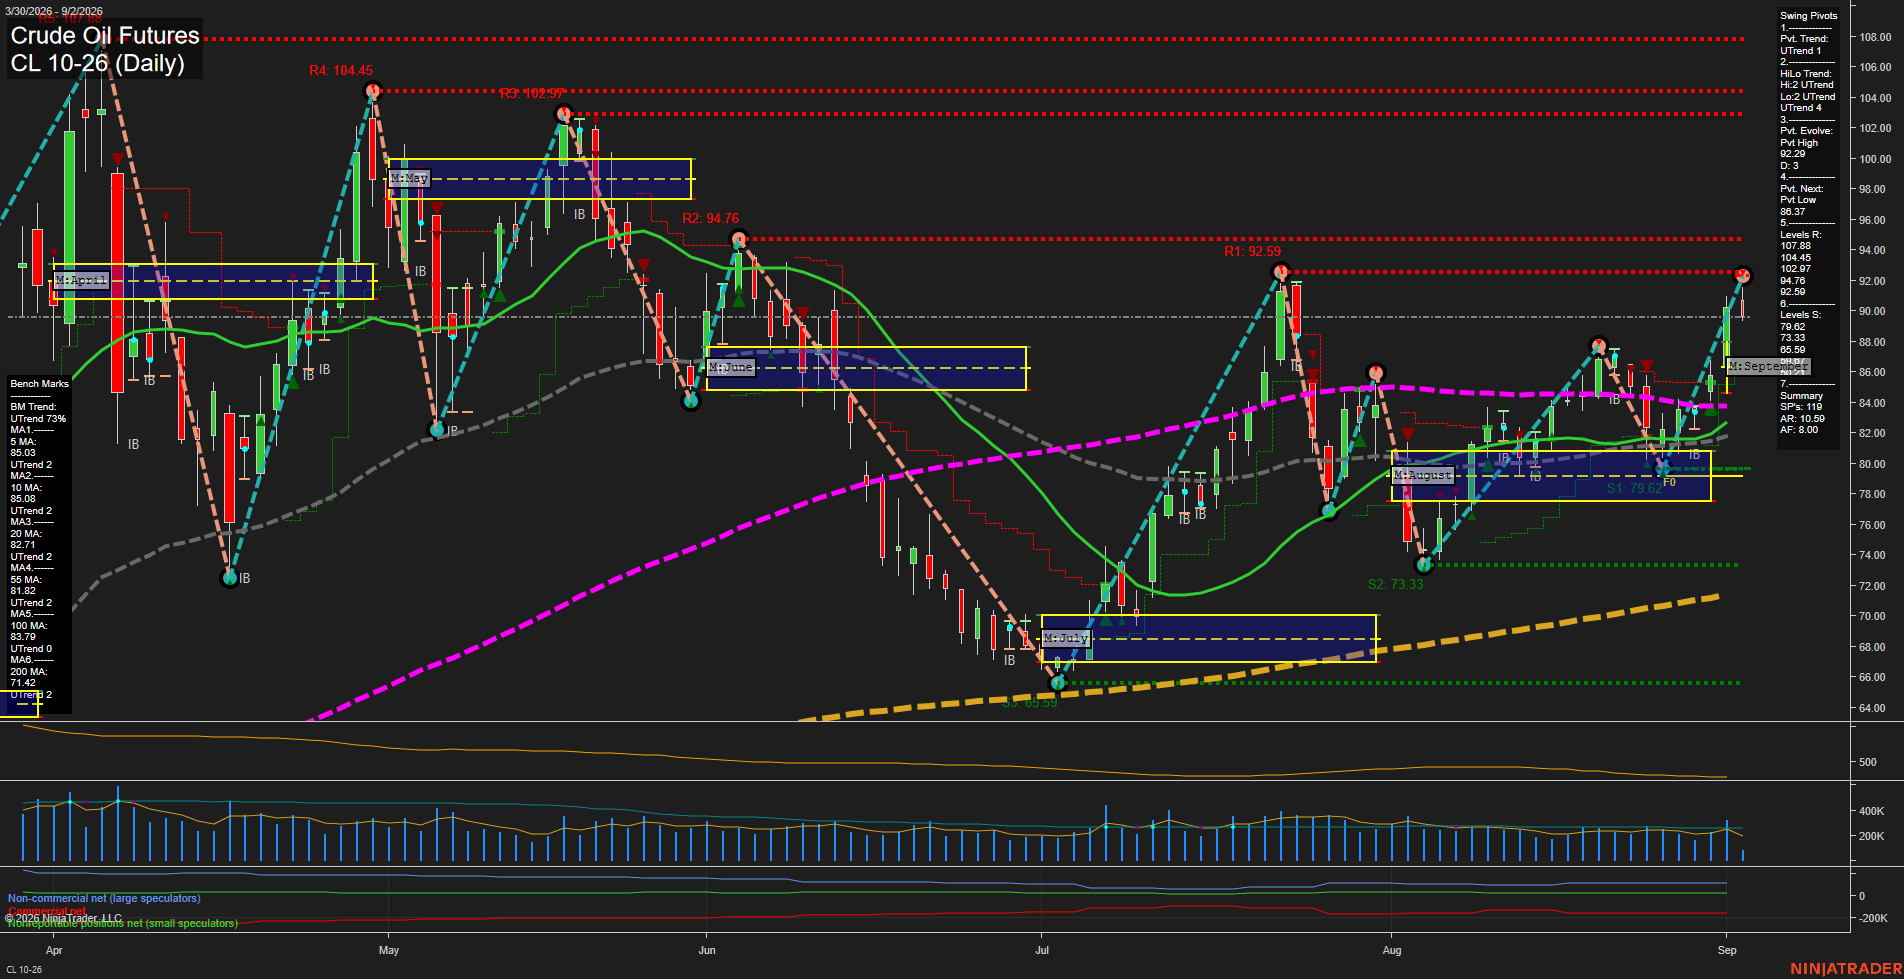
CL Daily View
Overall Rating
- Short-Term: Bullish
- Intermediate-Term: Bullish
- Long-Term: Bullish.
Key Insights Summary
CL is in a broad multi-timeframe uptrend, with price accelerating from the August base near 79.62 and printing a fast, large-range advance into the 92.29 pivot high. Price is above all six rising benchmark averages, while weekly, monthly, and yearly fib-grid bias remains above F0%, confirming alignment across short-, intermediate-, and long-term structure. The immediate swing-pivot sequence is bullish, although 92.59 is the nearby resistance threshold and 94.76 is the next notable overhead pivot level. The 86.88 pivot-next level defines the current short-term reversal reference, while the 79.62 August-area support remains the larger breakout-base level. ATR and volume behavior reflect expanded volatility accompanying the rally, consistent with a strong directional repricing phase rather than a low-volatility consolidation.
View charts on: AlphaWebTrader HTF Charts
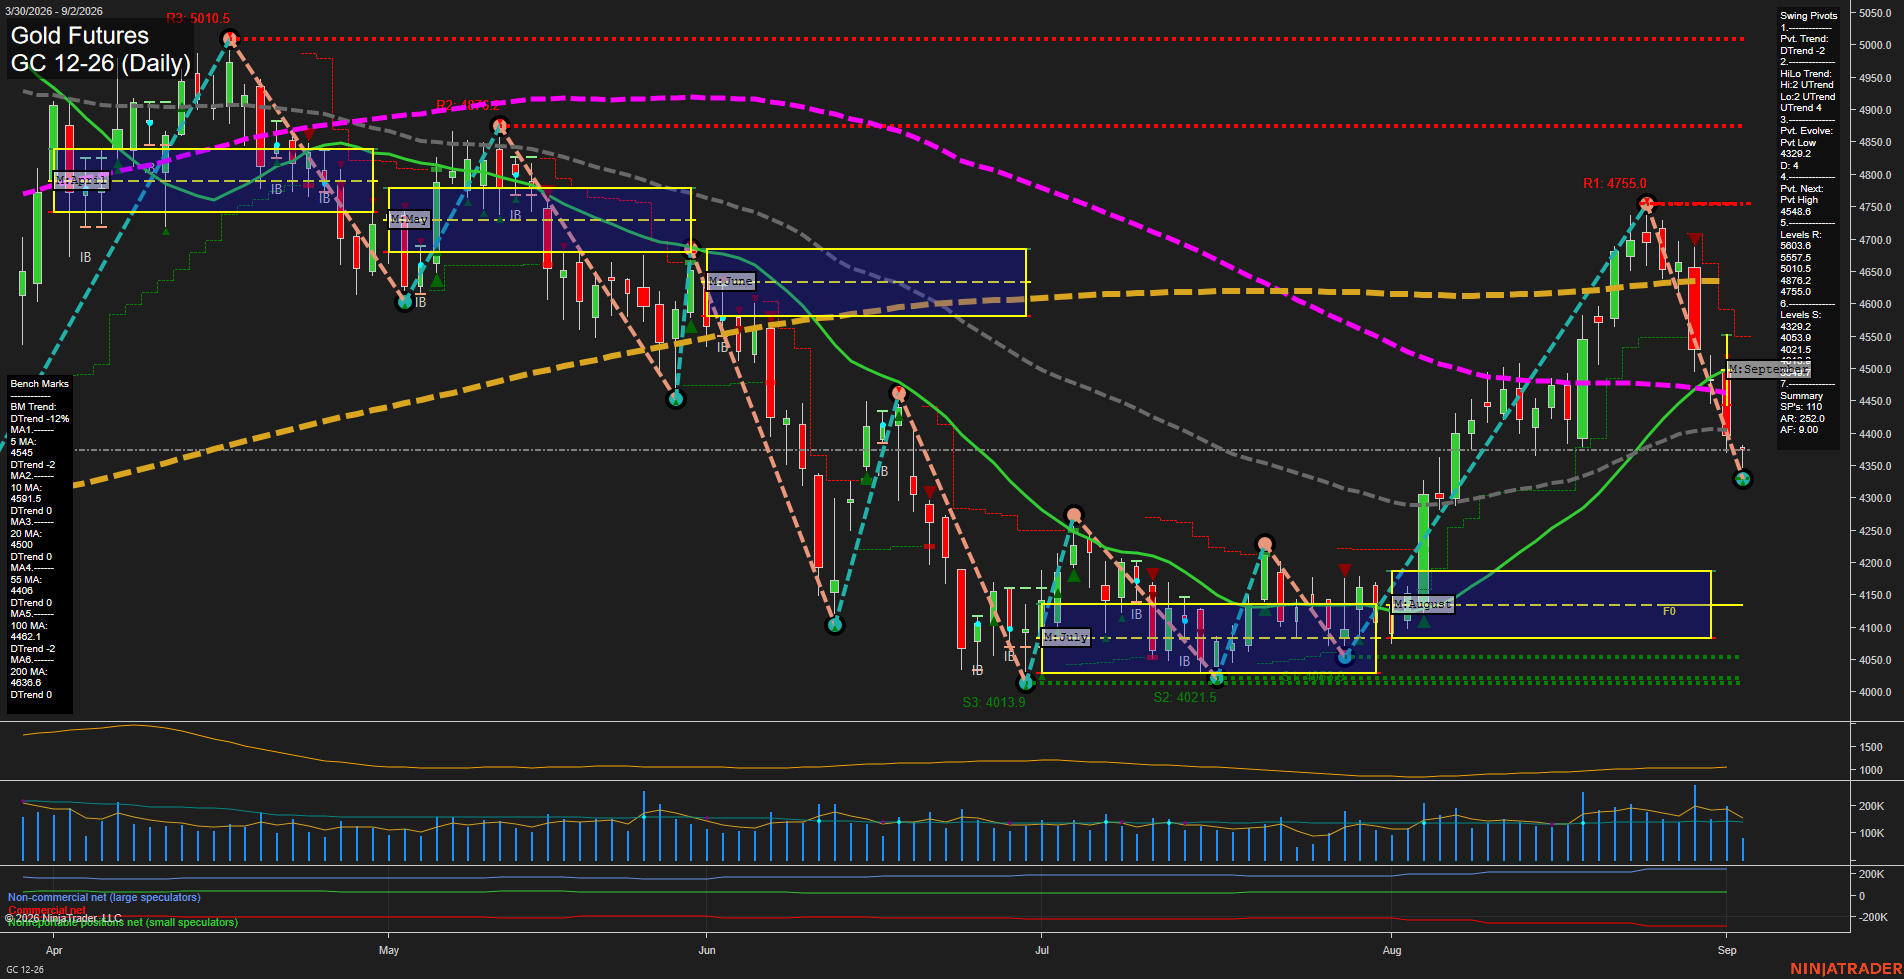
GC Daily View
Overall Rating
- Short-Term: Bearish
- Intermediate-Term: Bearish
- Long-Term: Bearish.
Key Insights Summary
Gold futures show a fast, high-range reversal lower following rejection from the 4755.0 pivot resistance area. Price is below the weekly and monthly F0% levels and below every listed benchmark average, confirming broad downside alignment. The short-term pivot structure remains in DTrend, although the intermediate HiLo trend retains an UTrend designation from the prior advance. The 4329.2 pivot low is the nearest structural support, with 4033.9 to 4021.3 forming the deeper support zone. A recovery through 4568.6 would be required to establish the next opposing swing-high pivot, while 4755.0 remains the major nearby resistance reference.
View charts on: AlphaWebTrader HTF Charts