NYSE pre-market futures review covers prior ETF leaders, bearish short-term technicals, Middle East risks, Treasury yields, oil, gold and labor data.
Fundamentals: U.S. index futures were mixed as investors weighed renewed Middle East tensions, energy-supply risks and elevated Treasury yields ahead of U.S. labor data. Oil eased after a recent advance, while gold rebounded as softer jobs data reduced yields. Weak S&P 500 breadth contrasted with selective technology and semiconductor demand, while the Fed’s Beige Book noted uneven consumer spending.
Technicals: Prior-session leaders included NVDA, META and GLD, while MSFT posted the largest decline among the listed instruments. Futures technical readings show bearish short- and intermediate-term conditions across ES, NQ, YM, EMD, RTY and FDAX after recent pullbacks. Longer-term trend measures remain bullish, with key support and resistance levels framing the current consolidation.
Pre-Market Trading 360° view Market Radar of: holidays, earnings, eco-news, market-news summary, news sentiment, prior session major ETFs, MAG7, Higher Time Frame Analysis Indices Futures Summary, and E-mini S&P500, Nasdaq 100, NYMEX Crude, Gold Futures Daily Chart analysis.
As of: September 3, 2026 07:16 CT
Holiday Radar
- 2026-09-07 Labor Day
EcoNews Radar U.S. Events
| Day | Time | Impact | Event |
|---|---|---|---|
| Thu | 08:30 | Medium | Unemployment Claims |
| Thu | 10:00 | Medium | ISM Services PMI |
| Fri | 08:30 | High | Average Hourly Earnings m/m |
| Fri | 08:30 | High | Non-Farm Employment Change |
| Fri | 08:30 | High | Unemployment Rate |
EcoNews Summary
Friday’s 08:30 USD labor-market releases are the listed high-impact focus for index futures. The reports provide a combined view of job growth, wage growth, and unemployment conditions, shaping inflation and economic-growth context at the release time.
Event Notes:
- Friday 08:30 – USD Average Hourly Pay m/m: Measures the monthly change in average hourly worker pay. Traders monitor it as an indicator of wage-pressure trends and inflation conditions.
- Friday 08:30 – USD Non-Farm Employment Change: Measures the monthly change in employment outside the farming sector. Traders monitor it as a broad gauge of labor-market strength and economic activity.
- Friday 08:30 – USD Unemployment Rate: Measures the percentage of the labor force that is unemployed and seeking work. Traders monitor it for labor-market slack and household-income conditions.
Conclusion:
The single most important listed event is Friday’s 08:30 USD Non-Farm Employment Change, released alongside wage and unemployment data. Market momentum and volume often slow ahead of major labor-market releases, with increased volatility at the 08:30 release time.
For full details visit: Forex Factory EcoNews
Market News Summary:
Index futures face mixed signals from geopolitical stress, elevated bond yields, narrow equity leadership, and upcoming U.S. labor data.
Primary Drivers & Risks:
- Primary Driver: Middle East tensions and bond yields
- Primary Risk: Energy-supply disruption and weak breadth
Tone:
Cautious and cross-current driven.
Stock Market / ETFs / Indices:
U.S. futures were slightly mixed as markets absorbed Middle East developments and labor-data focus. Recent equity trading showed a rebound after a three-day slide, but S&P 500 breadth weakened, with the 10-day advance/decline line near oversold territory. Technology demand remained selective, with investors favoring lower-valuation AI exposure over high-multiple names.
Geopolitical:
Renewed U.S.-Iran military tensions and concerns surrounding the Strait of Hormuz increased focus on Middle East supply disruption. The Dutch central bank transferred about 86 tons of gold from North America to London, citing geopolitical unrest and crisis preparedness.
Oil / Energy:
Oil edged lower after a recent advance and amid a technical pullback, while U.S.-Iran tensions continued to underpin supply-risk concerns. The Venezuela oil arrangement highlighted long-term supply and Strategic Petroleum Reserve replenishment themes, though execution and near-term gasoline-price effects remained uncertain.
Gold / Metals:
Gold rebounded from $4,300 as softer U.S. jobs data eased Treasury yields, though prices had also fallen ahead of further labor data. Gold sentiment remained supported by debt, inflation, currency, and geopolitical concerns; platinum-sector earnings also benefited from higher precious-metal prices.
Fed / Financials:
The Fed Beige Book showed slight overall consumer-spending growth, with stronger spending at the high end alongside broader consumer strain. Bond yields remained under pressure from war, fiscal concerns, Federal Reserve leadership uncertainty, and AI-related bond issuance; the VIX remained just above 15 despite bond-market stress.
Macro / Other:
South Korean semiconductor exports tripled year over year in August, underscoring strong chip demand but also raising concern over an abrupt slowdown. ETF investors added $180 billion in net inflows during August, with barbell positioning reflecting macro-risk awareness.
Conclusion:
Middle East developments, oil-market reactions, and Treasury yields are central near-term inputs for index futures. Labor-market data and associated Federal Reserve rate expectations remain important market catalysts.
Weak S&P 500 breadth contrasts with selective technology and semiconductor strength. Gold demand, geopolitical reserve positioning, and restrained volatility readings highlight ongoing defensive cross-currents.
Market News Sentiment
Market News Articles: 30
- Neutral: 46.67%
- Positive: 26.67%
- Negative: 26.67%
Sentiment Summary: Market news sentiment is neutral overall, with 47% neutral articles and evenly split positive and negative coverage at 27% each.
Conclusion: Indices futures headlines show balanced directional tone, with neutral reporting representing the largest share.
GLD,Gold Articles: 15
- Positive: 46.67%
- Neutral: 40.00%
- Negative: 13.33%
Sentiment Summary: GLD/Gold coverage is moderately positive, with 47% positive, 40% neutral, and 13% negative articles.
Conclusion: Gold-related sentiment is positive overall, while neutral coverage remains substantial.
USO,Oil Articles: 8
- Negative: 50.00%
- Neutral: 25.00%
- Positive: 25.00%
Sentiment Summary: USO/Oil coverage is mixed but tilted negative, with 50% negative, 25% neutral, and 25% positive articles.
Conclusion: For indices futures day traders, oil-related news tone is predominantly negative, while half of coverage remains neutral or positive.
Market Data Snapshot
ETF Snapshot of major stock market ETFs, Mag7, and others as of: September 3, 2026 07:16
Top Movers & Losers
- NVDA 224.41 Bullish 3.21% ▲
- META 592.85 Bullish 2.47% ▲
- GLD 402.78 Bullish 1.52% ▲
- AMZN 254.98 Bullish 0.02% ▲
- AAPL 324.96 Bearish -0.05% ▼
- MSFT 496.82 Bearish -0.84% ▼
Major Index ETFs: SPY, QQQ, DIA, IWM, IJH
- IWM 294.01 Bullish 1.18% ▲
- IJH 75.11 Bullish 0.68% ▲
- DIA 530.62 Bullish 0.54% ▲
- SPY 765.16 Bullish 0.44% ▲
- QQQ 709.24 Bullish 0.23% ▲
Major index ETFs are Bullish across the group. IWM leads as the most bullish mover at +1.18%, followed by IJH at +0.68%, DIA at +0.54%, and SPY at +0.44%. QQQ is the least positive mover at +0.23%.
Mag 7 Stocks: AAPL, MSFT, GOOG, AMZN, META, NVDA, TSLA
- NVDA 224.41 Bullish 3.21% ▲
- META 592.85 Bullish 2.47% ▲
- GOOG 333.78 Bullish 0.53% ▲
- TSLA 357.01 Bullish 0.26% ▲
- AMZN 254.98 Bullish 0.02% ▲
- AAPL 324.96 Bearish -0.05% ▼
- MSFT 496.82 Bearish -0.84% ▼
Mixed Mag7 context: NVDA is the most bullish mover at +3.21%, followed by META at +2.47%. GOOG is Bullish at +0.53%, while TSLA at +0.26% and AMZN at a marginal +0.02% are modestly Bullish. MSFT is the most bearish mover at -0.84%; AAPL is near-flat Bearish at -0.05%.
Cross-Market ETFs: TLT, GLD, USO, IBIT
- GLD 402.78 Bullish 1.52% ▲
- USO 141.15 Bullish 0.11% ▲
- TLT 81.95 Bullish 0.10% ▲
- IBIT 43.79 Bullish 0.07% ▲
Other ETFs are Bullish: GLD is the most bullish mover at +1.52%, while USO is the least positive mover at +0.11%. TLT at +0.10% and IBIT at +0.07% are marginal to near-flat.
ETF, Mag7, and Cross-Market ETF Insights
Overall Tone
Mixed: equity ETFs are broadly Bullish while Mag7 leadership is selective, and cross-market ETFs are modestly Bullish with strength in gold.
Equity ETFs and Mag7:
Major Index ETFs are broadly Bullish, led by IWM at +1.18%, followed by IJH at +0.68%, DIA at +0.54%, SPY at +0.44%, and QQQ at +0.23%. Mag7 performance is selective: NVDA is the most bullish mover at +3.21% and META follows at +2.47%, while MSFT is the most bearish mover at -0.84% and AAPL is marginally Bearish at -0.05%. GOOG +0.53%, TSLA +0.26%, and near-flat AMZN +0.02% remain Bullish.
Cross-Market ETFs:
Cross-market ETFs are Bullish but uneven, with GLD the most bullish mover at +1.52%, exceeding the gains across equity index ETFs. USO at +0.11%, TLT at +0.10%, and IBIT at +0.07% are marginally Bullish, with IBIT the least positive mover. Gold strength stands apart from the near-flat moves in bonds, oil, and bitcoin exposure.
Futures Indices – Higher Time Frame Analysis
Summary of the current state of US Indices Futures based on higher time-frame (HTF) technical analysis as of: 2026-09-03: 07:16 CT.
US Indices Futures
- ES: YSFG above F0%, MSFG/WSFG below F0%, declining short benchmarks, rising 55/100/200-day, resistance 7732.50-7838.50, support 7618.50.
- NQ: YSFG above F0%, MSFG/WSFG below F0%, DTrend, declining 5-100-day benchmarks, resistance 29292.75-29577.75, support 28927.25.
- YM: YSFG above F0%, MSFG/WSFG below F0%, bearish daily pivots, rising 55/100/200-day benchmarks, resistance 53614-53862, support 52720.
- EMD: YSFG above F0%, MSFG/WSFG below F0%, short-term DTrend, below 20/55-day benchmarks, resistance 3796.4, support 3713.8.
- RTY: YSFG above F0%, MSFG/WSFG below F0%, daily DTrend, below 5-55-day benchmarks, resistance 2982.3 and 3079.9, support 2914.5-2902.3.
- FDAX: YSFG above F0%, MSFG/WSFG below F0%, bearish daily structure, declining 5/10/20-day benchmarks, resistance 26207-26665, support 25759-25790.
Overall State
- Short-Term: Bearish
- Intermediate-Term: Bearish
- Long-Term: Bullish
Conclusion
US index futures show aligned short-term weakness, with daily structures generally in DTrend and WSFG/MSFG readings below F0% references. ES, YM, EMD, RTY, and FDAX retain rising longer-term benchmark structures; NQ remains above its yearly grid with a rising 200-period benchmark. Recent pivot highs define overhead resistance, while stated swing-low levels are the principal structural supports. The shared pattern is a short- to intermediate-term retracement within broader yearly higher-high, higher-low structures.
Note: Intra-day counter-trend pullbacks or retracements may occur, HTF is context for informational usage and market structure. Glossary: Session Fib Grids periods of YSFG:’Yearly’, MSFG:’Monthly’, WSFG:’Weekly’
For full details visit: AlphaWebTrader Technicals
ES Daily View
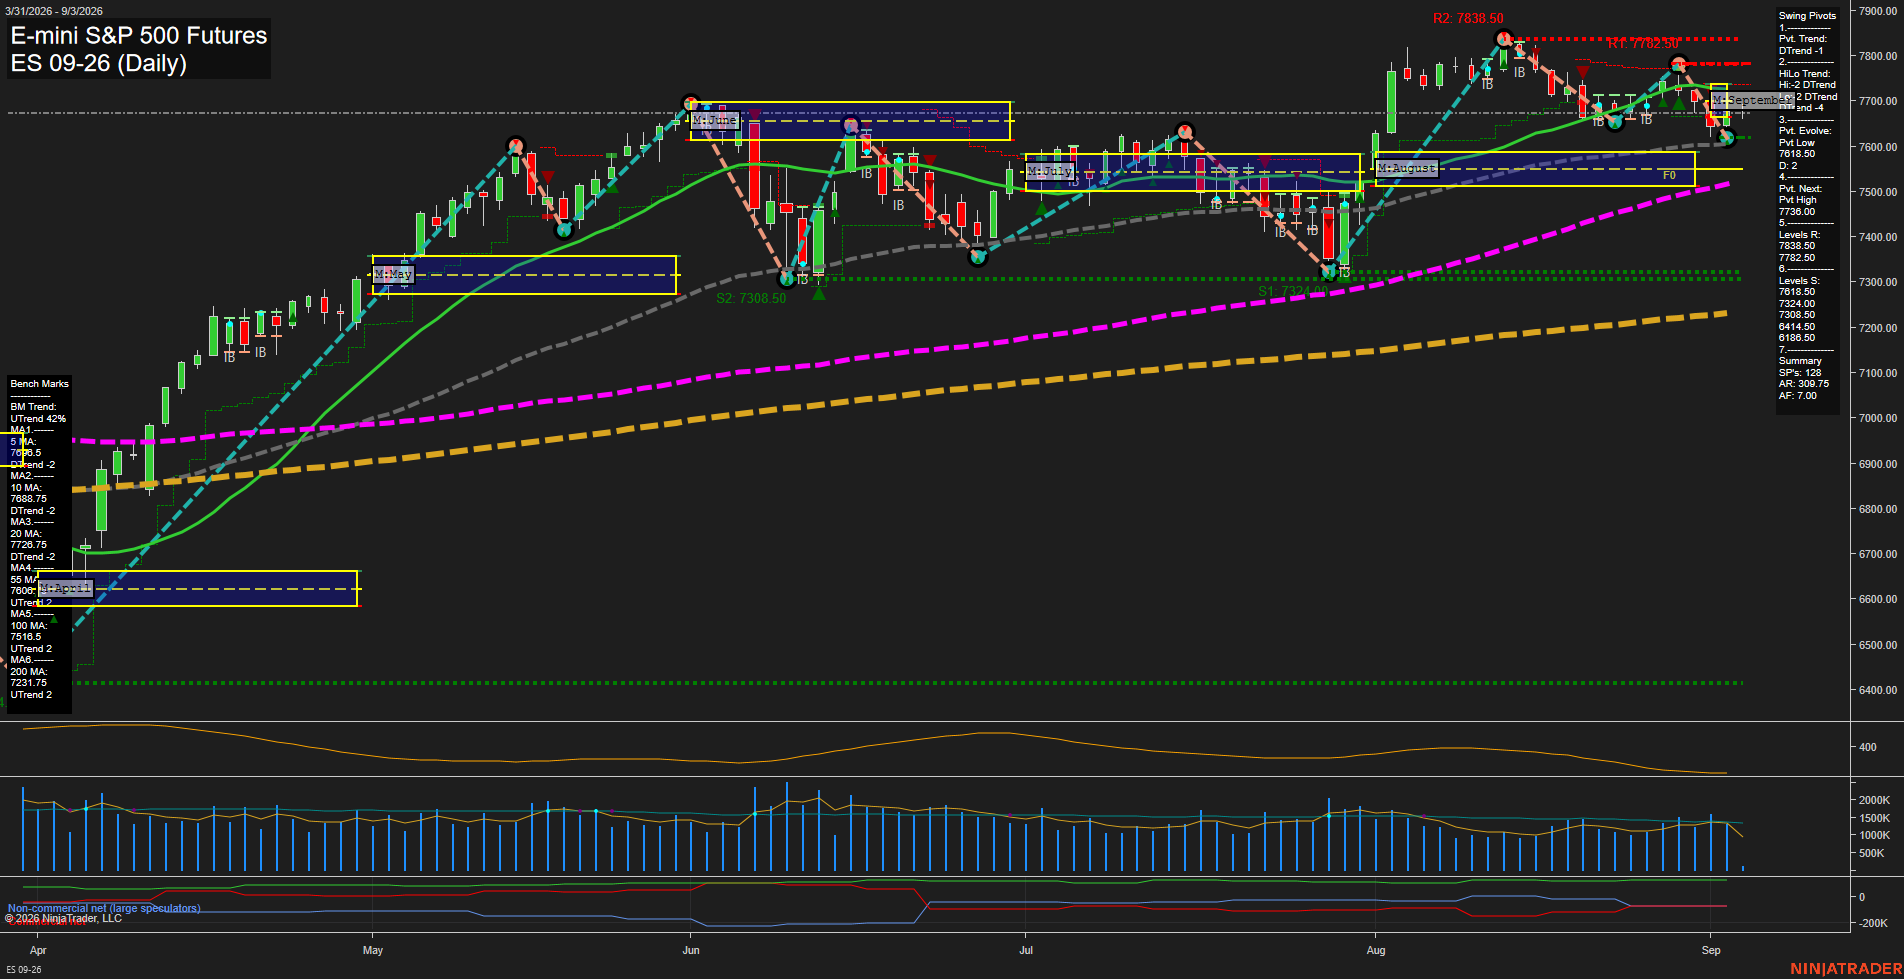
Overall Rating
- Short-Term: Bearish
- Intermediate-Term: Bearish
- Long-Term: Bullish.
Key Insights Summary
Price has shifted into a fast short-term decline, trading below the weekly and September monthly F0% areas and beneath the declining 5, 10, and 20-day benchmarks. Pivot structure is bearish on both the short-term and intermediate-term readings, with 7732.50 to 7838.50 defining overhead resistance. The 7618.50 pivot-low area is the immediate structural support, while 7324.00 and 7308.50 are the larger downside support cluster. The broader yearly structure remains constructive because price is still above rising 55, 100, and 200-day benchmarks, framing the current move as an intermediate pullback within a longer-term uptrend.
View charts on: AlphaWebTrader HTF Charts
NQ Daily View
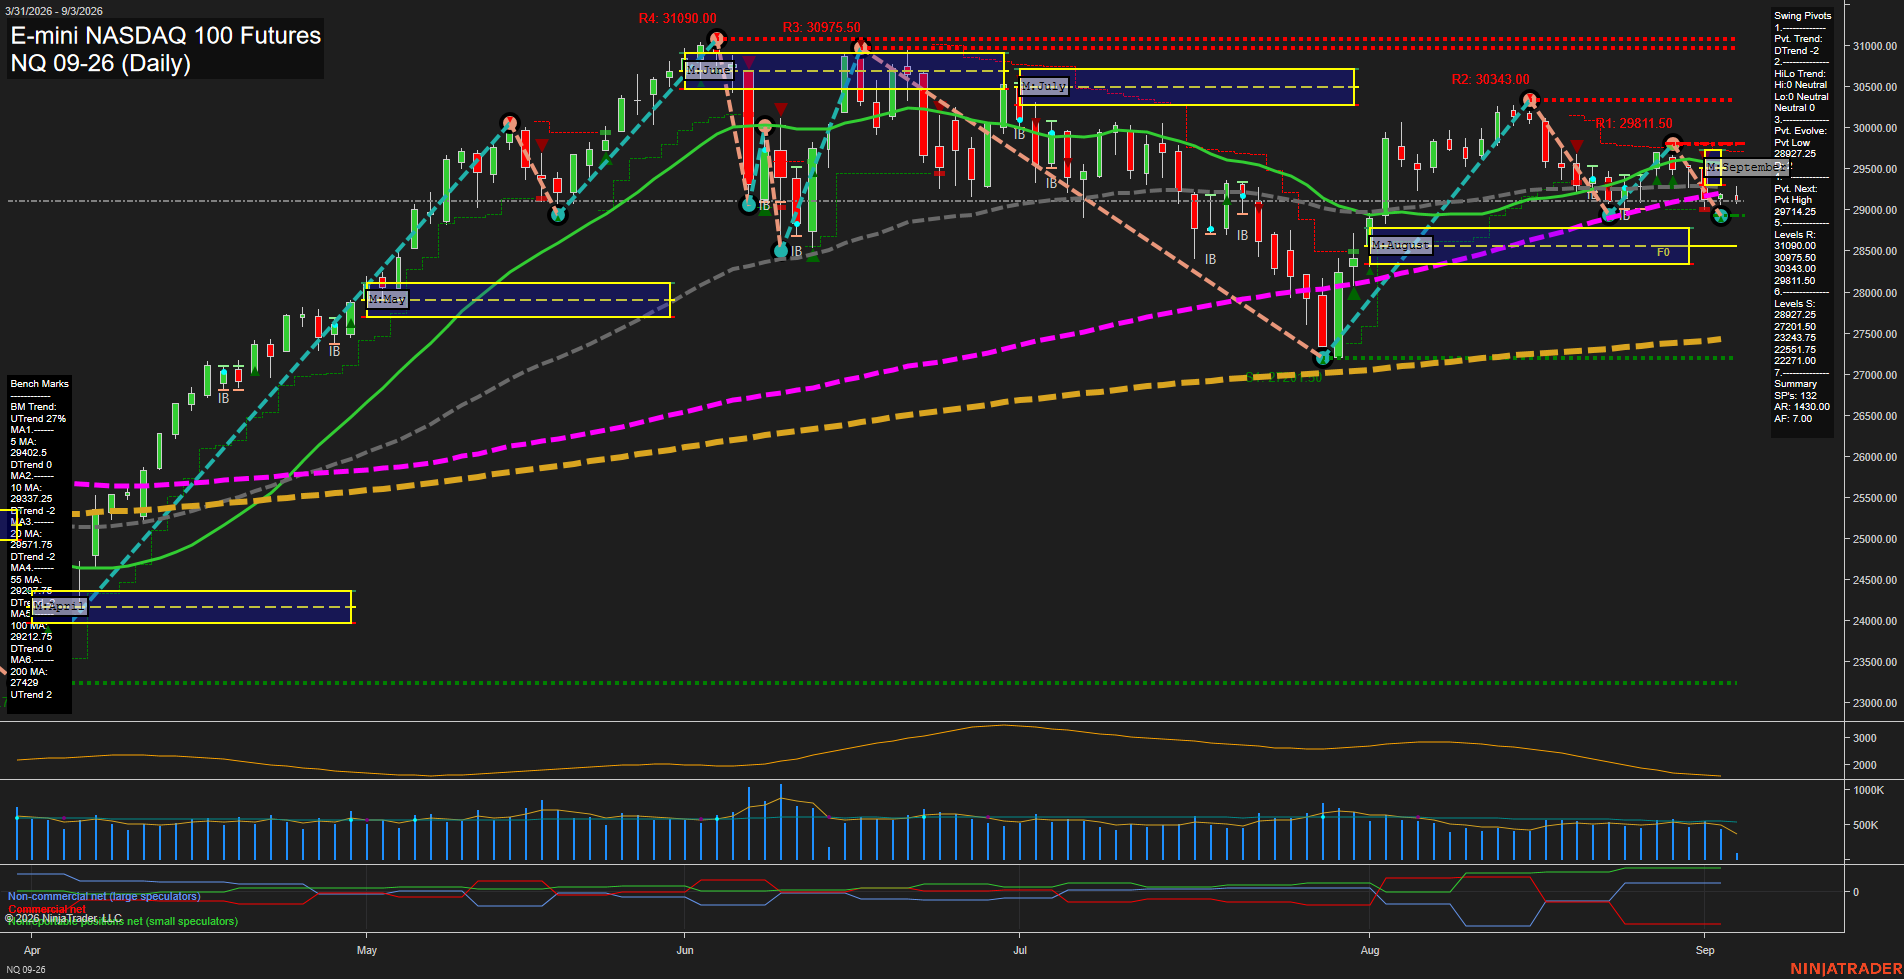
Overall Rating
- Short-Term: Bearish
- Intermediate-Term: Bearish
- Long-Term: Bullish.
Key Insights Summary
Price is trading beneath the short- and intermediate-term benchmark cluster, with the 5, 10, 20, 55, and 100 day averages all declining. The daily pivot structure remains in a DTrend and recent price action has formed lower highs following the August rebound. The 28927.25 pivot support is the immediate structural reference, while 29142.5 is the next pivot reversal level and 29292.75 to 29577.75 defines the nearby moving-average resistance band. Intermediate conditions remain corrective under the September monthly grid, while the yearly grid and rising 200 day average preserve the broader long-term uptrend context. ATR remains elevated, reflecting a volatile consolidation and retracement phase rather than a smooth directional advance.
View charts on: AlphaWebTrader HTF Charts
CL Daily View
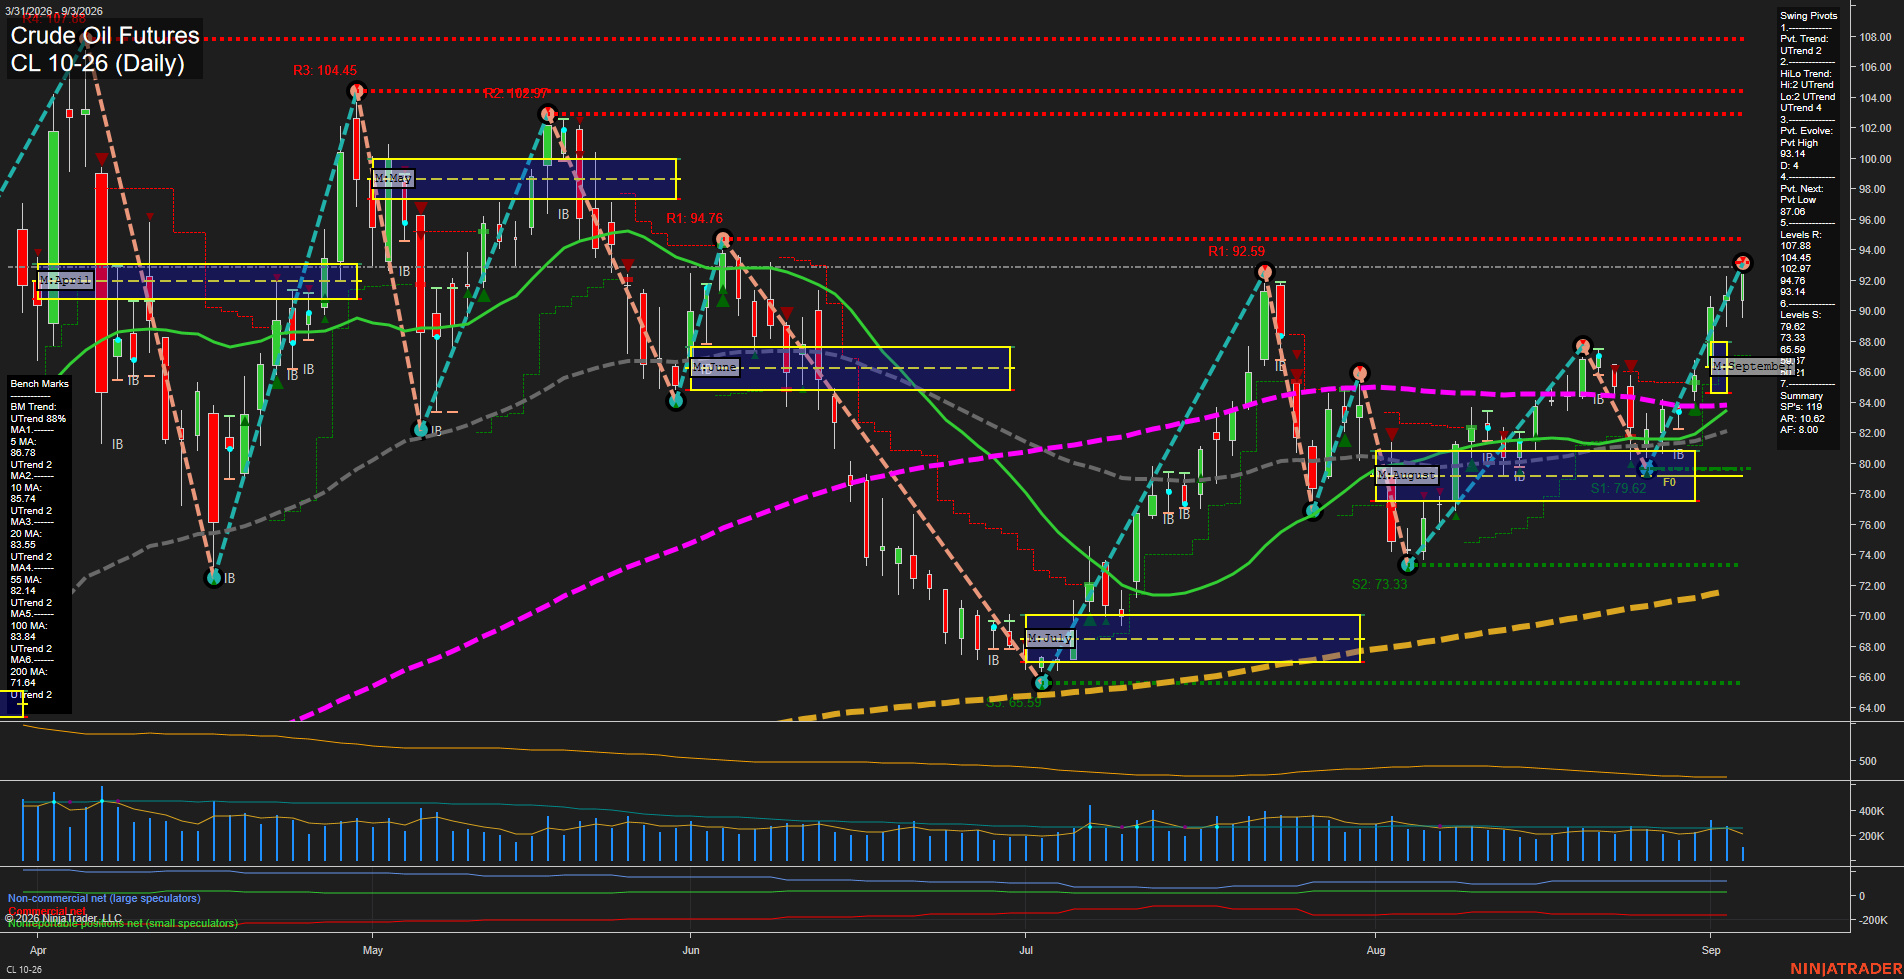
Overall Rating
- Short-Term: Bullish
- Intermediate-Term: Bullish
- Long-Term: Bullish.
Key Insights Summary
Price is advancing in a fast, large-bar rally and has established a new short-term pivot high at 93.14. The pivot structure is aligned upward across both short-term and intermediate-term measures, while price holds above every benchmark moving average. The recent advance extends from the August higher low near 79.62 and has pushed through the prior 87.06 reversal area. The 94.76 pivot resistance is the nearest overhead structural level, followed by the 102.97 to 104.45 resistance zone. The trend remains broadly constructive, although the sharp recovery has produced elevated swing volatility and a comparatively extended distance above the 20-day, 55-day, and 100-day averages.
View charts on: AlphaWebTrader HTF Charts
GC Daily View
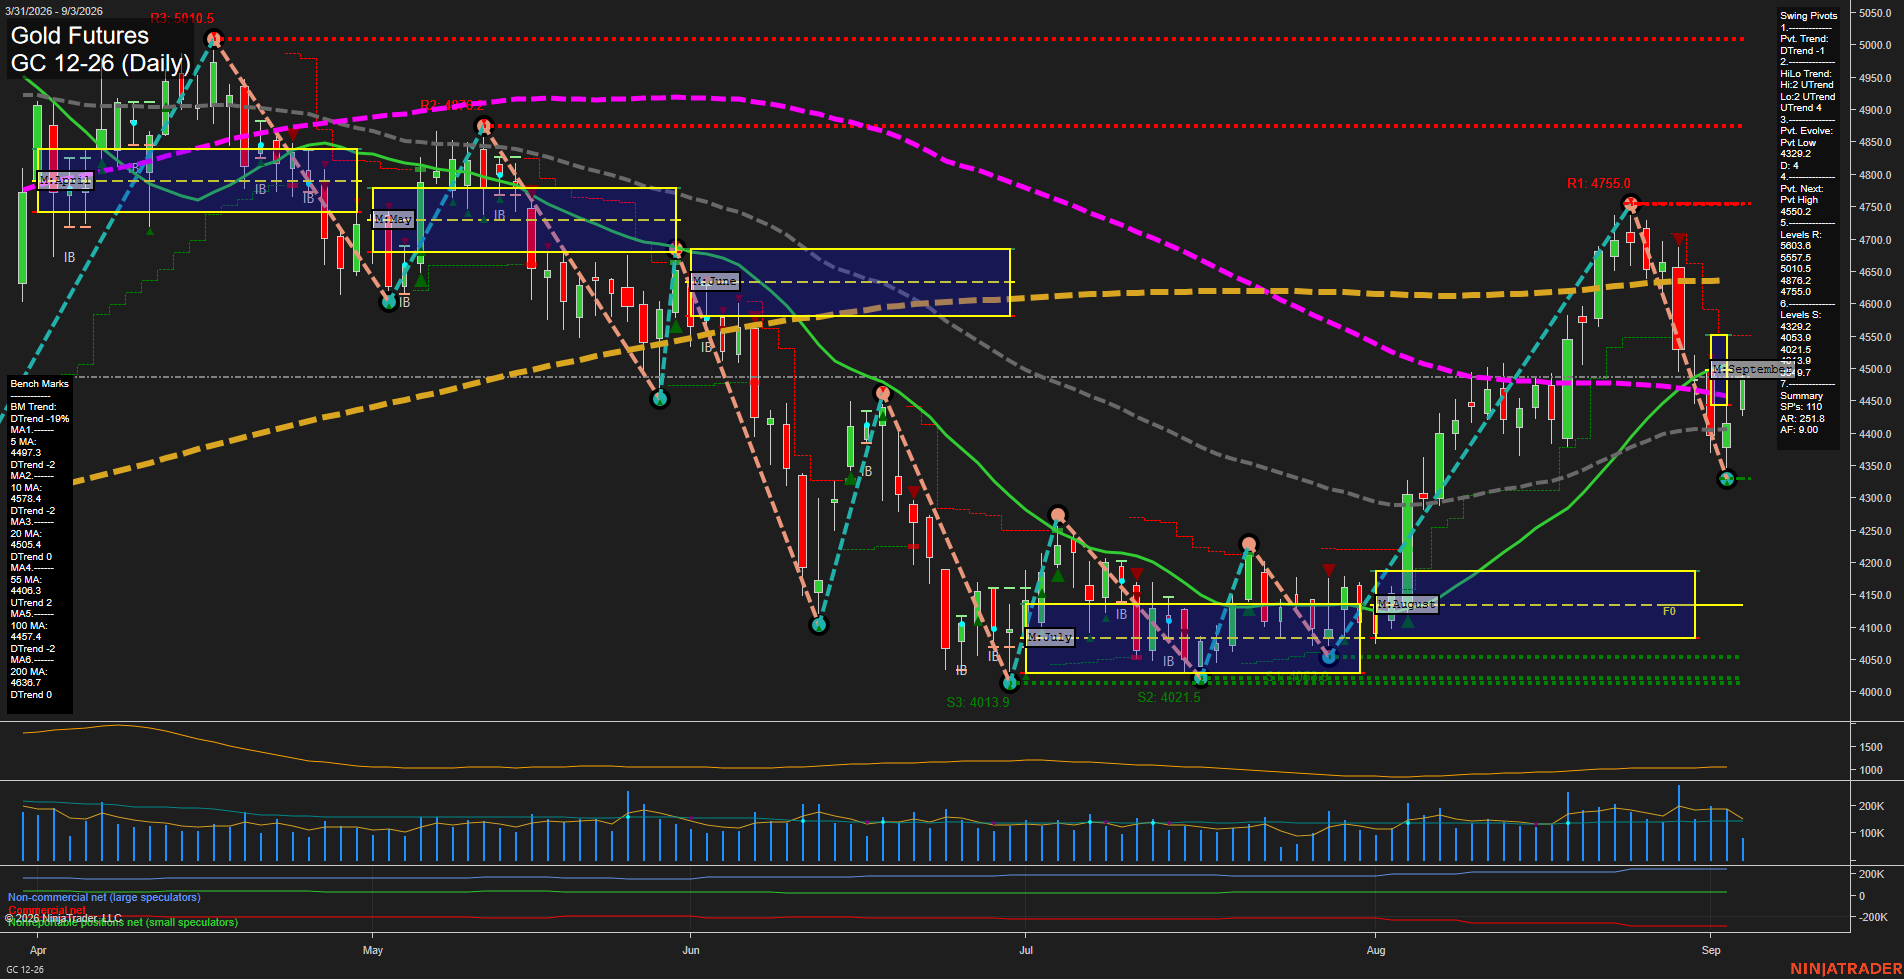
Overall Rating
- Short-Term: Bearish
- Intermediate-Term: Neutral
- Long-Term: Bearish.
Key Insights Summary
GC has undergone a fast counter-trend selloff from the 4755.0 pivot high into the newly established 4329.2 pivot low, followed by a modest rebound toward 4437.4. Short-term structure remains bearish, with price under the 5-, 10-, and 20-day benchmarks and a DTrend pivot reading. The intermediate picture is mixed: the monthly and weekly Fib-grid trends remain positive and the 55-day average is rising, while price is still below the 20-day average and the 4550.2 pivot threshold. Long-term conditions remain negative beneath declining 100- and 200-day averages and a bearish yearly Fib-grid posture. The current pattern reflects elevated volatility, a sharp retracement, and a possible stabilization attempt above the 4329.2 swing-low support.
View charts on: AlphaWebTrader HTF Charts