
NYSE pre-market radar highlights ETF movers and technical signals as oil-driven inflation concerns pressure U.S. futures ahead of CPI data release.
Fundamentals: U.S. equity futures weakened as Middle East supply disruptions lifted crude prices, with Brent nearing $100 and WTI around $93. Investors weighed renewed inflation pressure ahead of U.S. CPI data, while global shares declined and the yen strengthened. Saudi energy disruptions, refined-product tightness and elevated technology valuations remained central market themes.
Technicals: Pre-market focus includes gains in Meta, Nvidia and small-cap ETFs, while Apple, Tesla and Bitcoin-linked funds declined in the prior session. Futures technical reviews show broadly constructive long-term trends in major equity indexes, though several markets remain in corrective or consolidating phases near key support and resistance levels.
Pre-Market Trading 360° view Market Radar of: holidays, earnings, eco-news, market-news summary, news sentiment, prior session major ETFs, MAG7, Higher Time Frame Analysis Indices Futures Summary, and E-mini S&P500, Nasdaq 100, NYMEX Crude, Gold Futures Daily Chart analysis.
As of: September 8, 2026 07:16 CT
Earnings Radar
Monitoring for earnings releases by the Magnificent 7, AI-tech-related firms, and major financial institutions.
- ADBE Release: 2026-09-10 T:AMC
- ORCL Release: 2026-09-10 T:AMC
Conclusion: Adobe and Oracle report after the close on 10 September 2026, concentrating major software and enterprise-tech earnings risk into the same post-market window. Index-futures participation and volume can slow beforehand as markets assess AI, cloud, software-demand, and corporate-spending signals from these releases.
For full details visit: Yahoo Earnings Calendar
EcoNews Radar U.S. Events
| Day | Time | Impact | Event |
|---|---|---|---|
| Thu | 08:30 | High | Core PPI m/m |
| Thu | 08:30 | High | PPI m/m |
| Thu | 08:30 | Medium | Unemployment Claims |
| Thu | 12:00 | Low | Crude Oil Inventories |
| Fri | 08:30 | High | Core CPI m/m |
| Fri | 08:30 | High | Core CPI y/y |
| Fri | 08:30 | High | CPI m/m |
| Fri | 08:30 | High | CPI y/y |
| Fri | 10:00 | Medium | Prelim UoM Consumer Sentiment |
| Fri | 10:00 | Medium | Prelim UoM Inflation Expectations |
EcoNews Summary
Thursday features high-impact producer inflation data, followed by Friday’s high-impact consumer inflation releases. These reports provide inflation readings at producer and consumer levels, drawing attention from index futures markets because they shape the broader inflation backdrop.
Event Notes:
- Thursday 08:30 – USD Core PPI m/m: Measures monthly changes in producer prices excluding food and energy. Traders monitor it for underlying inflation pressure within the production pipeline.
- Thursday 08:30 – USD PPI m/m: Measures the monthly change in prices received by domestic producers. It is monitored as an indicator of wholesale inflation and potential pressure on consumer prices.
- Friday 08:30 – USD Core CPI m/m: Measures the monthly change in consumer prices excluding food and energy. It is a closely watched reading of underlying consumer inflation.
- Friday 08:30 – USD Core CPI y/y: Measures the annual change in consumer prices excluding food and energy. It provides a longer-term view of core inflation trends.
- Friday 08:30 – USD CPI m/m: Measures the monthly change in the broad consumer price index. It tracks near-term changes in household-level inflation.
- Friday 08:30 – USD CPI y/y: Measures the annual change in the broad consumer price index. It is monitored as a headline measure of consumer inflation.
Conclusion:
The single most important event is Friday at 08:30, led by USD Core CPI m/m within the CPI release set. Market momentum and volume often slow ahead of major CPI data, with increased volatility at release time. Thursday’s PPI reports provide producer-level inflation context ahead of Friday’s consumer inflation readings.
For full details visit: Forex Factory EcoNews
Market News Summary:
Equity futures weakened as Middle East supply disruptions lifted oil toward $100 and renewed inflation concerns before U.S. CPI data.
Primary Drivers & Risks:
- Primary Driver: Middle East oil supply disruption
- Primary Risk: Energy-driven inflation and policy uncertainty
Tone:
Risk-off, with inflation and geopolitical pressure dominating.
Stock Market / ETFs / Indices:
U.S. equity futures were broadly lower after the Labor Day weekend as Brent neared $100. Global stocks slid, while Japan’s Nikkei fell 0.6% on weakness in electronics and machinery. The S&P 500 remained near record highs, with technology and semiconductor valuations under scrutiny.
Geopolitical:
Renewed U.S.-Iran hostilities, Iranian retaliation threats, and reported Houthi attacks on Saudi Arabia intensified concerns over Gulf, Red Sea, and Saudi energy operations. The conflict disrupted regional exports and raised concerns about a prolonged confrontation.
Oil / Energy:
Oil extended gains on supply-disruption fears, with WTI near $93 and Brent approaching the $100–$102 area. Saudi Arabia halted some energy operations after attacks, while refined-product pressure remained acute as diesel reached a record and crack spreads widened. Higher crude and fuel prices increased concern over sustained energy inflation.
Gold / Metals:
Gold market positioning, flows, and derivatives indicators were described as broadly bullish, reflecting continued demand amid geopolitical and inflation concerns.
Fed / Financials:
Investors focused on upcoming U.S. CPI data and the implications of higher energy prices for inflation and central-bank policy. Treasury yields edged lower in Asian trading despite the oil rise. The Fed reported a third consecutive quarterly profit, while its deferred asset remained substantial and Treasury remittances remained absent.
Macro / Other:
China’s auto exports reached a record in August while domestic vehicle sales declined for an eleventh consecutive month. Canada’s U.S. tariffs took effect, and the yen reached a six-month high amid carry-trade unwind and Treasury-sale concerns. BOJ rate-hike policy also remained in focus.
Conclusion:
Middle East conflict and oil supply disruption are the central market drivers. Rising crude and refined-product prices are pushing inflation back into focus ahead of U.S. CPI data.
Lower equity futures, weaker global shares, and a stronger yen reflect broader risk sensitivity. Near-record U.S. equity levels and elevated technology expectations add a valuation cross-current.
Market News Sentiment
Market News Articles: 25
- Neutral: 56.00%
- Negative: 28.00%
- Positive: 16.00%
Sentiment Summary: Market news sentiment is predominantly neutral at 56%, with negative coverage at 28% and positive coverage at 16%.
Conclusion: The news mix is neutral overall, while negative articles outnumber positive articles for indices futures day traders.
GLD,Gold Articles: 4
- Positive: 75.00%
- Negative: 25.00%
Sentiment Summary: GLD/Gold coverage is 75% positive and 25% negative across 4 articles.
Conclusion: Gold-related news tone is predominantly positive, with some negative coverage present.
USO,Oil Articles: 13
- Positive: 61.54%
- Negative: 30.77%
- Neutral: 7.69%
Sentiment Summary: USO/Oil coverage was moderately positive, with 62% positive, 31% negative, and 8% neutral articles across 13 items.
Conclusion: Oil-related news tone is positive overall, while a meaningful share of negative coverage indicates mixed underlying sentiment.
Market Data Snapshot
ETF Snapshot of major stock market ETFs, Mag7, and others as of: September 8, 2026 07:16
Top Movers & Losers
- META 616.77 Bullish 1.00% ▲
- NVDA 230.36 Bullish 0.84% ▲
- IWM 296.01 Bullish 0.28% ▲
- IBIT 45.23 Bearish -2.42% ▼
- AAPL 319.97 Bearish -2.51% ▼
- TSLA 354.08 Bearish -5.92% ▼
Major Index ETFs: SPY, QQQ, DIA, IWM, IJH
- IWM 296.01 Bullish 0.28% ▲
- QQQ 718.96 Bullish 0.18% ▲
- IJH 75.85 Bullish 0.13% ▲
- SPY 770.19 Bearish -0.39% ▼
- DIA 534.08 Bearish -0.53% ▼
Mixed index ETF snapshot: IWM is the most bullish mover at +0.28%, followed by QQQ at +0.18% and marginally bullish IJH at +0.13%. SPY is bearish at -0.39%, while DIA is the most bearish mover at -0.53%.
Mag 7 Stocks: AAPL, MSFT, GOOG, AMZN, META, NVDA, TSLA
- META 616.77 Bullish 1.00% ▲
- NVDA 230.36 Bullish 0.84% ▲
- AMZN 258.51 Bearish -0.15% ▼
- GOOG 335.31 Bearish -1.11% ▼
- MSFT 499.70 Bearish -2.04% ▼
- AAPL 319.97 Bearish -2.51% ▼
- TSLA 354.08 Bearish -5.92% ▼
Mixed Mag7 action: META is the most bullish mover at +1.00%, followed by NVDA at +0.84%. AMZN is marginally Bearish at -0.15%, while GOOG fell -1.11%, MSFT -2.04%, and AAPL -2.51%. TSLA is the most bearish mover, down -5.92%.
Cross-Market ETFs: TLT, GLD, USO, IBIT
- TLT 82.21 Bullish 0.17% ▲
- USO 141.96 Bearish -0.09% ▼
- GLD 406.77 Bearish -0.84% ▼
- IBIT 45.23 Bearish -2.42% ▼
Other ETFs are Mixed: TLT is the most bullish mover at +0.17%, while IBIT is the most bearish mover at -2.42%. GLD is Bearish at -0.84%, and USO is marginally Bearish at -0.09%.
ETF, Mag7, and Cross-Market ETF Insights
Overall Tone
Mixed, with selective Bullish leadership in technology offset by Bearish broad-index, crypto, precious-metals, and several Mag7 moves.
Equity ETFs and Mag7:
Major Index ETFs were Mixed: IWM +0.28%, QQQ +0.18%, and IJH +0.13% were modestly Bullish, while SPY -0.39% and DIA -0.53% were Bearish. Mag7 action was selective, led by META at +1.00%, the most bullish mover, and NVDA at +0.84%; TSLA at -5.92% was the most bearish mover, followed by AAPL -2.51%, MSFT -2.04%, and GOOG -1.11%. AMZN was marginally Bearish at -0.15%, leaving equities selectively rather than broadly aligned.
Cross-Market ETFs:
Cross-market ETFs were Mixed: TLT was marginally Bullish at +0.17%, while USO was near-flat and Bearish at -0.09%. GLD declined -0.84% and IBIT fell -2.42%, the most bearish cross-market mover; TLT was the most bullish mover. The combination of modest TLT strength with Bearish gold, oil, and bitcoin showed divergence across hedging and commodity-linked markets.
Futures Indices – Higher Time Frame Analysis
Summary of the current state of US Indices Futures based on higher time-frame (HTF) technical analysis as of: 2026-09-08: 07:16 CT.
US Indices Futures
- ES YSFG/MSFG remain above F0%, WSFG below F0%; UTrend intermediate pivots, 7476.50 support, 7838.50 resistance; benchmarks remain broadly rising.
- NQ YSFG/MSFG/WSFG above F0%; higher swing low from 27201.50, 29752.75 pivot reference; 29811.50-30343.00 resistance, 28927.25 support.
- YM YSFG above F0%, MSFG/WSFG below centers; 54884 pivot resistance, 52913-52720 support; short benchmarks declining, long benchmarks rising.
- EMD YSFG/MSFG/WSFG above F0%; short pivots DTrend after 3941.7, 3713.8 support, 3797.4 resistance; 55-200 benchmarks rising.
- RTY YSFG/MSFG above F0%, WSFG below F0%; 3079.9 resistance, 2904.5-2914.5 support; intermediate pivots UTrend, short benchmarks softer.
- FDAX YSFG above F0%, MSFG/WSFG below centers; 26665 resistance, 25759 support, 25221 opposite pivot; 20-200 benchmarks retain upward slope.
Overall State
- Short-Term: Neutral
- Intermediate-Term: Bullish
- Long-Term: Bullish
Conclusion
NQ maintains the most aligned HTF structure, with YSFG, MSFG, WSFG, and benchmark direction above key references. ES, EMD, and RTY retain intermediate and long-term upward structures amid weekly pullbacks. YM and FDAX show broader yearly support while monthly and weekly conditions remain below F0% centers. Across the group, major pivot highs define overhead resistance, while cited pivot lows and rising longer-period benchmarks define structural support.
Note: Intra-day counter-trend pullbacks or retracements may occur, HTF is context for informational usage and market structure. Glossary: Session Fib Grids periods of YSFG:’Yearly’, MSFG:’Monthly’, WSFG:’Weekly’
For full details visit: AlphaWebTrader Technicals
ES Daily View
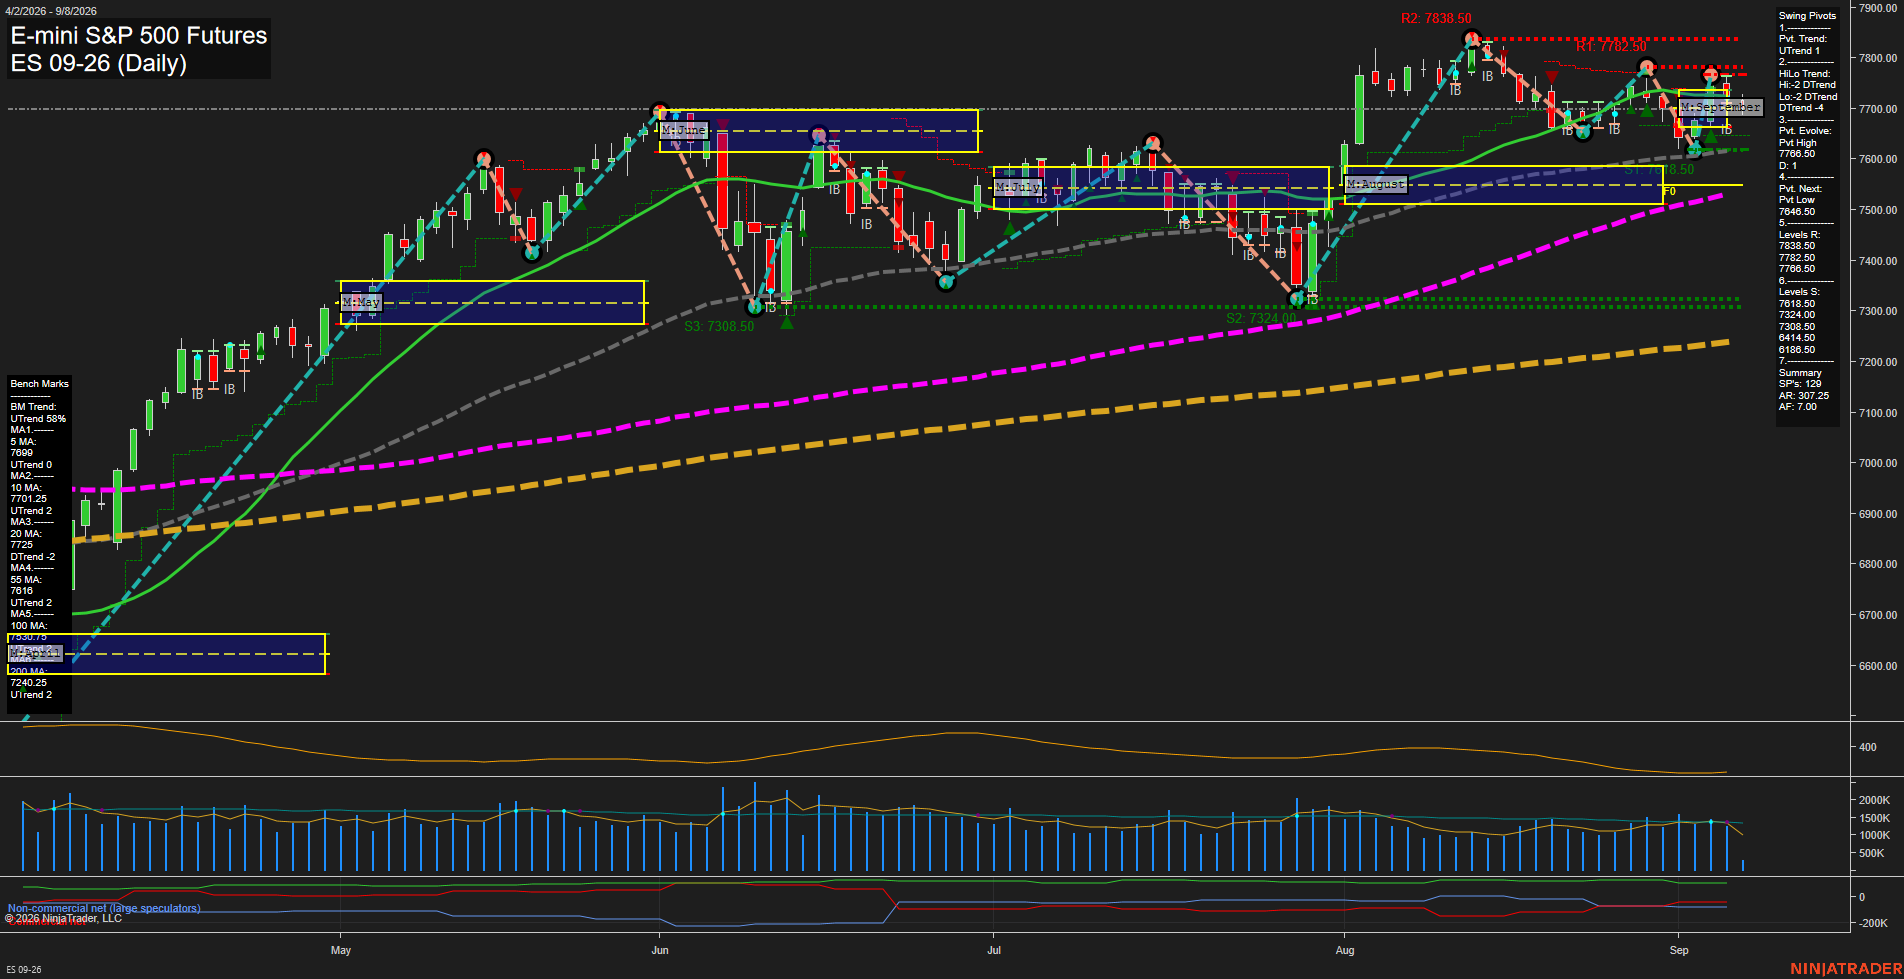
Overall Rating
- Short-Term: Neutral
- Intermediate-Term: Neutral
- Long-Term: Bullish.
Key Insights Summary
Price has staged a sharp V-shaped rebound from the 7640.50 pivot-low area and is now testing the 7760.50 to 7782.50 resistance band. The short-term pivot structure is positive, but the weekly fib-grid remains below its F0% reference and the intermediate HiLo structure remains in a downtrend, defining a countertrend recovery within a mixed swing environment. The 20-day average remains declining near price, while the rising 55-, 100-, and 200-day benchmarks preserve the broader bullish trend structure. Resistance is concentrated at 7760.50, 7782.50, and 7838.50; support is layered at 7618.50, 7480.50, and 7308.50. ATR remains elevated, reflecting continued wide daily rotation and active September volatility.
View charts on: AlphaWebTrader HTF Charts
NQ Daily View
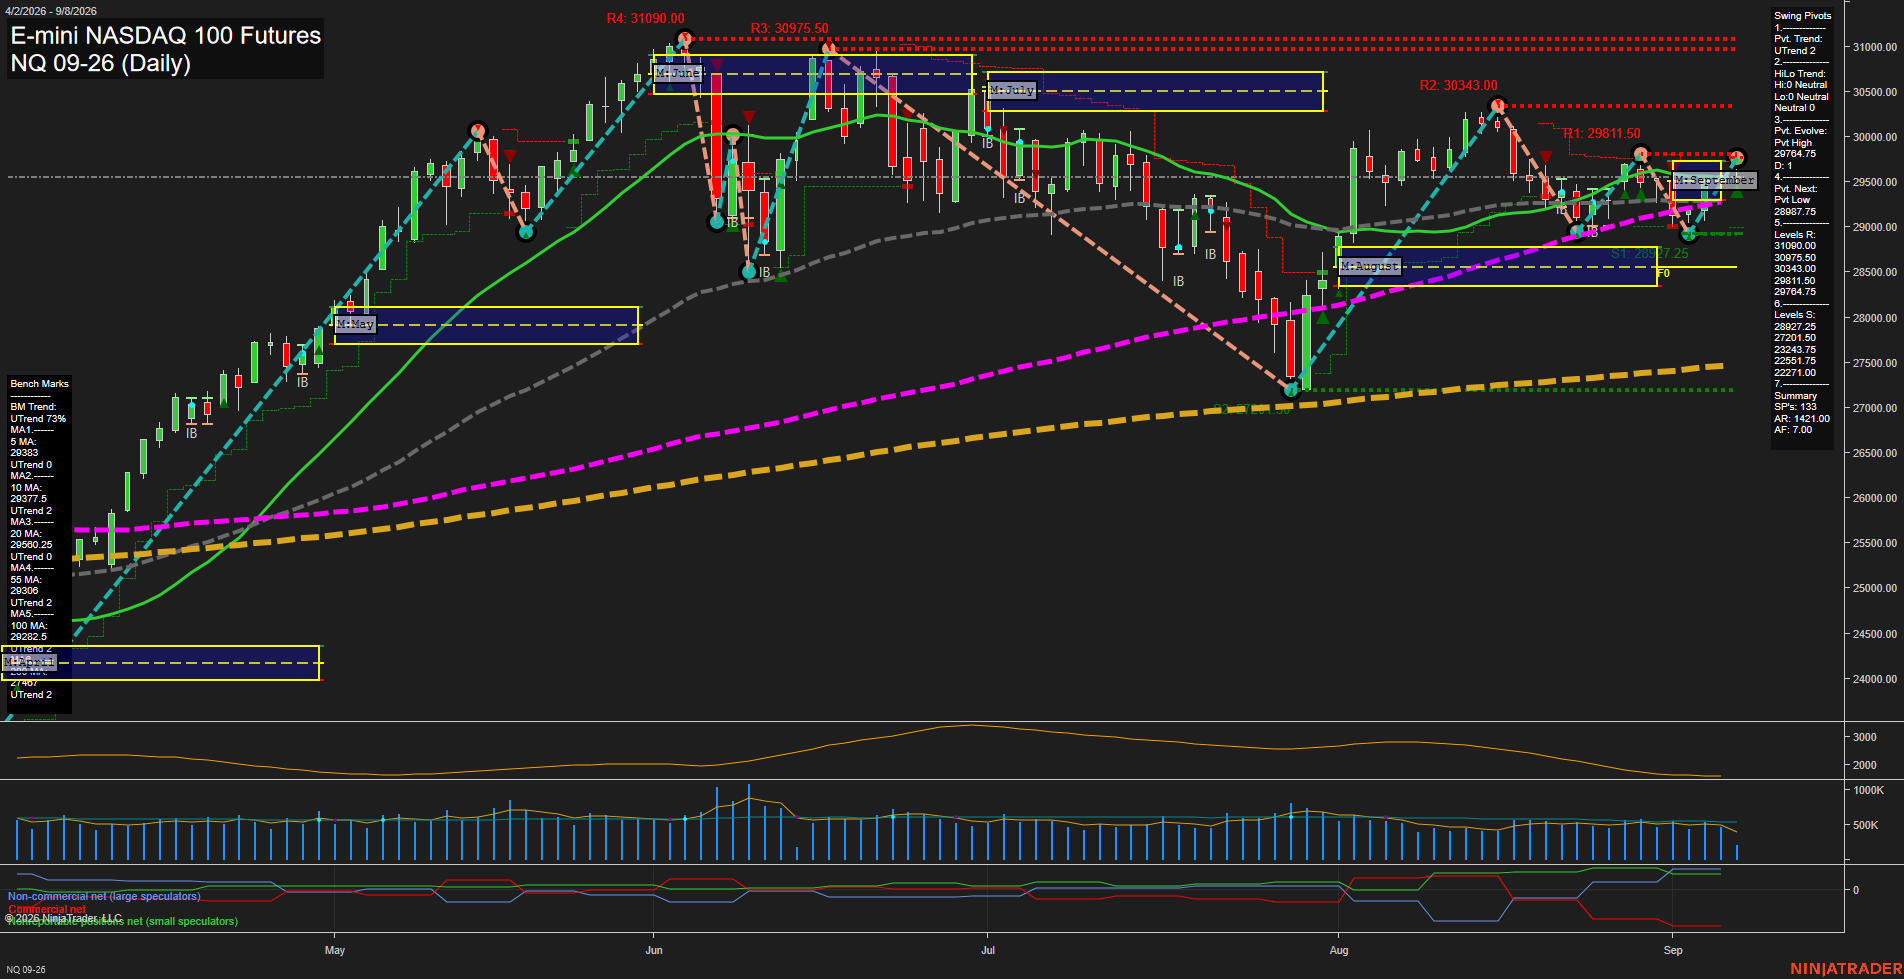
Overall Rating
- Short-Term: Bullish
- Intermediate-Term: Bullish
- Long-Term: Bullish.
Key Insights Summary
NQ remains in a broadly constructive swing structure, holding above the rising 5, 10, 55, 100, and 200-day benchmarks while the weekly, monthly, and yearly Fib-grid biases remain positive. Short-term price action is consolidating around the 20-day benchmark following a rebound from the late-August pivot low, with 29752.75 acting as the active pivot-high reference. The 29811.50 to 30343.00 resistance zone defines the next overhead supply area, while 28987.75 and 28927.25 mark the nearest structural support. ATR remains elevated, reflecting wide daily rotation and a choppy recovery phase rather than a smooth directional advance.
View charts on: AlphaWebTrader HTF Charts
CL Daily View
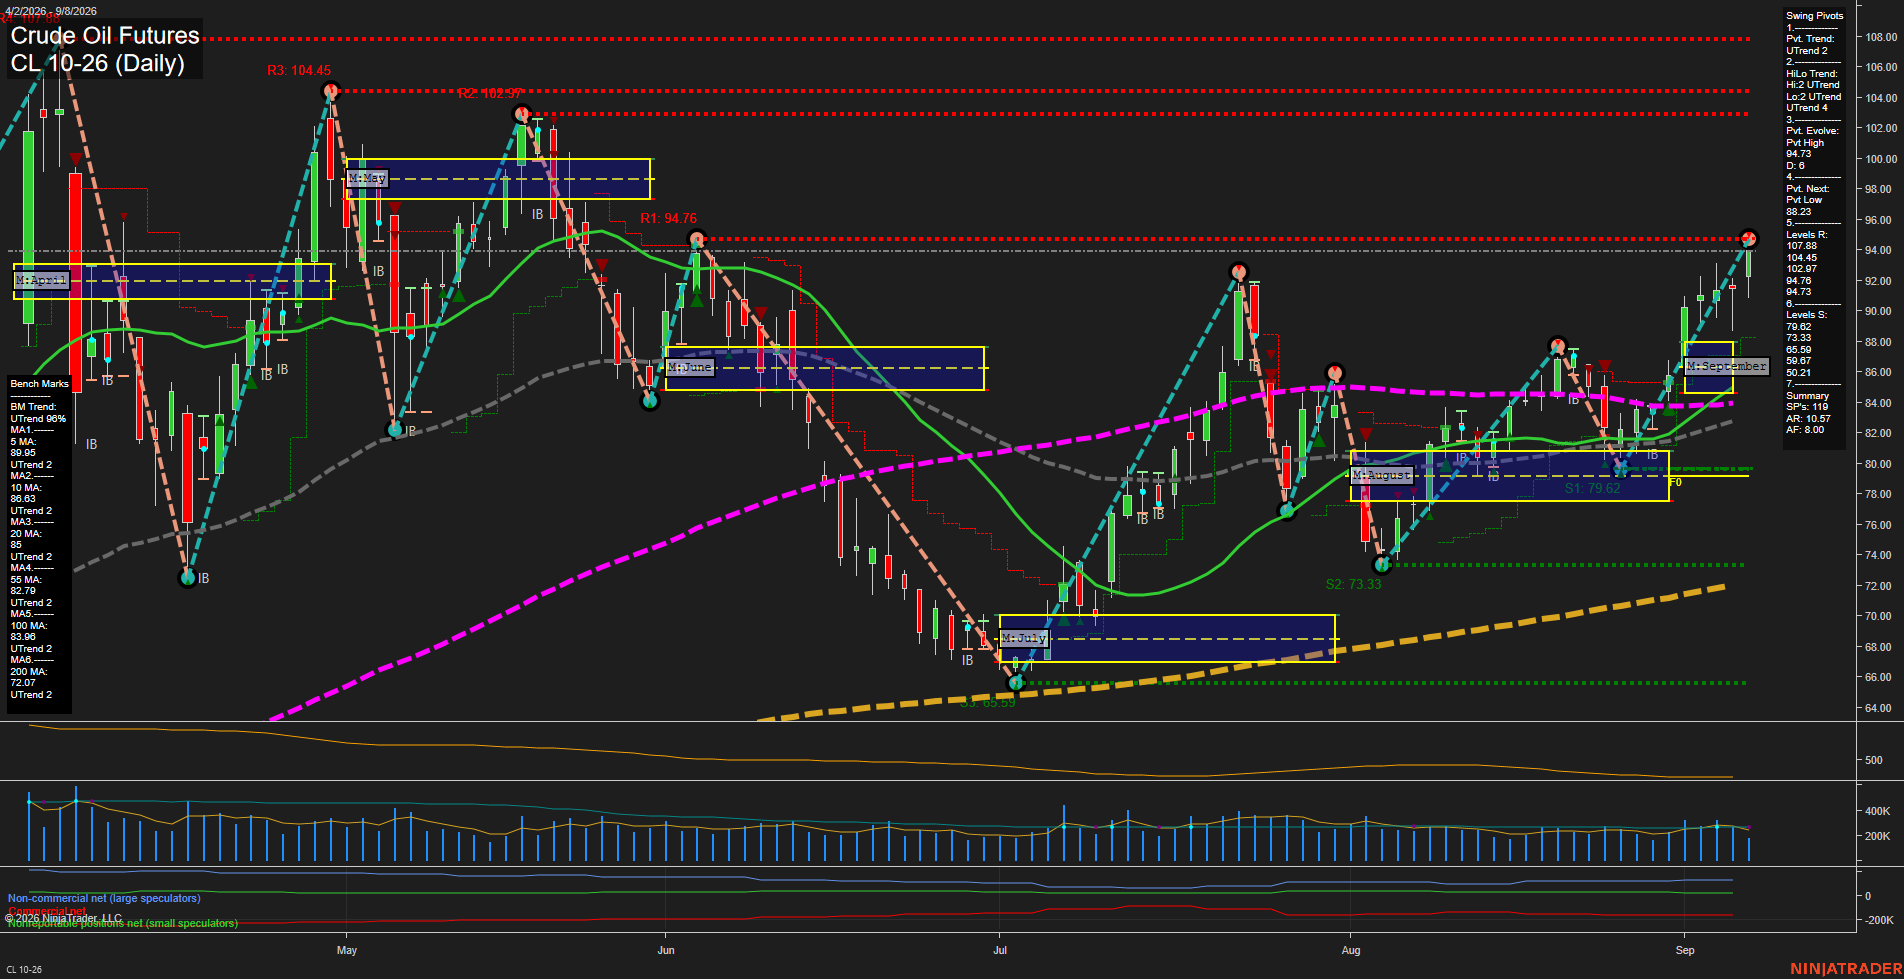
Overall Rating
- Short-Term: Bullish
- Intermediate-Term: Bullish
- Long-Term: Bullish.
Key Insights Summary
Price is advancing in a fast upside swing, holding above every benchmark moving average and maintaining aligned upward short-, intermediate-, and long-term trend structure. The recovery from the August pivot low produced higher lows and a breakout through the September grid area, bringing price into the 94.73 to 94.76 pivot-resistance zone. The active pivot remains a high, while 88.23 defines the opposite-pivot reversal level; broader support is layered at 79.62, 73.33, and 65.59. The next higher resistance sequence is 102.97, 104.45, and 107.88, reflecting substantial overhead room if the current expansion continues.
View charts on: AlphaWebTrader HTF Charts
GC Daily View
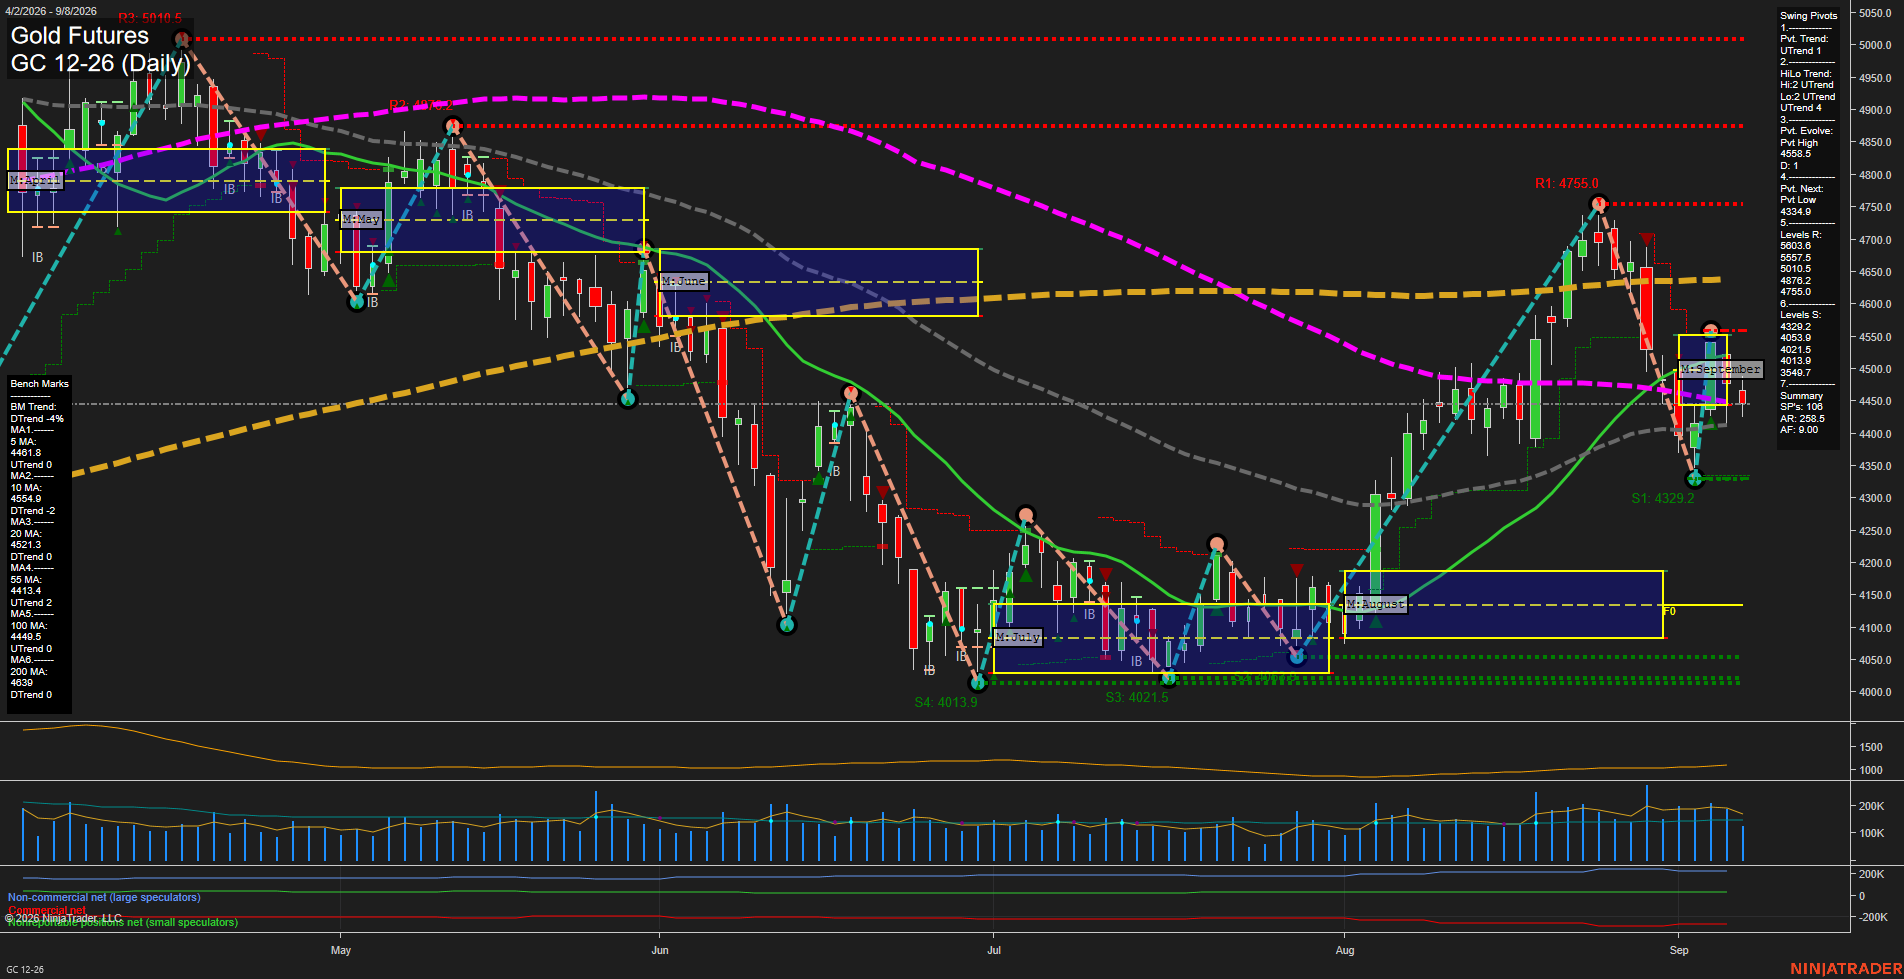
Overall Rating
- Short-Term: Neutral
- Intermediate-Term: Neutral
- Long-Term: Bearish.
Key Insights Summary
GC is consolidating near 4451 following a sharp August rally, a rejection from the 4755 swing-high resistance area, and a retracement into the 4329 pivot-low area. The active pivot structure remains UTrend, but price is below the 5-day, 10-day, and 20-day benchmark cluster, while the weekly and monthly fib-grid readings remain down. Small daily bars and slowing momentum indicate compression after the high-volatility decline and rebound. The 4413 55-day and 4449.5 100-day averages are immediate trend-reference levels, while 4512, 4521, and 4555 form nearby overhead resistance. The long-term structure remains mixed-to-bearish because price is below the declining 200-day benchmark near 4639 and the yearly fib-grid trend remains down.
View charts on: AlphaWebTrader HTF Charts