
S&P 500 futures hold a broader bullish trend near resistance as traders weigh August CPI, the Fed, payroll strength, Hormuz oil risks and tech valuations.
Fundamentals: Index-futures attention is centered on the August CPI report and the Fed’s September decision after payrolls exceeded estimates. Oil markets remain sensitive to Strait of Hormuz export disruptions as OPEC+ holds October policy steady. Tech selectivity, ETF valuation concerns, gold repatriation and tight credit spreads add cross-currents.
Technicals: U.S. index futures enter the week with the S&P 500 maintaining bullish short-, intermediate- and long-term readings, though price is consolidating below nearby resistance. Nasdaq futures show softer short-term conditions, while Dow and E-mini S&P trends are mixed beneath recent highs. Russell 2000 remains broadly constructive, while DAX is in a corrective pullback. Prior-session ETF moves included gains in Meta and Nvidia and declines in Apple, Tesla and Bitcoin.
Market Week Ahead – Trading 360° view Market Radar for: holidays, earnings, eco-news, market-news summary, news sentiment, and major ETFs, MAG7, Higher Time Frame Analysis Indices Futures Summary, and ETF SPY S&P500, QQQ Tech, USO Oil, GLD Gold Weekly Chart analysis
As of: September 6, 2026 06:15 CT
Holiday Radar
- 2026-09-07 Labor Day
Earnings Radar
Monitoring for earnings releases by the Magnificent 7, AI-tech-related firms, and major financial institutions.
- ADBE Release: 2026-09-10 T:AMC
- ORCL Release: 2026-09-10 T:AMC
Conclusion: Adobe and Oracle both report after the close on September 10, concentrating major software and enterprise-tech earnings risk in one session. Index futures sensitivity centers on post-release reactions in large-cap technology, AI-related software demand, cloud infrastructure, and corporate IT spending; market momentum and volume can slow ahead of these releases.
For full details visit: Yahoo Earnings Calendar
EcoNews Radar U.S. Events
| Day | Time | Impact | Event |
|---|---|---|---|
| Thu | 08:30 | High | Core PPI m/m |
| Thu | 08:30 | High | PPI m/m |
| Thu | 08:30 | Medium | Unemployment Claims |
| Thu | 12:00 | Low | Crude Oil Inventories |
| Fri | 08:30 | High | Core CPI m/m |
| Fri | 08:30 | High | Core CPI y/y |
| Fri | 08:30 | High | CPI m/m |
| Fri | 08:30 | High | CPI y/y |
| Fri | 10:00 | Medium | Prelim UoM Consumer Sentiment |
| Fri | 10:00 | Medium | Prelim UoM Inflation Expectations |
EcoNews Summary
Thursday features producer inflation data, followed by Friday’s consumer inflation releases. These reports provide key readings on inflation pressures at the business and household levels, with broad relevance for index futures, interest-rate expectations, and Treasury-market activity.
Event Notes:
- Thursday 08:30 – USD Core PPI m/m: Measures the monthly change in producer prices excluding food and energy. Traders monitor it for underlying pipeline inflation pressures.
- Thursday 08:30 – USD PPI m/m: Measures the monthly change in prices received by domestic producers. It provides an early indication of inflation trends moving through the supply chain.
- Friday 08:30 – USD Core CPI m/m: Measures the monthly change in consumer prices excluding food and energy. It is a closely watched gauge of underlying consumer inflation.
- Friday 08:30 – USD Core CPI y/y: Measures the annual change in consumer prices excluding food and energy. It provides a broader view of persistent inflation trends.
- Friday 08:30 – USD CPI m/m: Measures the monthly change in overall consumer prices, including food and energy. It tracks near-term household inflation conditions.
- Friday 08:30 – USD CPI y/y: Measures the annual change in overall consumer prices. It is a broad measure of consumer inflation and purchasing-power pressures.
Conclusion:
The single most important event is Friday at 08:30, USD Core CPI y/y, alongside the broader CPI release set. Market momentum and volume often slow ahead of CPI, with increased volatility at release time.
For full details visit: Forex Factory EcoNews
Market News Summary:
Strong payrolls and the approaching August CPI report place inflation and Fed policy at the center of index-futures attention.
Primary Drivers & Risks:
- Primary Driver: August CPI and Fed decision
- Primary Risk: Inflation pressure and Hormuz disruption
Tone:
Cautious, with policy-sensitive equity and energy cross-currents.
Stock Market / ETFs / Indices:
Commentary on large-cap technology reflects increased selectivity after post-earnings analyst caution toward the Mag 7. Valuation concerns were also raised for broad S&P 500 and Nasdaq-linked ETFs, while momentum ETF performance remained strong on a trailing basis. Rapid AI-model releases highlight continued competition and elevated noise across AI-linked equities.
Geopolitical:
The Iran war continues to disrupt oil exports through the Strait of Hormuz, constraining OPEC+ influence over pricing and market share. The disruption remains an energy-supply and inflation-related cross-current for broader markets.
Oil / Energy:
OPEC+ agreed to keep October output policy unchanged after six consecutive monthly increases. The steady policy arrives alongside Strait of Hormuz export disruptions, keeping the supply backdrop in focus.
Gold / Metals:
Central-bank repatriation of gold from New York has renewed attention on safe-haven preferences and perceptions of U.S. financial-market security.
Fed / Financials:
August job gains exceeded estimates, reducing concern that tighter policy would damage the labor market. The August CPI report is the key near-term Fed input; commentary cites a 60% probability of a September rate hike following strong payroll data. Rising long-term rates have lifted median preferred-security yield-to-worst while credit spreads remain tight.
Macro / Other:
Raw sugar recorded its strongest monthly increase since October 2010 in August. Stronger El Niño conditions and weaker output in Europe, Brazil, and India have reduced global supply.
Conclusion:
August CPI and the Fed’s September policy decision are the main broad-market drivers. Strong payroll data has increased focus on inflation persistence and rate-hike pricing.
OPEC+ supply restraint and Strait of Hormuz disruptions keep energy markets exposed to geopolitical supply conditions. Large-cap technology caution, elevated index-ETF valuation concerns, and safe-haven gold flows add cross-currents for equity futures.
Market News Sentiment
Market News Articles: 7
- Neutral: 57.14%
- Negative: 28.57%
- Positive: 14.29%
Sentiment Summary: Market news sentiment is predominantly neutral at 57%, with 29% negative and 14% positive across seven articles.
Conclusion: Indices futures coverage reflects a neutral tone with negative articles outweighing positive articles.
GLD,Gold Articles: 1
- Neutral: 100.00%
Sentiment Summary: GLD/Gold coverage was 100% neutral across 1 article.
Conclusion: The limited gold-related news flow showed no directional sentiment bias relevant to indices futures day traders.
USO,Oil Articles: 3
- Neutral: 66.67%
- Negative: 33.33%
Sentiment Summary: USO and oil coverage was predominantly neutral (67%), with the remaining 33% negative across three articles.
Conclusion: The oil news tone was mainly neutral, with some negative coverage present.
SPY Weekly View
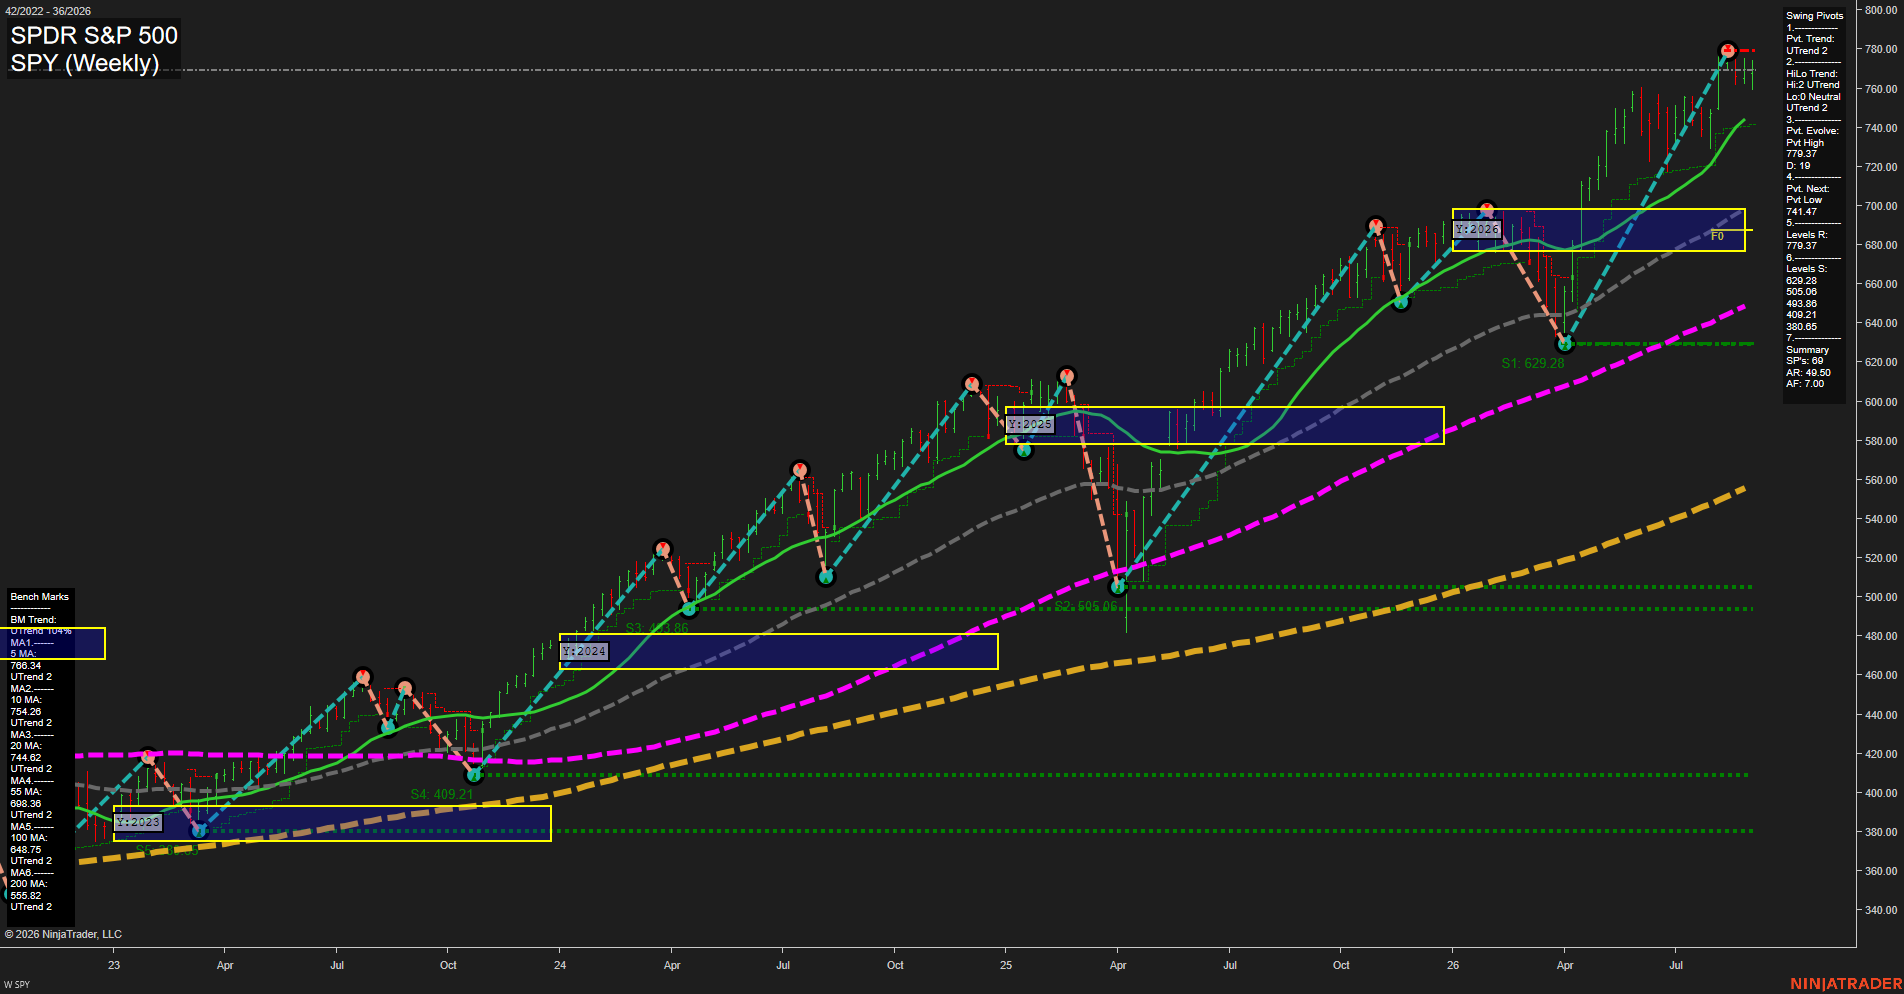
Overall Rating
- Short-Term: Bullish
- Intermediate-Term: Bullish
- Long-Term: Bullish.
Key Insights Summary
The weekly futures-equivalent structure remains broadly directional higher: price is holding above every benchmark average, the pivot and HiLo trends are both UTrend, and the 2026 yearly grid has been exceeded on the upside. The market is consolidating beneath the 779.37 swing-high resistance after a steep advance, producing smaller weekly bars and moderating momentum rather than a confirmed structural reversal. The 741.47 pivot-next level defines the near-term swing threshold, while the 20-week benchmark near 744.62 and the 55-week benchmark near 698.98 frame the more meaningful pullback structure. The larger sequence remains one of higher highs and higher lows, with the principal current theme being elevated-price consolidation near the upper extreme.
View charts on: AlphaWebTrader HTF Charts
QQQ Weekly View
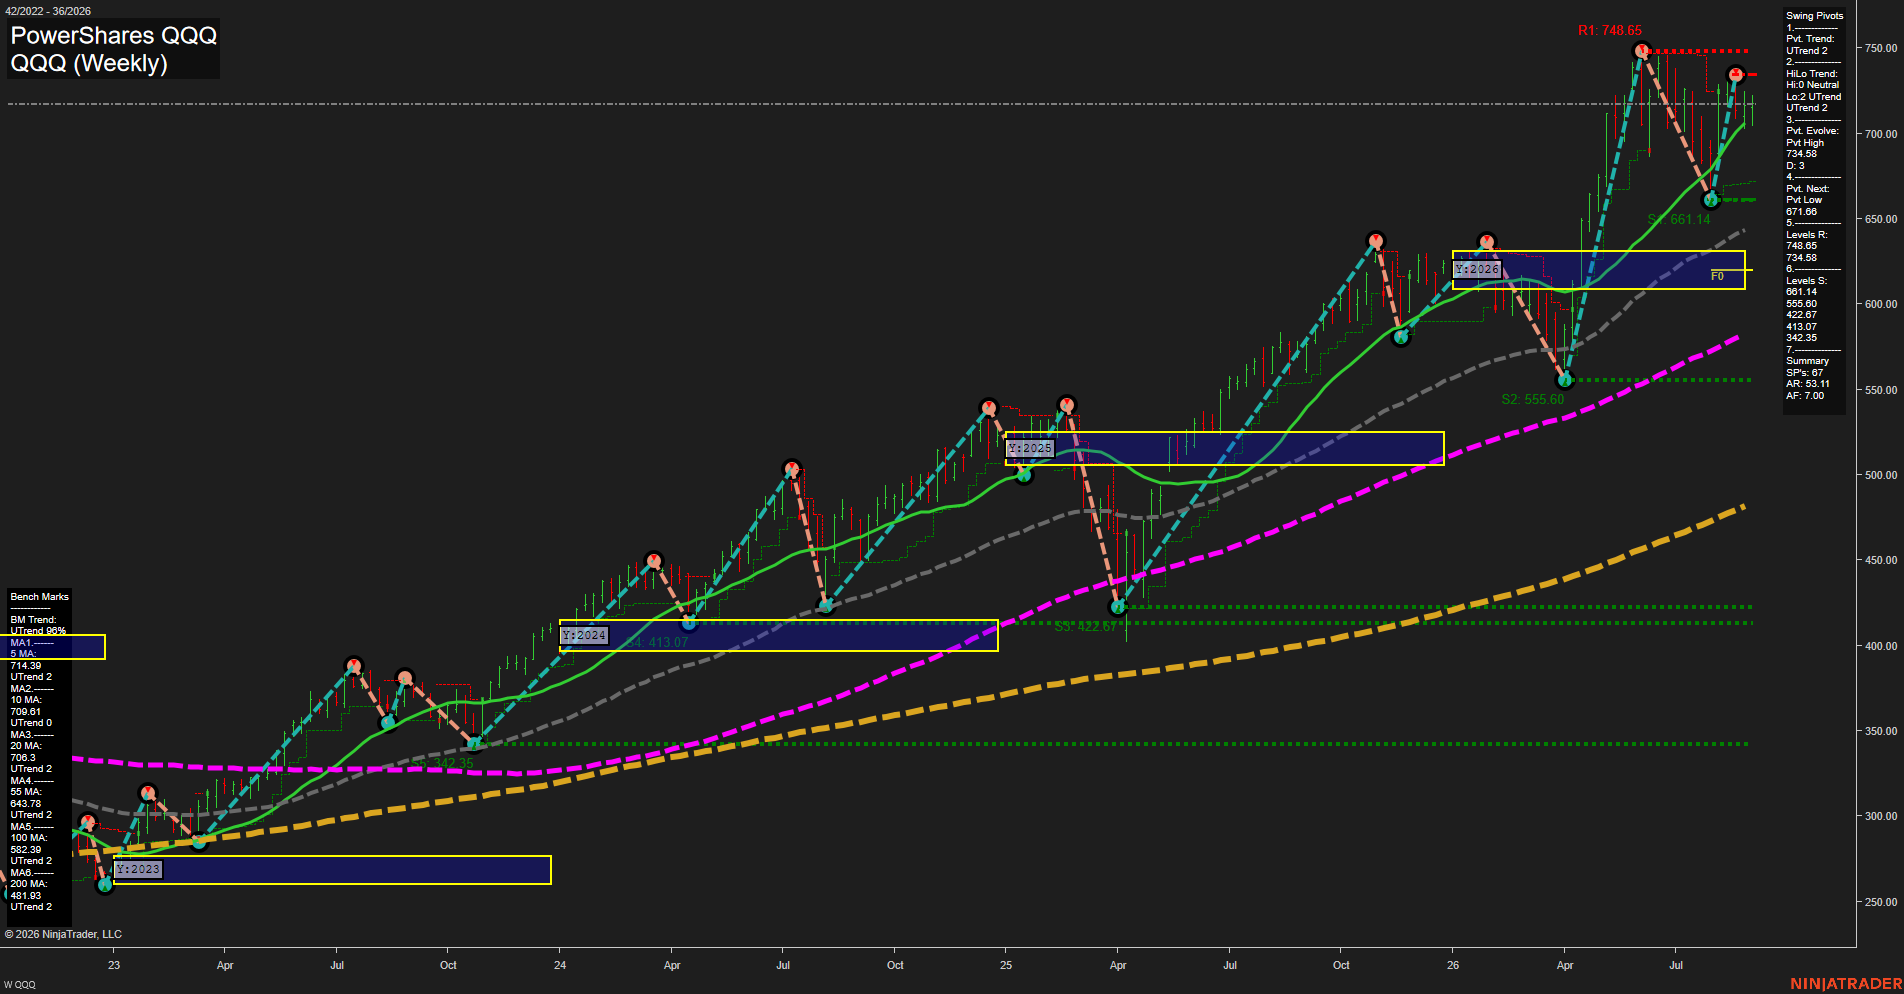
Overall Rating
- Short-Term: Bullish
- Intermediate-Term: Bullish
- Long-Term: Bullish.
Key Insights Summary
QQQ’s weekly structure remains broadly constructive from a futures swing-trader perspective, with price holding above every benchmark average and the moving-average alignment strongly rising. The market has recovered sharply from the 555.60 pivot low, formed higher lows, and is pressing the 734.58 pivot-high area beneath major resistance at 747.48. The short-term pivot trend and intermediate HiLo trend are both upward, while 671.68 defines the next opposite-pivot threshold. The current advance is fast and extended relative to the 20-week benchmark near 706.35, reflecting strong upside momentum and elevated weekly range potential. The yearly Fib position is bullish above its NTZ/F0% region, supporting the longer-term continuation backdrop; however, the nearby 734.58 to 747.48 zone remains the defining weekly test for whether the current rally develops into a fresh breakout or remains a high-level consolidation.
View charts on: AlphaWebTrader HTF Charts
USO Weekly View
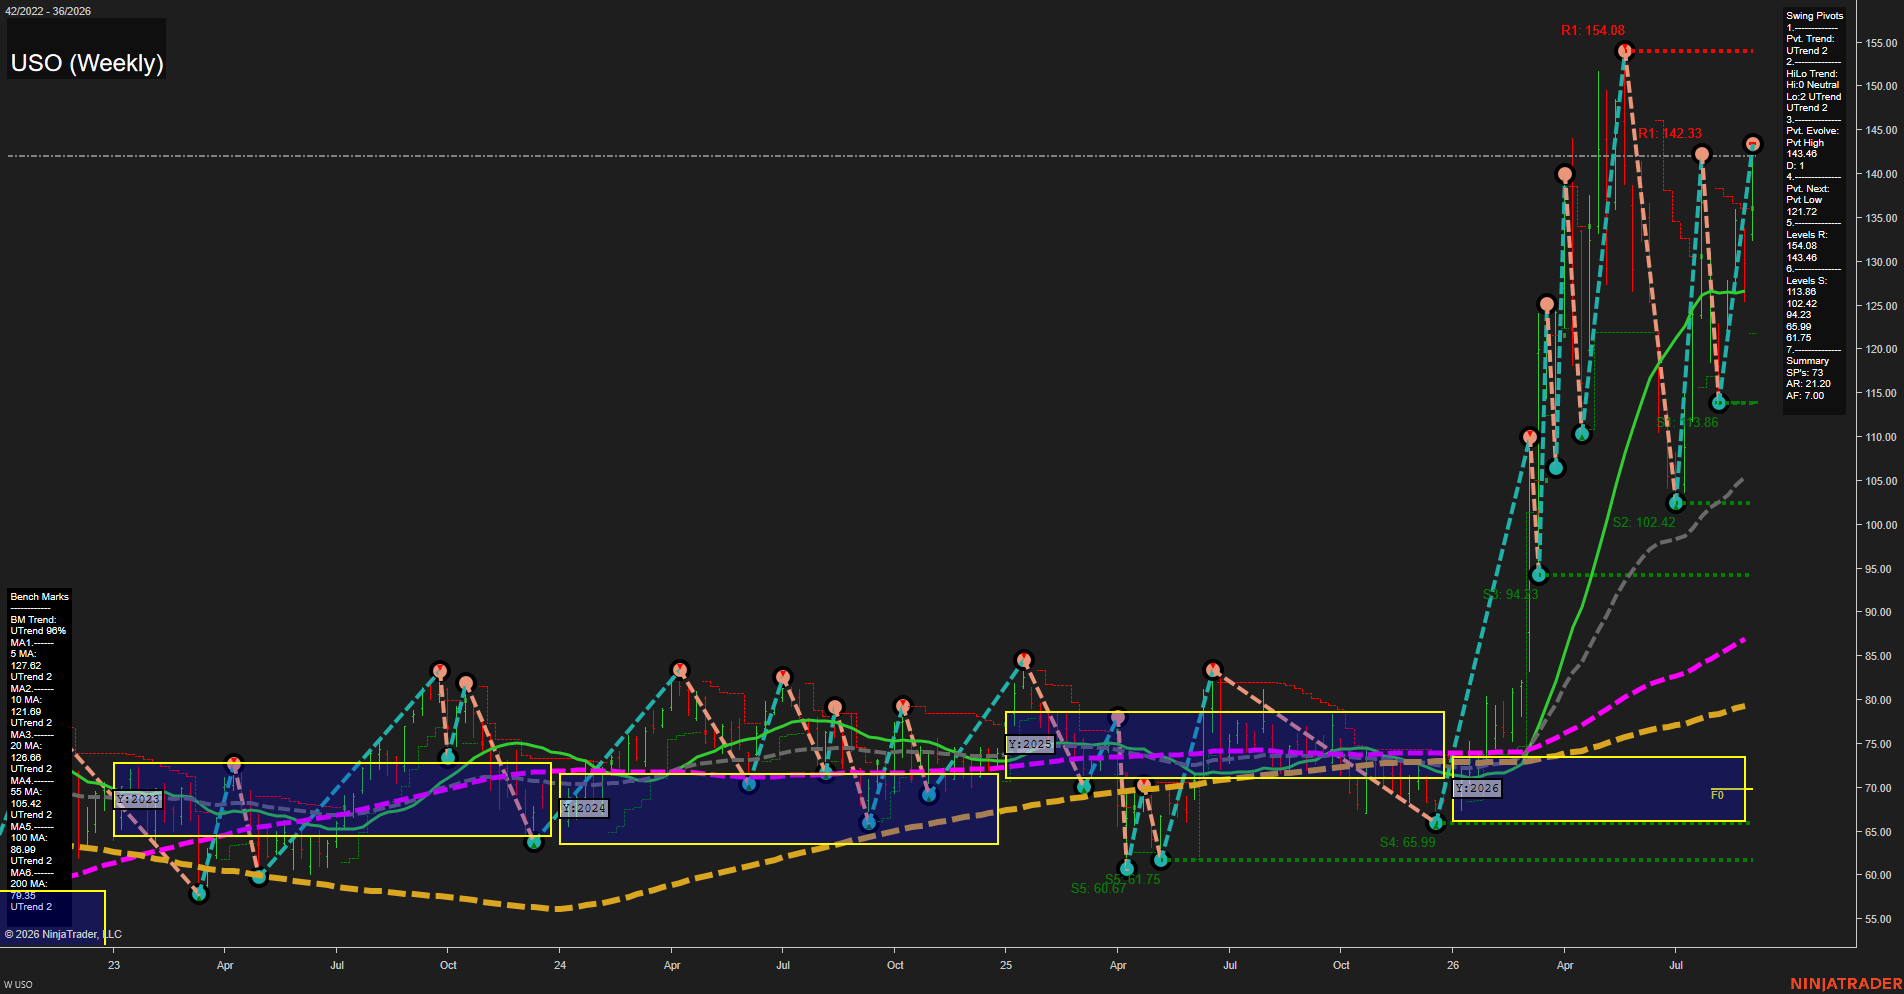
Overall Rating
- Short-Term: Bullish
- Intermediate-Term: Bullish
- Long-Term: Bullish.
Key Insights Summary
USO reflects a powerful, volatile crude-oil futures-style advance, with price substantially extended above every weekly benchmark and the yearly NTZ. The pivot structure remains in an UTrend on both short-term and intermediate-term readings, marked by higher swing lows and a renewed test of the 143.48 pivot-high area. The 154.08 swing high is the principal overhead reference, while 121.72 represents the pivot reversal threshold and 113.86 is the nearest established structural support. Momentum is fast and weekly ranges are large, characterizing an impulsive continuation phase rather than a low-volatility consolidation. The broad moving-average alignment, from 5 through 200 periods, confirms a strongly positive multi-timeframe trend condition.
View charts on: AlphaWebTrader HTF Charts
GLD Weekly View
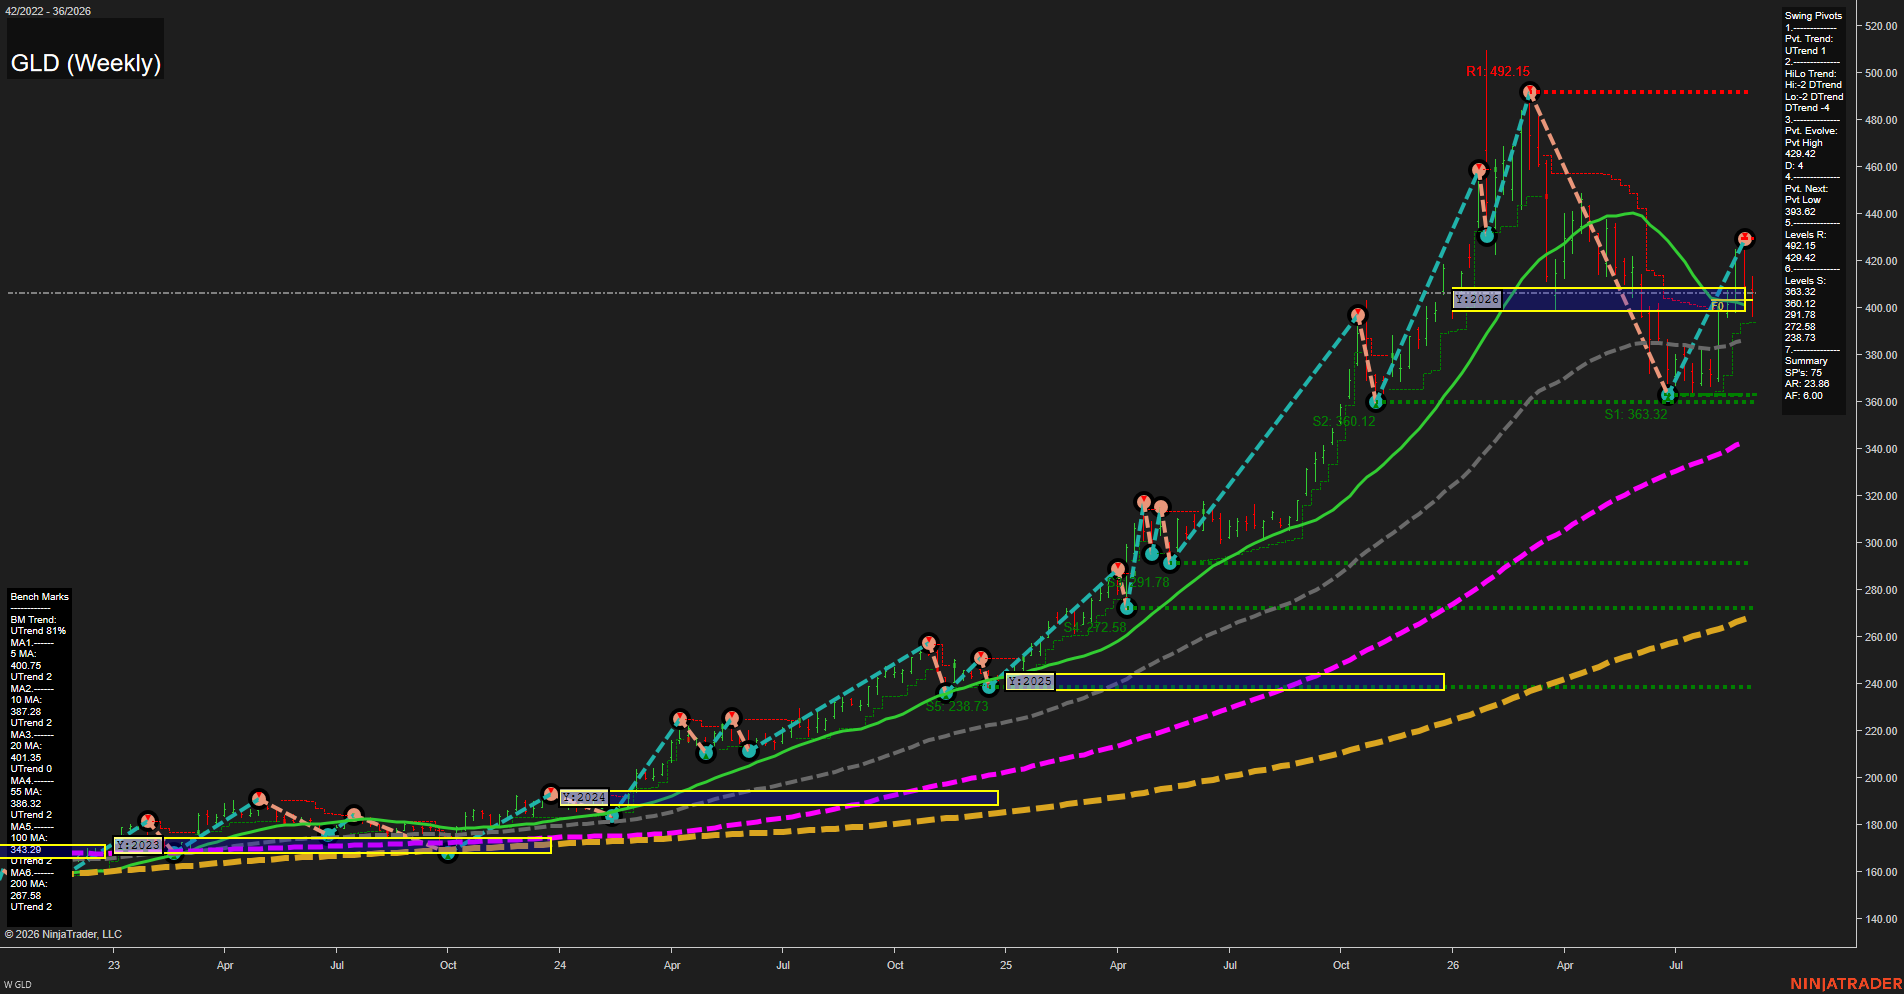
Overall Rating
- Short-Term: Bullish
- Intermediate-Term: Neutral
- Long-Term: Bullish.
Key Insights Summary
GLD’s weekly structure remains broadly constructive from a futures swing-trader perspective: price has recovered above the rising 5, 10, 20, and 55-week benchmarks after the sharp decline into the 360 area. The current short-term pivot trend is up, although the intermediate HiLo sequence remains down because the 429.42 pivot high has not been exceeded. The 360.12 to 363.32 pivot-support band defines the major recovery low, while 429.42 is the nearby structural ceiling and 492.15 remains the larger upside swing reference. The yearly grid shows price holding above its F0% area and near the upper NTZ boundary, consistent with a long-term bullish trend but a more rotational, volatile intermediate phase following the prior selloff from the 492 area.
View charts on: AlphaWebTrader HTF Charts