
U.S. stocks and metals fell as strong August jobs data lifted Treasury yields and Fed rate-hike pricing, while oil held firm on supply risks.
Fundamentals: U.S. equities closed lower after August payrolls reinforced expectations for higher policy rates, lifting Treasury yields and the dollar. The Dow, S&P 500 and Nasdaq declined, while gold and silver came under pressure. Oil remained supported by lower U.S. inventories, tight physical markets and Middle East supply concerns, with inflation data and trade tensions also in focus.
Technicals: U.S. market leadership was mixed at the close, with gains in Meta and Nvidia offset by declines in Apple, Tesla and bitcoin-linked ETF IBIT. ES, Nasdaq and Dow futures retained bullish multi-timeframe structures but were consolidating near resistance. Russell 2000 signals were mixed, while EMD and FDAX showed short-term weakness despite longer-term constructive trends.
After Market Close daily snapshot: market news summary and sentiment, major ETFs, Magnificent 7 analysis, Indices Futures Higher Time Frame Analysis, and E-mini S&P500, Nasdaq 100, NYMEX Crude, Gold Futures Daily Chart analysis.
As of: September 4, 2026 05:00 CT
Market News Summary:
Strong August U.S. hiring lifted Treasury yields and Fed rate-hike pricing, pressuring equity indices and precious metals.
Primary Drivers & Risks:
- Primary Driver: Strong jobs data lifts yields
- Primary Risk: Higher-for-longer rates and inflation
Tone:
Risk-off across stocks, bonds, and metals.
Stock Market / ETFs / Indices:
U.S. equities closed lower after the employment report increased September Fed-hike bets. The Dow fell 0.5% (279.20 points), the S&P 500 lost 0.38%, and the Nasdaq Composite declined 0.3%; the S&P 500 retained a broader bullish technical outlook despite the pullback.
Geopolitical:
Middle East tensions supported tight physical oil markets, while the Iran war remained part of the uncertainty backdrop for hiring. President Trump also intensified pressure on the Fed and raised trade-war threats tied to U.S. trade deficits.
Oil / Energy:
WTI tested $91 following its strongest week since mid-July, supported by falling U.S. inventories and Middle East supply risks. Brent consolidated after a strong advance, while U.S. diesel prices reached a record high.
Gold / Metals:
Gold and silver sold off as stronger payrolls pushed up yields and the U.S. dollar. Gold fell toward its 50-day EMA and later recovered part of the jobs-driven decline; the two-year Treasury yield reached its highest level since January 2025.
Fed / Financials:
The 162,000-job gain and 4.1% unemployment rate reinforced market pricing for higher policy rates. Rising real and nominal yields reflected a higher repricing of the neutral rate, while inflation expectations remained anchored; PPI and CPI data remain central to the Fed-rate narrative.
Macro / Other:
Headline August CPI was cited at 3.6% in a discussion of higher energy costs, while super-core PCE inflation at 3.9% highlighted persistent wage-driven and structural price pressures. PC makers faced higher memory-chip costs linked to AI infrastructure buildout.
Conclusion:
Strong U.S. labor data and rising Treasury yields drove the session’s cross-asset moves. Rate-hike repricing weighed on U.S. stock indices and precious metals.
Oil remained supported by inventory declines, tight supply conditions, and Middle East risks. Inflation data, elevated energy prices, trade-policy tensions, and rich equity valuations remain cross-currents.
Market News Sentiment
Market News Articles: 43
- Neutral: 55.81%
- Negative: 23.26%
- Positive: 20.93%
Sentiment Summary: Of 43 market news articles, 56% were neutral, 23% negative, and 21% positive, indicating predominantly neutral coverage with negative articles slightly exceeding positive articles.
Conclusion: News sentiment for indices futures day traders is broadly neutral with a modest negative tilt.
GLD,Gold Articles: 15
- Positive: 40.00%
- Negative: 33.33%
- Neutral: 26.67%
Sentiment Summary: Gold-related coverage is mixed, with 40% positive, 33% negative, and 27% neutral articles across 15 items.
Conclusion: The modest positive tilt in gold sentiment indicates balanced safe-haven-related news flow for indices futures day traders.
USO,Oil Articles: 7
- Positive: 42.86%
- Neutral: 28.57%
- Negative: 28.57%
Sentiment Summary: USO/Oil coverage is moderately positive, with 43% positive, 29% neutral, and 29% negative articles across 7 reports.
Conclusion: Oil-related news tone is mixed but slightly positive, providing a modestly supportive sentiment backdrop for indices futures monitoring energy-sector influence.
Market Data Snapshot
ETF Snapshot of major stock market ETFs, Mag7, and others as of: September 4, 2026 05:00
Top Movers & Losers
- META 616.77 Bullish 1.00% ▲
- NVDA 230.36 Bullish 0.84% ▲
- IWM 296.01 Bullish 0.28% ▲
- IBIT 45.23 Bearish -2.42% ▼
- AAPL 319.97 Bearish -2.51% ▼
- TSLA 354.08 Bearish -5.92% ▼
Major Index ETFs: SPY, QQQ, DIA, IWM, IJH
- IWM 296.01 Bullish 0.28% ▲
- QQQ 718.96 Bullish 0.18% ▲
- IJH 75.85 Bullish 0.13% ▲
- SPY 770.19 Bearish -0.39% ▼
- DIA 534.08 Bearish -0.53% ▼
Mixed index ETF snapshot: IWM is the most bullish mover at +0.28%, followed by QQQ at +0.18% and marginally bullish IJH at +0.13%. DIA is the most bearish mover at -0.53%, while SPY is bearish at -0.39%.
Mag 7 Stocks: AAPL, MSFT, GOOG, AMZN, META, NVDA, TSLA
- META 616.77 Bullish 1.00% ▲
- NVDA 230.36 Bullish 0.84% ▲
- AMZN 258.51 Bearish -0.15% ▼
- GOOG 335.31 Bearish -1.11% ▼
- MSFT 499.70 Bearish -2.04% ▼
- AAPL 319.97 Bearish -2.51% ▼
- TSLA 354.08 Bearish -5.92% ▼
Mixed: META is the most bullish mover at +1.00%, followed by NVDA at +0.84%. AMZN is marginally Bearish at -0.15%, while GOOG declined -1.11%, MSFT -2.04%, and AAPL -2.51%. TSLA is the most bearish mover, down -5.92%.
Cross-Market ETFs: TLT, GLD, USO, IBIT
- TLT 82.21 Bullish 0.17% ▲
- USO 141.96 Bearish -0.09% ▼
- GLD 406.77 Bearish -0.84% ▼
- IBIT 45.23 Bearish -2.42% ▼
Mixed: TLT is the most bullish mover, up +0.17%. USO is marginally Bearish at -0.09%, while GLD is Bearish at -0.84%. IBIT is the most bearish mover, down -2.42%.
ETF, Mag7, and Cross-Market ETF Insights
Overall Tone
Overall tone is Mixed, with selective Bullish leadership in META and NVDA while broad index and several mega-cap declines remain Bearish.
Equity ETFs and Mag7:
Major Index ETFs were Mixed: IWM +0.28%, QQQ +0.18%, and IJH +0.13% were modestly Bullish, while SPY -0.39% and DIA -0.53% were Bearish. Mag7 action was selective, led by META at +1.00%, the most bullish mover, and NVDA at +0.84%; TSLA at -5.92% was the most bearish mover, alongside AAPL -2.51%, MSFT -2.04%, GOOG -1.11%, and AMZN -0.15%.
Cross-Market ETFs:
Cross-market ETFs were Mixed, with TLT marginally Bullish at +0.17%, while USO was near-flat and Bearish at -0.09%. TLT was the most bullish mover, while IBIT at -2.42% was the most bearish mover; GLD also declined -0.84%, showing Bearish pressure in both bitcoin exposure and gold despite modest strength in Treasuries.
Futures Indices – Higher Time Frame Analysis
Summary of the current state of US Indices Futures based on higher time-frame (HTF) technical analysis as of: 2026-09-04: 17:00 CT.
US Indices Futures
- ES YSFG/MSFG/WSFG upward, above rising benchmarks, UTrend; resistance 7782.50/7838.50, support 7618.50 then 7433.00.
- NQ YSFG/MSFG/WSFG upward, above benchmarks; weekly higher pivot high, daily DTrend below 29718.75; resistance 29811.50/30343.00, support 28927.25/27838.00.
- YM YSFG/MSFG/WSFG upward, above rising benchmarks; short-term UTrend, intermediate high below 54884; resistance 53862-54884, support 52915/52720/52488.
- EMD YSFG/MSFG above F0%, WSFG below F0%; below short benchmarks, short-term DTrend; resistance 3793.3-3804.7/3923.6, support 3713.8/3692.9.
- RTY YSFG/MSFG upward, WSFG below F0%; mixed short benchmarks and pivots; resistance 2983.3/3079.9, support 2914.5-2902.3 then 2895.1.
- FDAX YSFG upward, MSFG/WSFG below F0%; weekly uptrend versus daily DTrend; resistance 26207/26665, support 25739/25165.
Overall State
- Short-Term: Neutral
- Intermediate-Term: Bullish
- Long-Term: Bullish
Conclusion
ES, NQ, and YM retain aligned bullish HTF benchmark and Fib-grid structures, consolidating below pivot-high resistance. EMD and RTY show pullback or mixed short-term conditions within broader advancing structures. FDAX maintains a bullish yearly and weekly backdrop while daily benchmarks, pivots, MSFG, and WSFG remain corrective. Long-term directional correlation is broadly upward, with near-term dispersion concentrated in EMD, RTY, and FDAX.
Note: Intra-day counter-trend pullbacks or retracements may occur, HTF is context for informational usage and market structure. Glossary: Session Fib Grids periods of YSFG:’Yearly’, MSFG:’Monthly’, WSFG:’Weekly’
For full details visit: AlphaWebTrader Technicals
ES Daily View
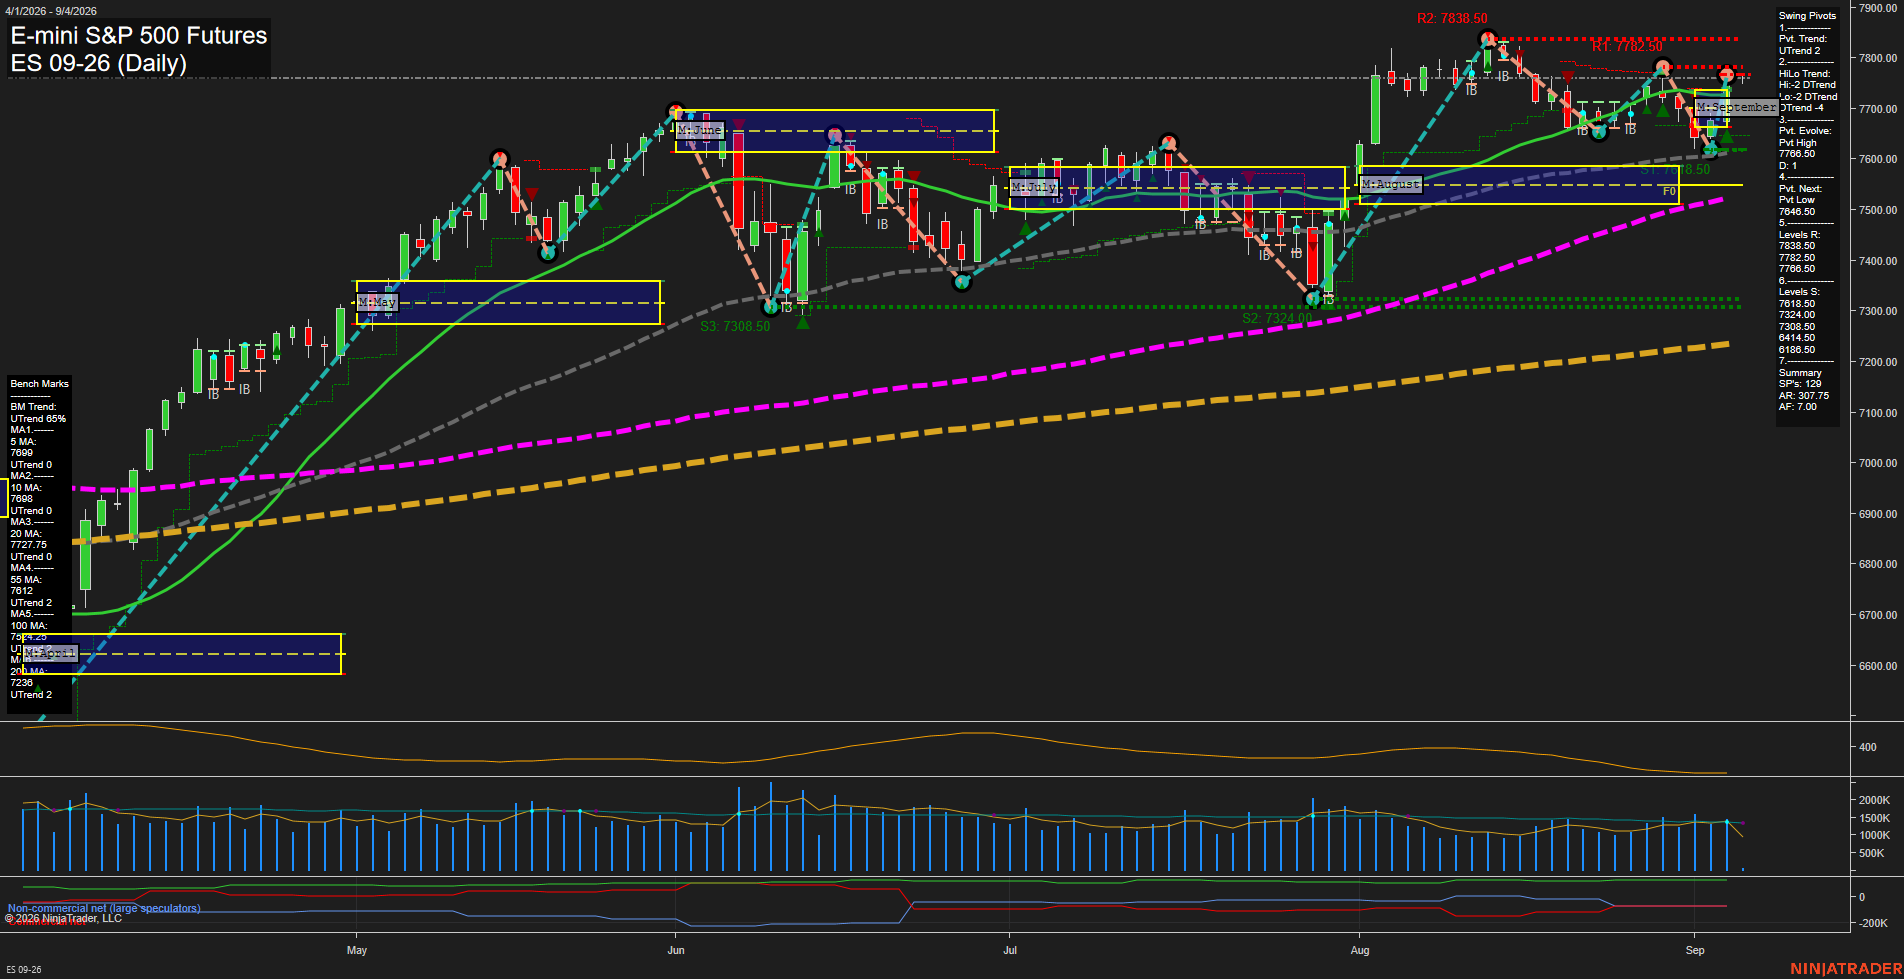
Overall Rating
- Short-Term: Bullish
- Intermediate-Term: Bullish
- Long-Term: Bullish.
Key Insights Summary
ES maintains a broad higher-high and higher-low structure, with price above every benchmark moving average and all benchmark trends rising. Short-term action is consolidating in small-range bars near the 7766.50 to 7782.50 pivot-resistance zone after the August advance. The active pivot structure remains in UTrend, while the September MSFG and weekly grid both retain an upward price bias. Resistance is concentrated at 7782.50 and 7838.50, while 7618.50 is the nearest notable pivot-support reference. ATR has eased from prior levels, consistent with slower momentum and a tighter, choppier consolidation beneath the recent highs.
View charts on: AlphaWebTrader HTF Charts
NQ Daily View
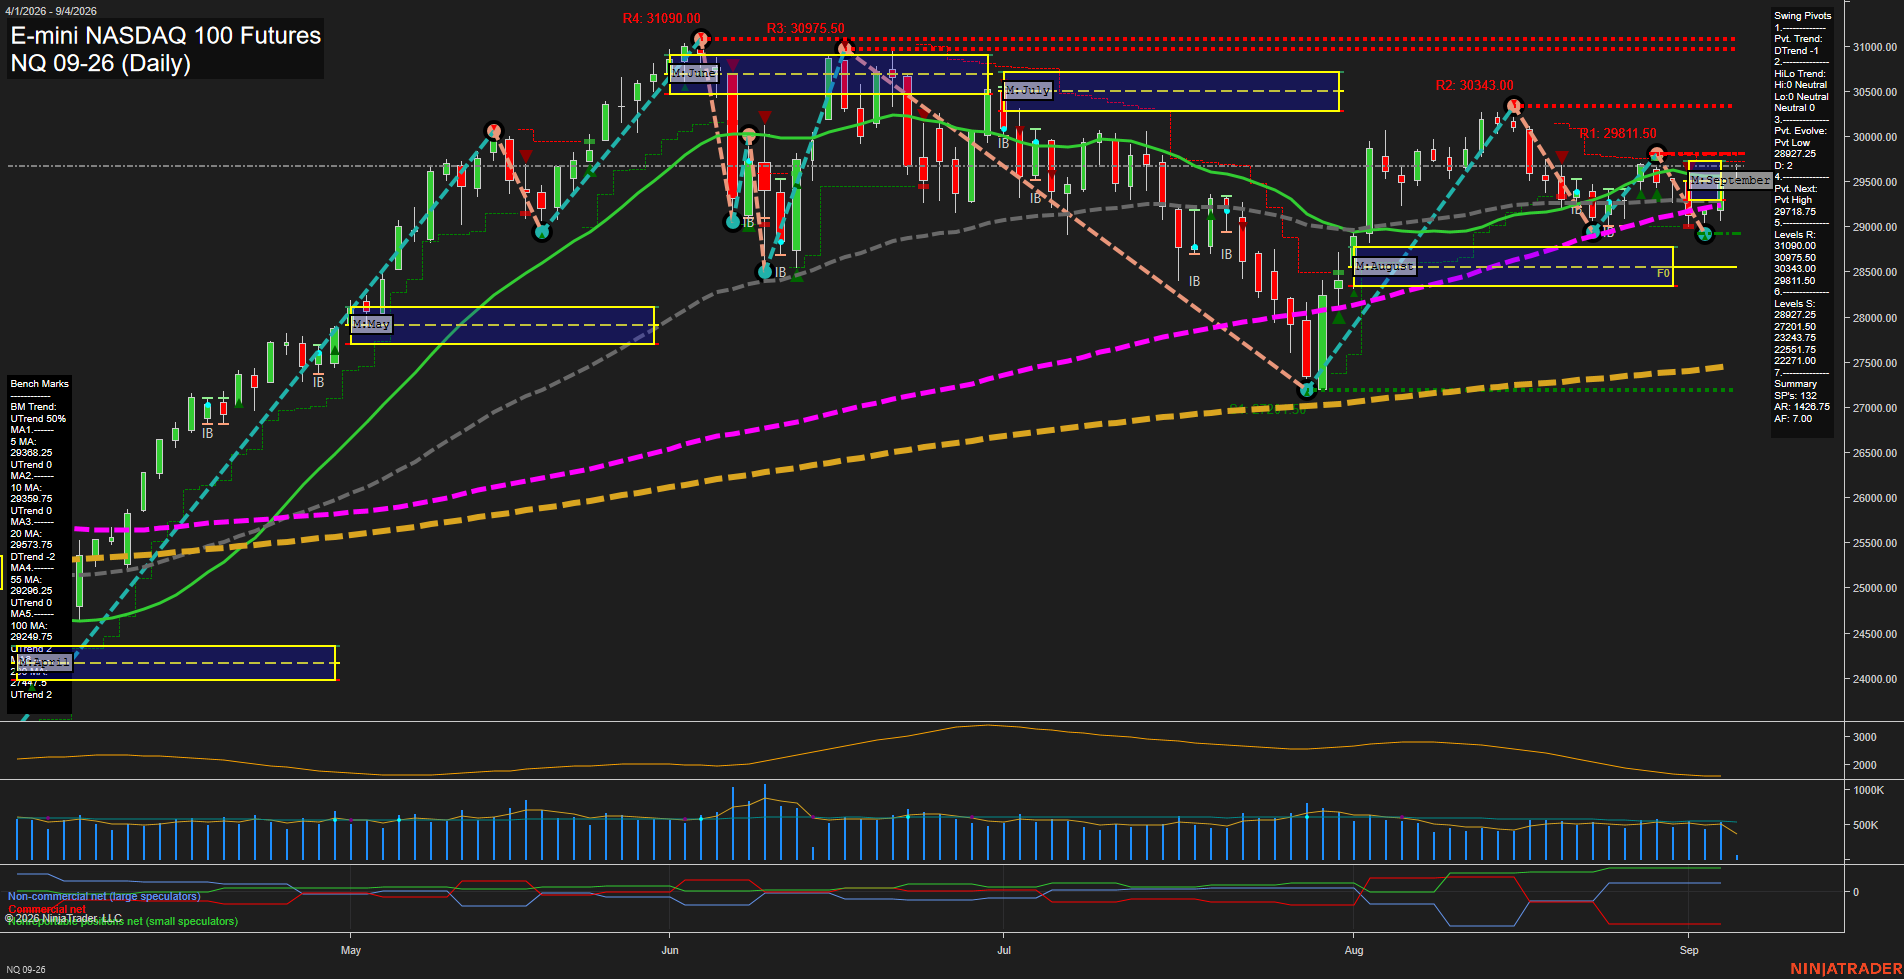
Overall Rating
- Short-Term: Bullish
- Intermediate-Term: Bullish
- Long-Term: Bullish.
Key Insights Summary
Price remains above the weekly and monthly F0% references and above every displayed benchmark average, preserving the broader rising structure. The recent recovery from the 28927.25 pivot low has restored the short-term moving-average alignment, although the active pivot trend remains DTrend until price establishes a new pivot high above 29718.75. The 29811.50 resistance area is the immediate overhead pivot barrier, followed by 30343.00, while 28927.25 is the key structural support. Daily volatility and volume participation have moderated from prior expansion periods, characterizing the current advance as a rebound within a still-active consolidation beneath the late-August high zone rather than a confirmed breakout continuation.
View charts on: AlphaWebTrader HTF Charts
CL Daily View
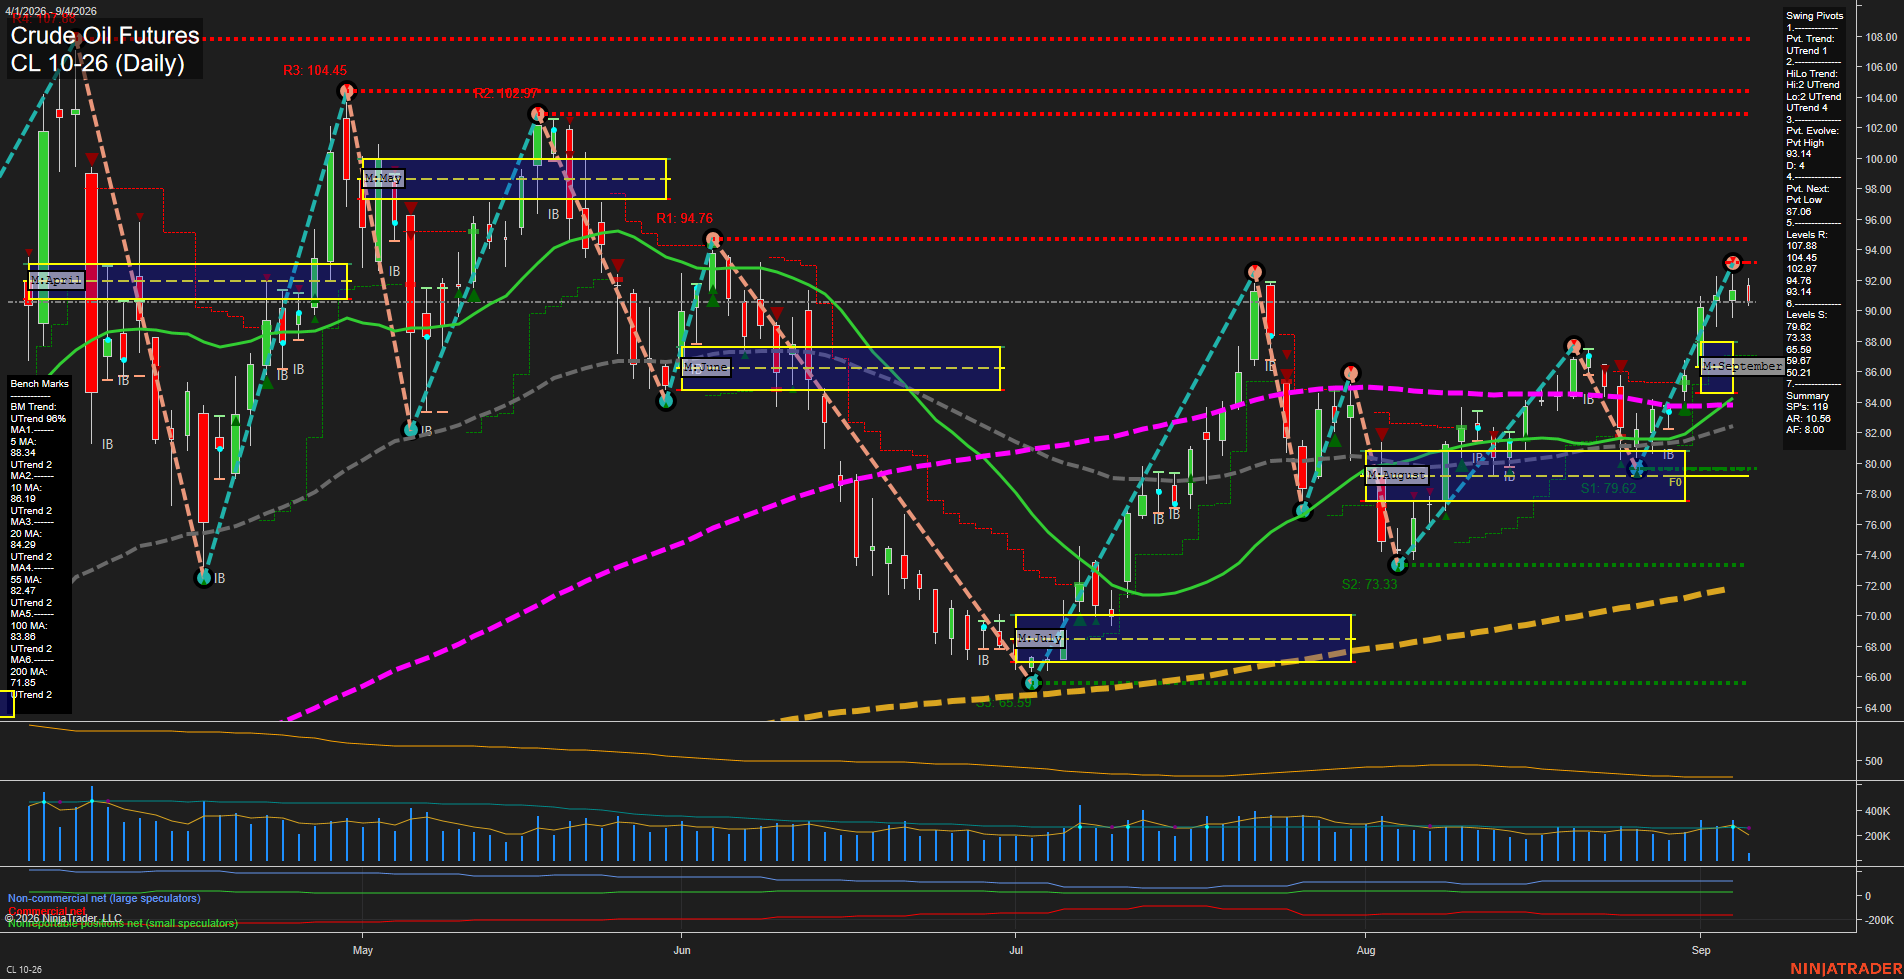
Overall Rating
- Short-Term: Bullish
- Intermediate-Term: Bullish
- Long-Term: Bullish.
Key Insights Summary
CL is in a broad multi-timeframe advance, with price above every benchmark average and all benchmark trends rising. The sharp late-August rally produced fast momentum and carried price toward the 93.14 evolving pivot high; 94.76 is the next prominent overhead pivot resistance. The 87.06 pivot-next level defines the nearest short-term structural retracement threshold, while 79.62 remains the major lower swing support. Price is above the weekly and monthly F0%/NTZ reference areas, confirming upside session-grid alignment, although the recent approach to pivot resistance reflects an extended, higher-volatility phase rather than a low-momentum consolidation.
View charts on: AlphaWebTrader HTF Charts
GC Daily View
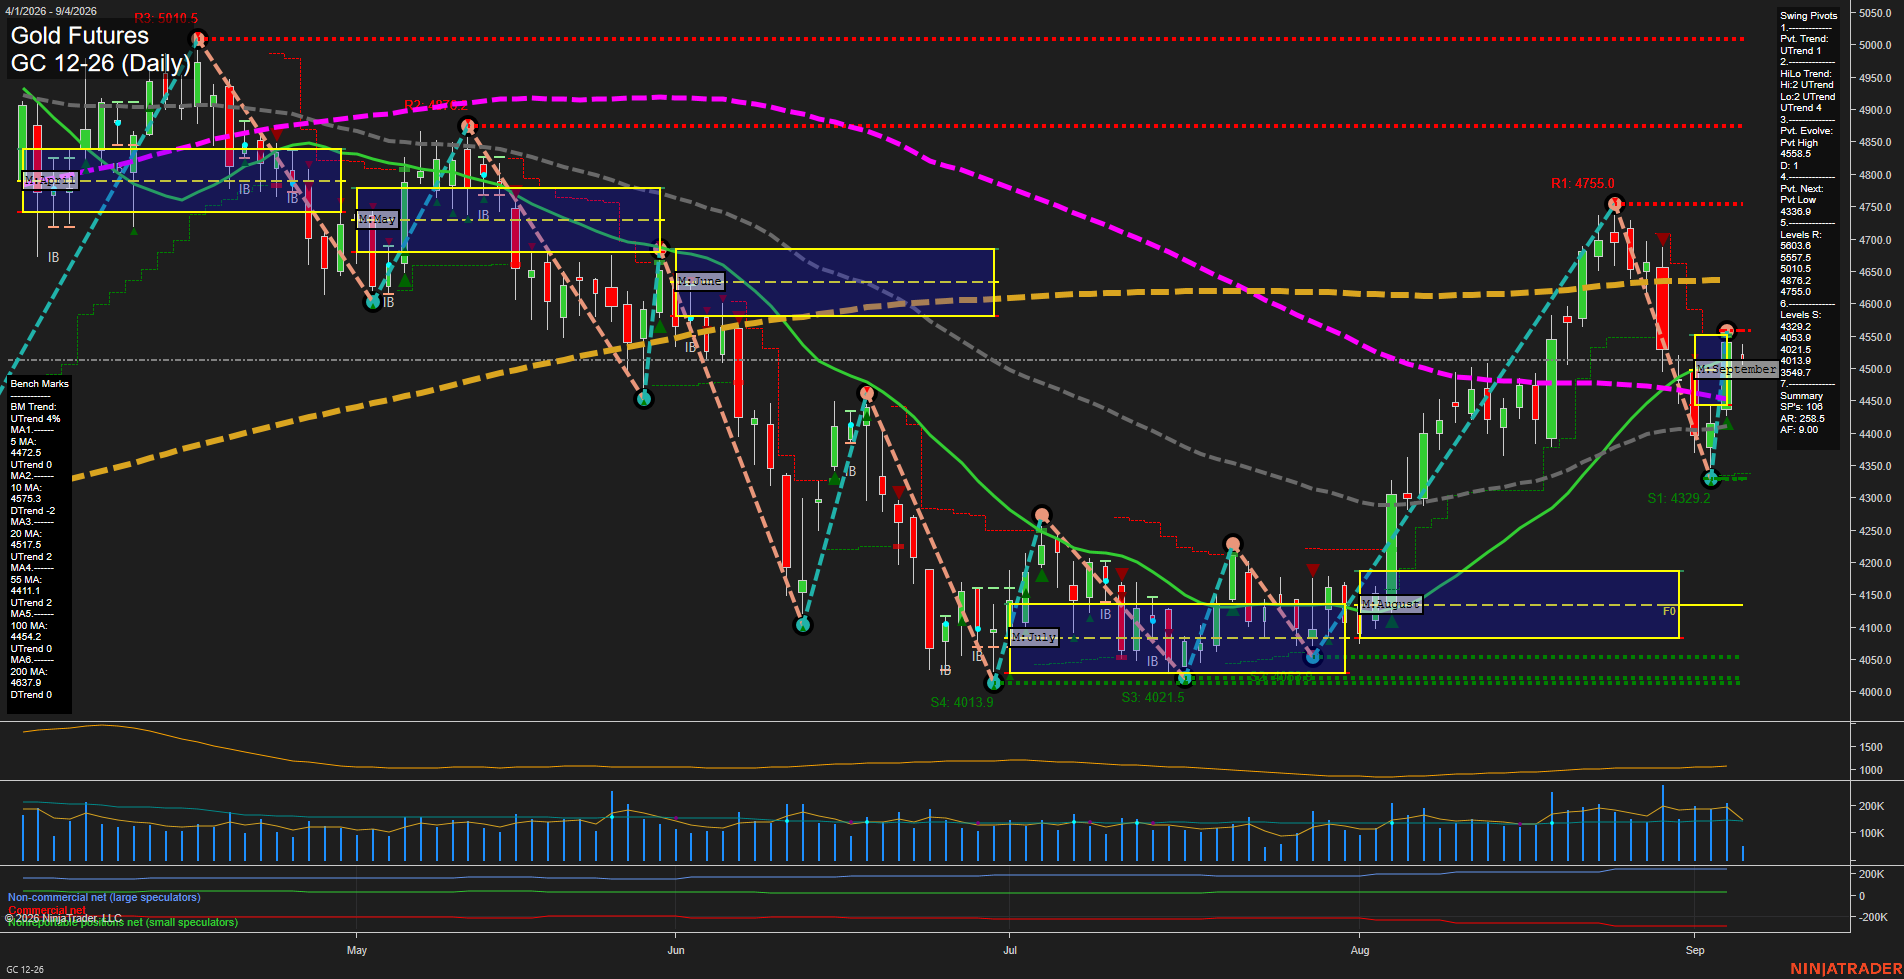
Overall Rating
- Short-Term: Bullish
- Intermediate-Term: Bullish
- Long-Term: Bearish.
Key Insights Summary
Gold is rebounding sharply from the 4329.2 swing-low area, restoring the short-term pivot UTrend and retaining an intermediate HiLo UTrend. Price is holding above the rising 55-day benchmark and near the rising 100-day benchmark, while the 5-day average remains below price after the recent recovery. The advance is occurring beneath the declining 10-day average, the 20-day benchmark, and major 4755.0 pivot resistance, defining the current move as a fast countertrend recovery within a still-weaker longer-term structure. The 200-day benchmark remains down at 4637.9 and the yearly grid remains below its F0% area, while elevated volatility reflects broad daily swings and a choppy recovery phase.
View charts on: AlphaWebTrader HTF Charts