U.S. stocks closed higher as chips and AI led gains, while weak jobs data, softer inflation signals, Fed minutes, and oil moves shaped sentiment.
Fundamentals: U.S. equity markets finished higher, with chipmakers and AI-linked names leading gains and the Nasdaq outperforming. Weak June jobs data, softer inflation readings, and easing oil prices supported rate-sensitive assets, while traders also watched Fed minutes, earnings, valuation concerns in large-cap technology, and mixed signals from the broader macro backdrop.
Technicals: Market action showed a split between short-term pullbacks and broader bullish trend structures. TSLA, IBIT, and META led ETF movers higher, while MSFT and TLT were lower. Futures updates showed the S&P 500, Dow, Russell 2000, and DAX holding constructive higher-timeframe trends, even as Nasdaq contracts and some session grids stayed under short-term pressure.
After Market Close daily snapshot: market news summary and sentiment, major ETFs, Magnificent 7 analysis, Indices Futures Higher Time Frame Analysis, and E-mini S&P500, Nasdaq 100, NYMEX Crude, Gold Futures Daily Chart analysis.
As of: July 6, 2026 05:00 CT
Market News Summary:
U.S. equity markets finished the session higher with chips and AI names leading, while weak labor data, softer inflation signals, and Fed minutes kept rate sensitivity in focus.
Primary Drivers & Risks:
- Primary Driver: AI-led equity strength
- Primary Risk: Fed and growth uncertainty
Tone:
Mixed to constructive, with rate-sensitive crosscurrents.
Stock Market / ETFs / Indices:
U.S. stocks were mixed intraday but finished with gains led by chipmakers and the Nasdaq. The S&P 500 posted its best week in two months, while traders focused on Fed minutes, earnings, AI leadership, and elevated valuations in large-cap technology.
Geopolitical:
Oil pricing commentary referenced conflict-related shipping and Strait of Hormuz route considerations, with Saudi Aramco adjusting prices to attract Asian buyers amid war-related disruptions.
Oil / Energy:
Crude prices cooled, with reports pointing to supply glut pressure and Saudi discounts to Asian buyers. U.S. Strategic Petroleum Reserve crude stocks also fell to the lowest level since 1983.
Gold / Metals:
Gold moved higher on weak June jobs data, a softer dollar, easing oil prices, and cooler inflation expectations. Later commentary noted some profit-taking after the rebound, though gold ETFs remained in focus.
Fed / Financials:
Weak labor data and easing inflation readings increased attention on the Fed’s path, with upcoming FOMC minutes viewed as important for policy signals. Fixed income strategy commentary centered on cooling oil prices versus still-elevated inflation concerns.
Macro / Other:
June jobs growth was weak, ISM Services PMI eased, and prices-paid data softened, while services activity stayed resilient. The mix reinforced a softer growth backdrop alongside persistent inflation worries and a defensive portfolio tilt in some commentary.
Conclusion:
Primary support came from chipmakers, AI-related strength, and improved sentiment around rate-sensitive assets after weak jobs data and softer inflation signals. The S&P 500’s recent gains and the Nasdaq’s leadership kept equities firm into the close.
Risks remained tied to Fed minutes, valuation concerns in AI-linked names, and the uneven macro backdrop. Oil price weakness, ongoing inflation concerns, and leverage or concentration risks in select markets added cross-currents for index futures traders.
Market News Sentiment
Market News Articles: 43
- Neutral: 53.49%
- Negative: 37.21%
- Positive: 9.30%
Sentiment Summary: Market news coverage for indices futures is mostly neutral at 53%, with negative headlines at 37% and positive headlines at 9% across 43 articles.
Conclusion: The news flow is mixed to neutral, with negative coverage notably higher than positive coverage.
GLD,Gold Articles: 10
- Positive: 80.00%
- Negative: 20.00%
Sentiment Summary: Gold-related articles were 80% positive and 20% negative across 10 articles, indicating broadly constructive sentiment.
Conclusion: The snapshot shows a positive bias in gold sentiment with limited negative coverage.
USO,Oil Articles: 11
- Negative: 72.73%
- Positive: 18.18%
- Neutral: 9.09%
Sentiment Summary: USO/oil news flow is predominantly negative, with 73% negative, 18% positive, and 9% neutral articles across 11 items.
Conclusion: The tone of the oil-related news snapshot is mostly negative, with limited positive coverage and a small neutral share.
Market Data Snapshot
ETF Snapshot of major stock market ETFs, Mag7, and others as of: July 6, 2026 05:00
Top Movers & Losers
- TSLA 419.77 Bullish 6.69% ▲
- IBIT 36.12 Bullish 3.58% ▲
- META 600.29 Bullish 2.98% ▲
- USO 104.35 Bullish 0.36% ▲
- TLT 85.45 Bearish -0.07% ▼
- MSFT 386.74 Bearish -0.96% ▼
Major Index ETFs: SPY, QQQ, DIA, IWM, IJH
- QQQ 722.82 Bullish 1.43% ▲
- SPY 751.28 Bullish 0.87% ▲
- IWM 298.90 Bullish 0.44% ▲
- IJH 76.42 Bullish 0.43% ▲
- DIA 530.09 Bullish 0.42% ▲
Major index ETFs were uniformly Bullish, led by QQQ at +1.43% as the most bullish mover, followed by SPY at +0.87%. The least positive movers were DIA at +0.42% and IJH at +0.43%, while IWM also held a modest Bullish gain at +0.44%.
Mag 7 Stocks: AAPL, MSFT, GOOG, AMZN, META, NVDA, TSLA
- TSLA 419.77 Bullish 6.69% ▲
- META 600.29 Bullish 2.98% ▲
- GOOG 364.90 Bullish 2.45% ▲
- AAPL 312.66 Bullish 1.31% ▲
- AMZN 244.16 Bullish 0.61% ▲
- NVDA 195.55 Bullish 0.37% ▲
- MSFT 386.74 Bearish -0.96% ▼
Mixed Mag7 tone, led by TSLA as the most bullish mover at +6.69%, followed by META at +2.98% and GOOG at +2.45%; AAPL at +1.31%, AMZN at +0.61%, and NVDA at +0.37% were firmer, while MSFT was the most bearish mover at -0.96%.
Cross-Market ETFs: TLT, GLD, USO, IBIT
- IBIT 36.12 Bullish 3.58% ▲
- GLD 382.13 Bullish 1.06% ▲
- USO 104.35 Bullish 0.36% ▲
- TLT 85.45 Bearish -0.07% ▼
Mixed snapshot: IBIT is the most bullish mover at +3.58%, with GLD also bullish at +1.06% and USO mildly bullish at +0.36%. TLT is the most bearish mover, but only marginally at -0.07%, making it near-flat.
ETF, Mag7, and Cross-Market ETF Insights
Overall Tone
Mixed-to-Bullish, with a clear risk-on tilt as equities and high-beta growth names are mostly positive, while the only meaningful drag is isolated in MSFT.
Equity ETFs and Mag7:
The major index ETFs are broadly aligned to the upside, led by QQQ +1.43% versus steadier gains in SPY +0.87%, with DIA +0.42%, IWM +0.44%, and IJH +0.43% all modestly positive. Mag7 participation is more selective: TSLA is the most bullish mover at +6.69%, followed by META +2.98% and GOOG +2.45%, while MSFT is the only bearish name at -0.96%. Overall, equities are constructive but leadership is concentrated in growth and momentum rather than broad uniform strength.
Cross-Market ETFs:
Cross-market ETFs lean supportive of the equity tone, with IBIT the most bullish mover at +3.58%, GLD also firm at +1.06%, and USO adding a modest +0.36%. TLT is near-flat and slightly bearish at -0.07%, showing little hedge-driven bid. The group points to risk appetite holding up while defensive duration remains muted and commodities are firmer than bonds.
Futures Indices – Higher Time Frame Analysis
Summary of the current state of US Indices Futures based on higher time-frame (HTF) technical analysis as of: 2026-07-06: 17:00 CT.
US Indices Futures
- ES YSFG/MSFG up, WSFG down on pullback; benchmarks above price, UTrend pivots intact, 7683.50 resistance, support 7593.75 then 7683.50 zone.
- NQ YSFG up, MSFG/WSFG down, benchmarks still rising; UTrend pivots hold, resistance 30975-31090, support 29160 then 28510.
- YM YSFG/MSFG/WSFG up, benchmarks stacked bullish; UTrend intact, price near 53400 pivot high, support 52122 below.
- EMD YSFG up, WSFG bullish, MSFG mixed; benchmarks above price, UTrend pivots, resistance 3778-3782, support layered below prior swing lows.
- RTY YSFG up, WSFG/MSFG below F0% on retrace; benchmarks fully bullish, UTrend intact, resistance 3068.4, support beneath recent breakout base.
- FDAX YSFG/MSFG up, WSFG down on retracement; benchmarks bullish stack, UTrend pivots, resistance 26064-26084, support 24170 then 24130.
Overall State
- Short-Term: Bullish
- Intermediate-Term: Bullish
- Long-Term: Bullish
Conclusion
ES, YM, EMD, RTY, and FDAX maintain higher-time-frame uptrend structure with YSFG and yearly/session grids aligned above F0% on the dominant trend, while ES, NQ, RTY, and FDAX show shorter WSFG retracement pressure below F0%. Monthly grids are strongest in YM and FDAX, while NQ and RTY show the most near-term session weakness beneath monthly references. Benchmark averages are broadly bullish across all instruments, with YM, RTY, and FDAX showing the clearest stacked alignment. Pivot structure remains UTrend across the complex, with overhead resistance concentrated near recent pivot highs and support anchored at prior swing lows and benchmark clusters. YM and RTY show the strongest daily/weekly directional correlation to the broad upside trend, while NQ shows the most pronounced corrective rotation versus the others.
Note: Intra-day counter-trend pullbacks or retracements may occur, HTF is context for informational usage and market structure. Glossary: Session Fib Grids periods of YSFG:’Yearly’, MSFG:’Monthly’, WSFG:’Weekly’
For full details visit: AlphaWebTrader Technicals
ES Daily View
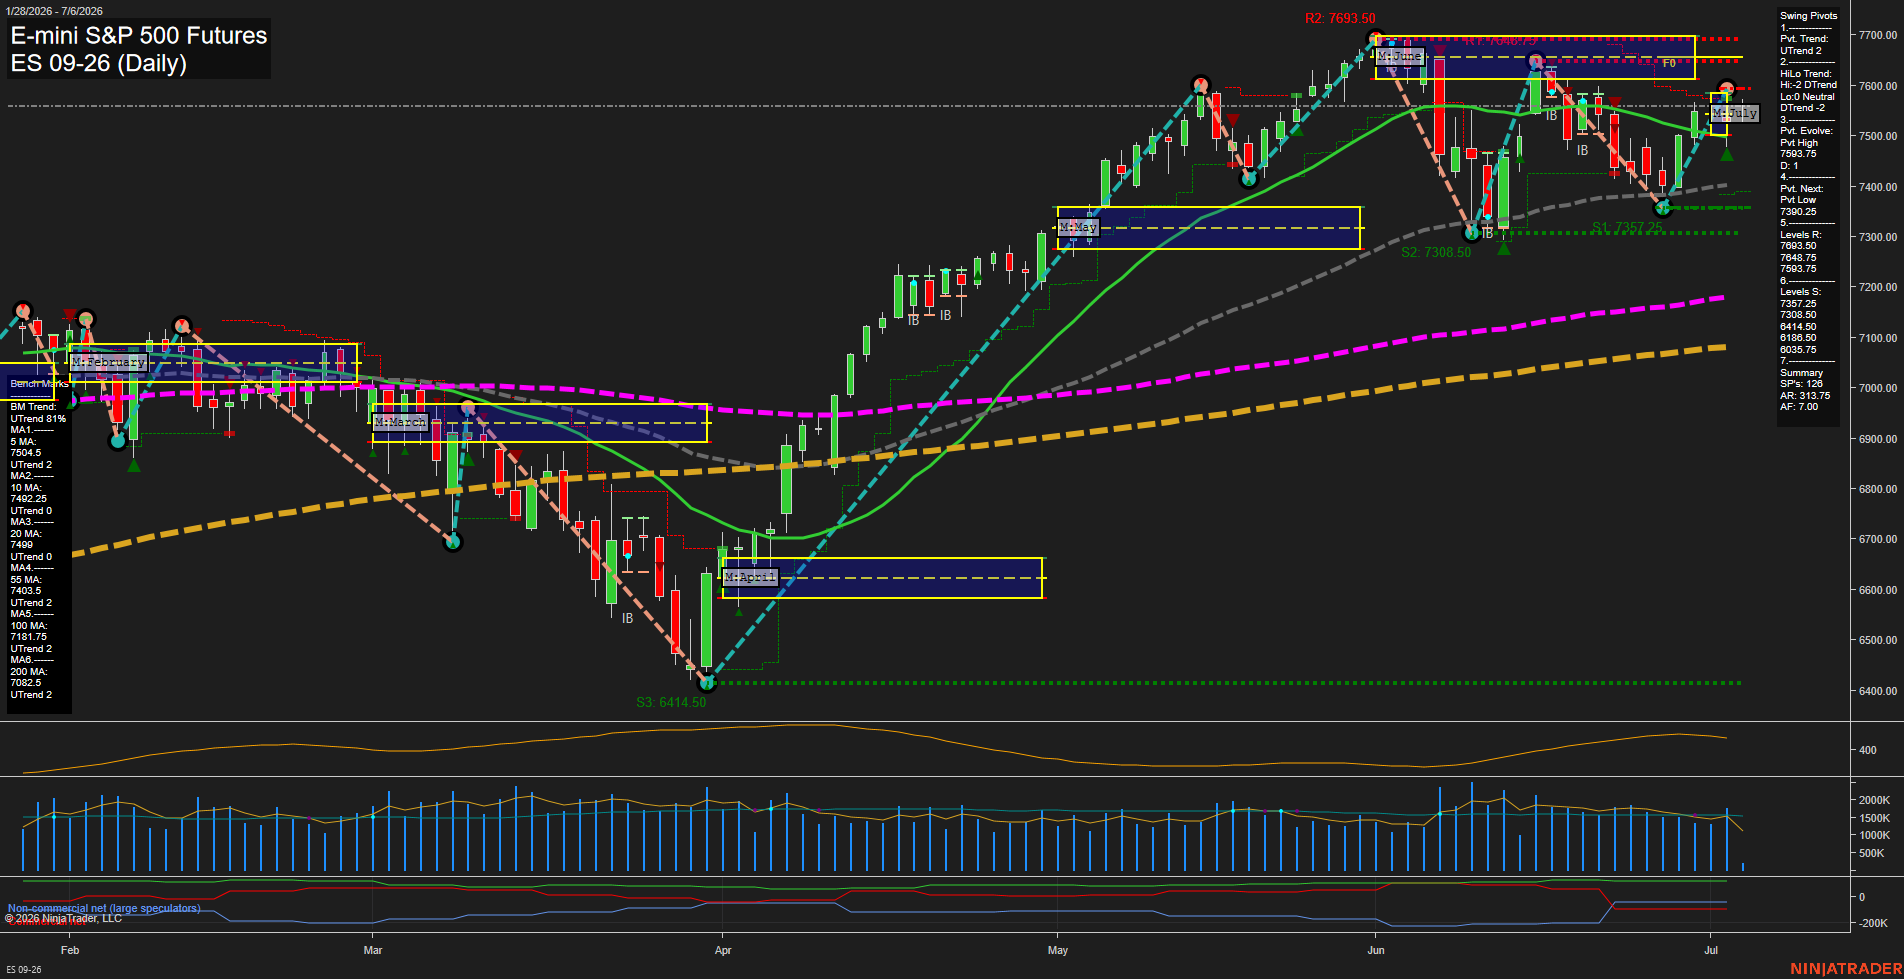
Overall Rating
- Short-Term: Neutral
- Intermediate-Term: Bullish
- Long-Term: Bullish.
Key Insights Summary
Price is holding above the rising benchmark average stack, with the 20/55/100/200-day structure still supportive of the broader uptrend. Short-term action is mixed after a push into the 7593.75 pivot high and a pullback toward the upper monthly fib zone, while the weekly session fib remains below its midpoint and keeps the near-term tone softer. Swing pivot structure still shows a higher-trend framework overall, but the immediate sequence reflects a test-and-reject pattern from recent highs, leaving the market in a consolidation-to-trend-continuation phase rather than a clean breakout state. The monthly and yearly fib grids remain constructive, and the longer-cycle bias stays aligned with the dominant rally structure from the April low into the June peak.
View charts on: AlphaWebTrader HTF Charts
NQ Daily View
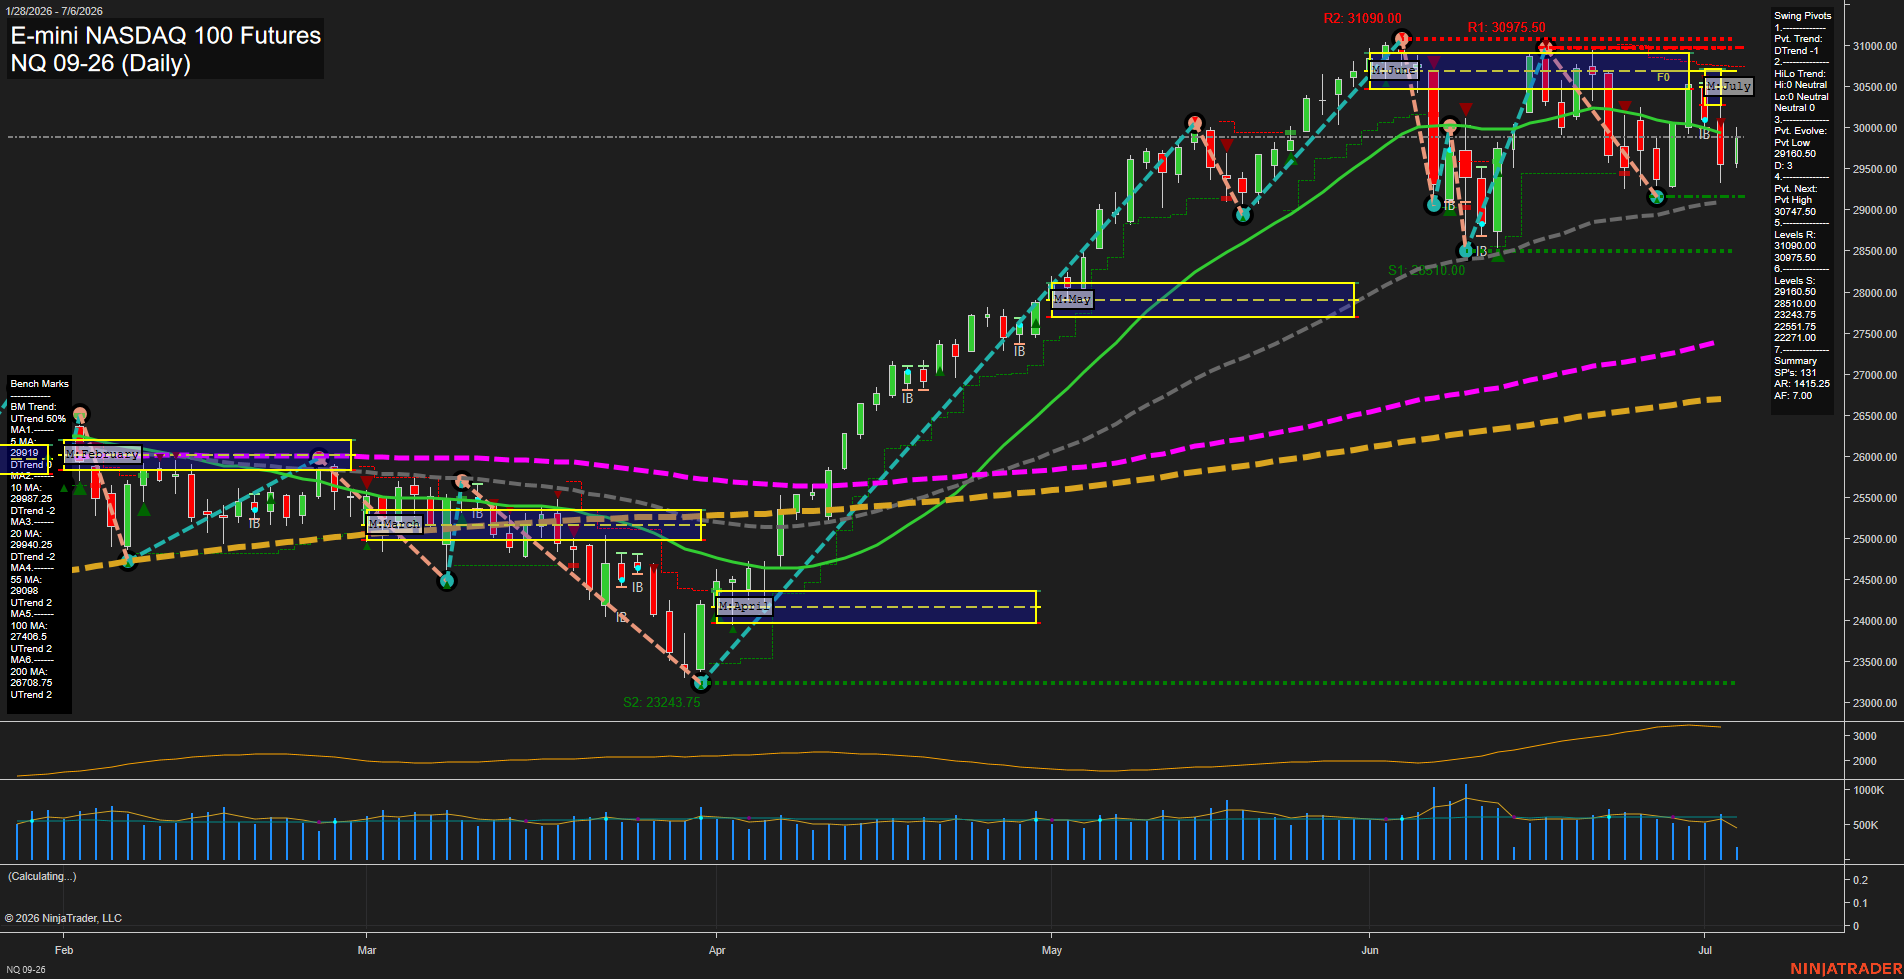
Overall Rating
- Short-Term: Bearish
- Intermediate-Term: Bearish
- Long-Term: Bullish.
Key Insights Summary
Price is working through a corrective phase after the strong June advance, with repeated rejection near the 30,975 to 31,090 resistance band and a rotation back under the July monthly fib center. The daily structure has turned down in the short term, and both the weekly and monthly session grids remain below their F0% zones, reinforcing a bearish intermediate backdrop. At the same time, the broader trend remains constructive because price is still holding well above the rising 55, 100, and 200 day benchmarks, while the yearly session grid stays firmly above its center line. The current tape looks like a pullback/consolidation inside a larger uptrend, with lower highs from the recent swing peaks and nearby support clustering around the 29,160 pivot low and the 28,510 level.
View charts on: AlphaWebTrader HTF Charts
CL Daily View
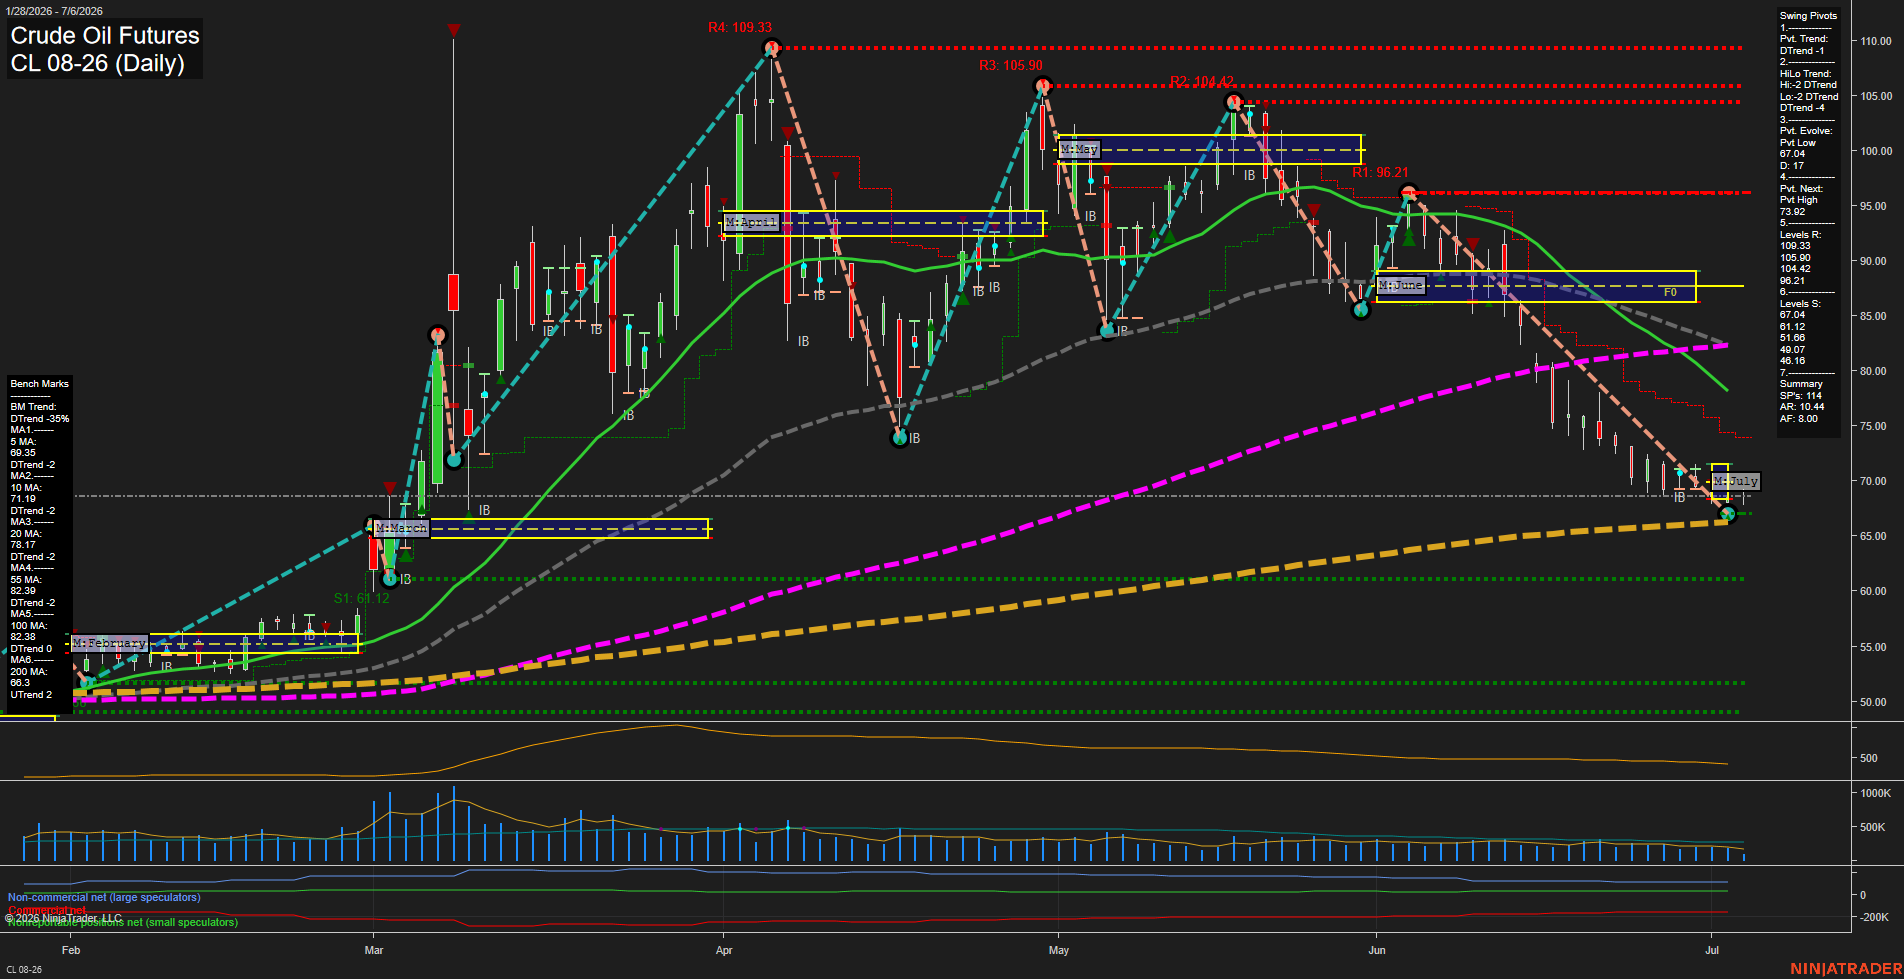
Overall Rating
- Short-Term: Bearish
- Intermediate-Term: Bearish
- Long-Term: Bearish.
Key Insights Summary
Crude oil is pressing into the lower end of the yearly range with the daily structure still dominated by a clear downtrend of lower highs and lower lows. The latest swing pivot is a confirmed pivot low at 67.04, with the next reference pivot high sitting at 73.92, showing the market is still operating inside a declining swing sequence. Price is below the monthly F0%/NTZ zone for July, matching the negative MSFG reading and reinforcing the intermediate-term bearish bias. The daily benchmark stack is also heavy, with price below the 5, 10, 20, 55, and 100 day averages, while the 200 day sits just above price and acts as the closest long-term reference. Recent candles show contraction and smaller bars after the sharp decline, suggesting a pause near support rather than a confirmed reversal. Overall, the chart reflects a bearish daily trend with a possible stabilization phase around the mid-60s after the steep June selloff.
View charts on: AlphaWebTrader HTF Charts
GC Daily View
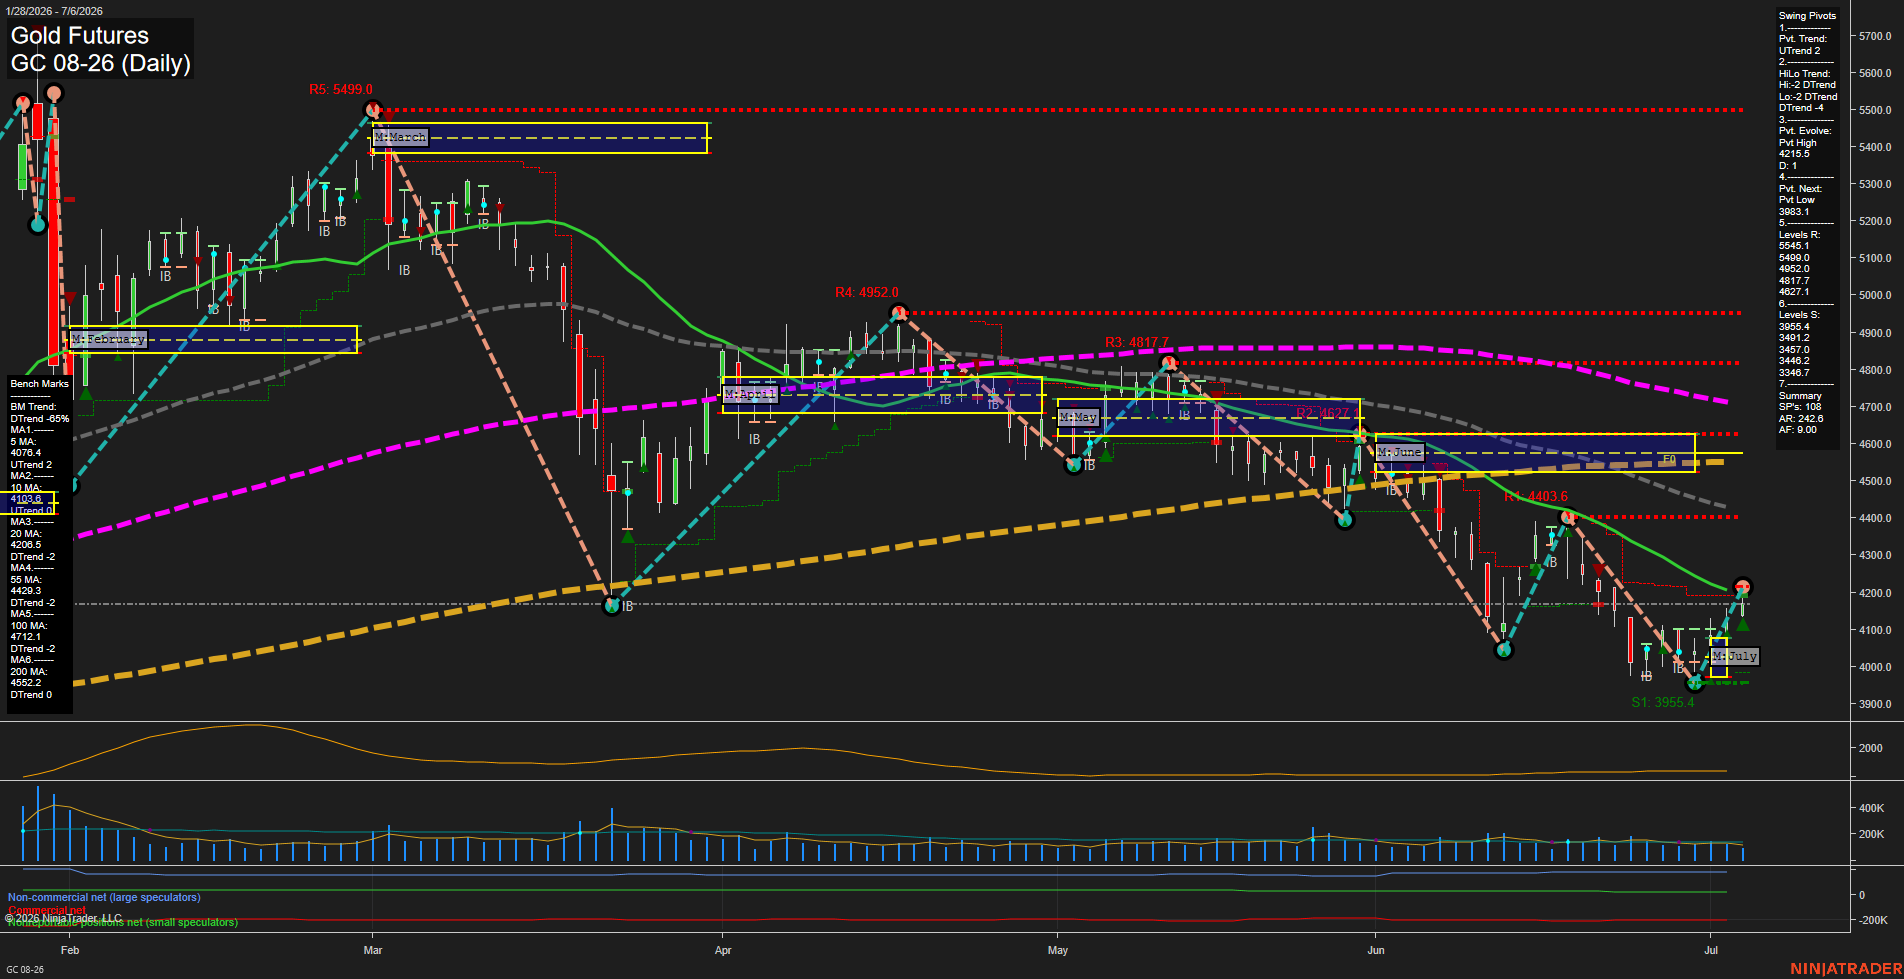
Overall Rating
- Short-Term: Neutral
- Intermediate-Term: Bearish
- Long-Term: Bearish.
Key Insights Summary
Gold is in a fast-moving corrective bounce after a sharp June selloff, with price pressing back above the 5 and 10 day benchmarks while still sitting under the 20 day and far below the 55/100/200 day layers. The short-term pivot structure has flipped to UTrend, and the current move is testing a rebound into overhead resistance zones created by prior swing highs and the monthly session grid. Intermediate-term structure remains pressured because the HiLo trend is still down and the dominant moving averages continue to slope lower. Long-term trend remains bearish overall, with the yearly session bias still deeply negative and price trading well under major benchmark averages, while the July monthly grid shows a positive internal bounce that is not yet confirmed by the broader trend structure.
View charts on: AlphaWebTrader HTF Charts