NYSE pre-market radar reviews ETF movers in AAPL, IBIT, GLD, QQQ, META and TSLA, plus weekly and daily trends in ES, NQ, YM, RTY, EMD and FDAX.
Fundamentals: Stock-index futures began the week with gains as markets digested the June Fed minutes, Monday's ISM services data, and fresh supply changes in oil. Equity tone remained constructive but mixed, with technical resistance in the S&P 500, ongoing megacap valuation scrutiny, and support in semiconductors, REITs, gold, and silver.
Technicals: The pre-market session highlights prior ETF movers in AAPL, IBIT, GLD, QQQ, META, and TSLA, alongside a broad futures read on ES, NQ, YM, RTY, EMD, and FDAX. Weekly and daily structure remains mostly constructive in the major averages and index futures, while several contracts show short-term pullbacks, mixed momentum, and tests of recent highs.
Pre-Market Trading 360° view Market Radar of: holidays, earnings, eco-news, market-news summary, news sentiment, prior session major ETFs, MAG7, Higher Time Frame Analysis Indices Futures Summary, and E-mini S&P500, Nasdaq 100, NYMEX Crude, Gold Futures Daily Chart analysis.
As of: July 6, 2026 07:16 CT
EcoNews Radar U.S. Events
| Day | Time | Impact | Event |
|---|---|---|---|
| Mon | 10:00 | High | ISM Services PMI |
| Wed | 10:30 | Low | Crude Oil Inventories |
| Wed | 14:00 | High | FOMC Meeting Minutes |
| Thu | 08:30 | Medium | Unemployment Claims |
EcoNews Summary
Key market-moving releases are concentrated on Wednesday, led by the High USD FOMC Meeting Minutes, with an additional oil-focused release from Crude Oil Inventories. Monday’s High USD ISM Services PMI provides an early read on service-sector activity, while Thursday’s Unemployment Claims adds a labor-market update.
Event Notes:
- Monday 10:00 – High USD ISM Services PMI: A survey-based gauge of U.S. service-sector activity. Traders monitor it for growth momentum, pricing pressure, and labor trends because it influences rate expectations and broad risk sentiment.
- Wednesday 10:30 – Low USD Crude Oil Inventories: Measures weekly changes in U.S. crude stockpiles. Traders track it for petroleum supply conditions, energy-price direction, and spillover effects into inflation-sensitive markets.
- Wednesday 14:00 – High USD FOMC Meeting Minutes: A detailed record of the Federal Reserve’s latest policy meeting. Traders focus on clues about rate-path discussion, inflation concerns, and internal policy balance because it often shifts rates and equity index pricing.
- Thursday 08:30 – Medium USD Unemployment Claims: Weekly first-time filings for U.S. jobless benefits. Traders watch it as a timely labor-market indicator that feeds into growth and policy expectations.
Conclusion:
Wednesday is the most important day, with the High USD FOMC Meeting Minutes as the single most important event of the week. Market momentum and volume often slow ahead of major events such as FOMC, with increased volatility at release time. The Wednesday 10:30 Crude Oil Inventories report adds an energy-supply catalyst, while the 10 AM time cycle on Monday can also act as a point for reversals or continuations.
For full details visit: Forex Factory EcoNews
Market News Summary:
Stock-index futures opened the week with gains, while markets also absorbed Fed minutes, oil supply changes, and mixed signals across major asset classes.
Primary Drivers & Risks:
- Primary Driver: Stock futures, Fed minutes
- Primary Risk: Oil supply and valuation pressure
Tone:
Mixed, with a constructive equity bias and several cross-asset risks.
Stock Market / ETFs / Indices:
S&P 500 technical commentary flagged consolidation and reversal risk after a weak June close, while stock futures gained as Wall Street looked to extend recent advances. Commentary on semiconductors highlighted strong Q2 performance, continued AI support, and unresolved concerns about concentration and leverage in large-cap leaders. REITs were described as benefiting from improving fundamentals across several property groups.
Gold / Metals:
Gold and silver rebounded after soft U.S. jobs data reduced Fed hike bets, with Fed minutes and ISM services data in focus. Separate commentary pointed to technical resilience in gold and silver, supported by official accumulation and tight mine supply.
Oil / Energy:
Oil declined after OPEC+ agreed to raise output targets by 188,000 barrels a day for August, extending monthly increases. Additional pressure came from recovering exports through the Strait of Hormuz and a growing Iranian oil inventory at sea. Ukraine’s strikes on Russian refineries and an oil terminal added geopolitical strain to the energy complex.
Fed / Financials:
The June Fed minutes were identified as the key macro event for the week. Gold traders focused on how the minutes and services data align with lower rate-hike expectations.
Macro / Other:
Asian currencies were steady after the holiday weekend amid position adjustments, and JGBs fell on concerns over Japan’s fiscal policy. Bond markets moved out of sync with equities, and several headlines pointed to ongoing valuation scrutiny in U.S. megacap technology.
Conclusion:
Primary drivers centered on stock futures strength, the Fed minutes, and oil market supply changes. Equity tone remained supported by recent gains, but index-level technical resistance, megacap concentration, and weaker energy prices added cross-currents.
Secondary drivers included gold’s reaction to softer labor data, REIT sector strength, and semiconductors tied to AI demand. Geopolitical developments around Iran, Russia, and Ukraine added to energy-market volatility, while bond and currency moves stayed mixed.
Market News Sentiment
Market News Articles: 23
- Neutral: 52.17%
- Negative: 26.09%
- Positive: 21.74%
Sentiment Summary: Market news sentiment is mostly neutral at 52%, with negative coverage at 26% and positive coverage at 22% across 23 articles.
Conclusion: The news flow is balanced with a neutral bias, while negative coverage is higher than positive coverage.
GLD,Gold Articles: 4
- Positive: 75.00%
- Neutral: 25.00%
Sentiment Summary: GLD/Gold articles were 75% positive and 25% neutral, indicating a generally constructive tone.
Conclusion: The sentiment snapshot shows positive coverage for gold-related articles, with no negative articles reported.
USO,Oil Articles: 9
- Negative: 66.67%
- Positive: 22.22%
- Neutral: 11.11%
Sentiment Summary: USO/oil news is mostly negative, with 67% negative, 22% positive, and 11% neutral articles across 9 items.
Conclusion: The current oil-related sentiment snapshot is negative, with negative coverage outweighing positive and neutral coverage.
Market Data Snapshot
ETF Snapshot of major stock market ETFs, Mag7, and others as of: July 6, 2026 07:16
Top Movers & Losers
- AAPL 308.63 Bullish 4.84% ▲
- IBIT 34.87 Bullish 2.56% ▲
- GLD 378.13 Bullish 2.03% ▲
- QQQ 712.60 Bearish -1.73% ▼
- META 582.90 Bearish -4.90% ▼
- TSLA 393.45 Bearish -7.49% ▼
Major Index ETFs: SPY, QQQ, DIA, IWM, IJH
- DIA 527.88 Bullish 1.05% ▲
- SPY 744.78 Bearish -0.13% ▼
- IJH 76.09 Bearish -0.46% ▼
- IWM 297.58 Bearish -0.58% ▼
- QQQ 712.60 Bearish -1.73% ▼
Mixed tone across the index ETF complex: DIA led as the most bullish mover at +1.05%, while QQQ was the most bearish mover at -1.73%. SPY was near-flat at -0.13%, with IJH at -0.46% and IWM at -0.58%.
Mag 7 Stocks: AAPL, MSFT, GOOG, AMZN, META, NVDA, TSLA
- AAPL 308.63 Bullish 4.84% ▲
- MSFT 390.49 Bullish 1.62% ▲
- AMZN 242.67 Bullish 0.40% ▲
- GOOG 356.18 Bearish -0.48% ▼
- NVDA 194.83 Bearish -1.39% ▼
- META 582.90 Bearish -4.90% ▼
- TSLA 393.45 Bearish -7.49% ▼
Mixed Mag7 snapshot: AAPL was the most bullish mover at +4.84%, followed by MSFT at +1.62% and AMZN near flat at +0.40%; on the bearish side, GOOG was marginally lower at -0.48%, NVDA fell -1.39%, META dropped -4.90%, and TSLA was the most bearish mover at -7.49%.
Cross-Market ETFs: TLT, GLD, USO, IBIT
- IBIT 34.87 Bullish 2.56% ▲
- GLD 378.13 Bullish 2.03% ▲
- USO 103.98 Bullish 0.69% ▲
- TLT 85.51 Bearish -0.01% ▼
Mixed tone across the group: IBIT led as the most bullish mover at +2.56%, followed by GLD at +2.03% and USO at +0.69%, while TLT was the most bearish mover but essentially flat at -0.01%.
ETF, Mag7, and Cross-Market ETF Insights
Overall Tone
Mixed and selective, with risk on in a few large-cap names and hedging/defensive flows also active.
Equity ETFs and Mag7:
Major Index ETFs were uneven: DIA led the ETF complex with +1.05%, while QQQ lagged at -1.73%, showing a clear split between Dow strength and Nasdaq weakness. SPY was near flat to slightly lower at -0.13%, with IJH at -0.46% and IWM at -0.58%, reinforcing a broadly mixed equity backdrop. In Mag7, AAPL was the most bullish mover at +4.84%, while TSLA was the most bearish mover at -7.49%; MSFT also firmed at +1.62%, but META at -4.90% and NVDA at -1.39% kept leadership narrow.
Cross-Market ETFs:
Cross-market positioning was mixed versus equities: GLD was strong at +2.03%, USO added +0.69%, and IBIT outperformed at +2.56%, while TLT was essentially flat at -0.01%. The strongest cross-market mover was IBIT at +2.56%, and the weakest was TLT at -0.01% on a near-flat move. That mix points to active commodity and digital-asset strength alongside only muted Treasury movement, diverging from the softer growth-heavy equity tone.
Futures Indices – Higher Time Frame Analysis
Summary of the current state of US Indices Futures based on higher time-frame (HTF) technical analysis as of: 2026-07-06: 07:16 CT.
US Indices Futures
- ES YSFG above F0%, MSFG above F0%, WSFG below F0%; benchmarks 20/55/100/200-day held; pivots 7593.75, 7683.50; support into prior pivot zones.
- NQ YSFG above F0%, MSFG below F0%, WSFG below F0%; benchmarks above 55/100/200-day, below recent highs; pivots 29,160, 30,975-31,090; resistance overhead, support lower swing pivots.
- YM YSFG above F0%, MSFG above F0%, WSFG below F0%; benchmarks stacked upward across 5-200 day; pivots 53,400, 52,122; fresh highs near upper yearly range.
- EMD YSFG above F0%, MSFG below NTZ, WSFG above F0%; benchmarks above 5-200 day; pivots 3778-3782 resistance, lower swing support beneath; yearly structure remains constructive.
- RTY YSFG above F0%, MSFG below F0%, WSFG below F0%; benchmarks aligned up across 5-200 day; pivots 3068.4, prior swing references lower; extension near highs.
- FDAX YSFG above F0%, MSFG above F0%, WSFG below F0%; benchmarks stacked up across 5-200 day; pivots 26064, 24170; upper-range highs with support below.
Overall State
- Short-Term: Neutral
- Intermediate-Term: Bullish
- Long-Term: Bullish
Conclusion
US indices futures remain aligned with a larger uptrend across YSFG and mostly constructive MSFG readings, while WSFG is mixed to below F0% in ES, NQ, YM, RTY, and FDAX, reflecting short-cycle retracement or extension phases. YM, EMD, and FDAX hold the clearest benchmark alignment, while NQ and RTY show the most compressed overhead conditions after sharp rallies. ES remains structurally firm above major averages, NQ is in a corrective rotation below recent highs, and RTY is extended but still above all major benchmarks. Pivot structures remain upward across the group, with nearby resistance at recent swing highs and support at prior pivot lows and benchmark clusters.
Note: Intra-day counter-trend pullbacks or retracements may occur, HTF is context for informational usage and market structure. Glossary: Session Fib Grids periods of YSFG:’Yearly’, MSFG:’Monthly’, WSFG:’Weekly’
For full details visit: AlphaWebTrader Technicals
ES Daily View
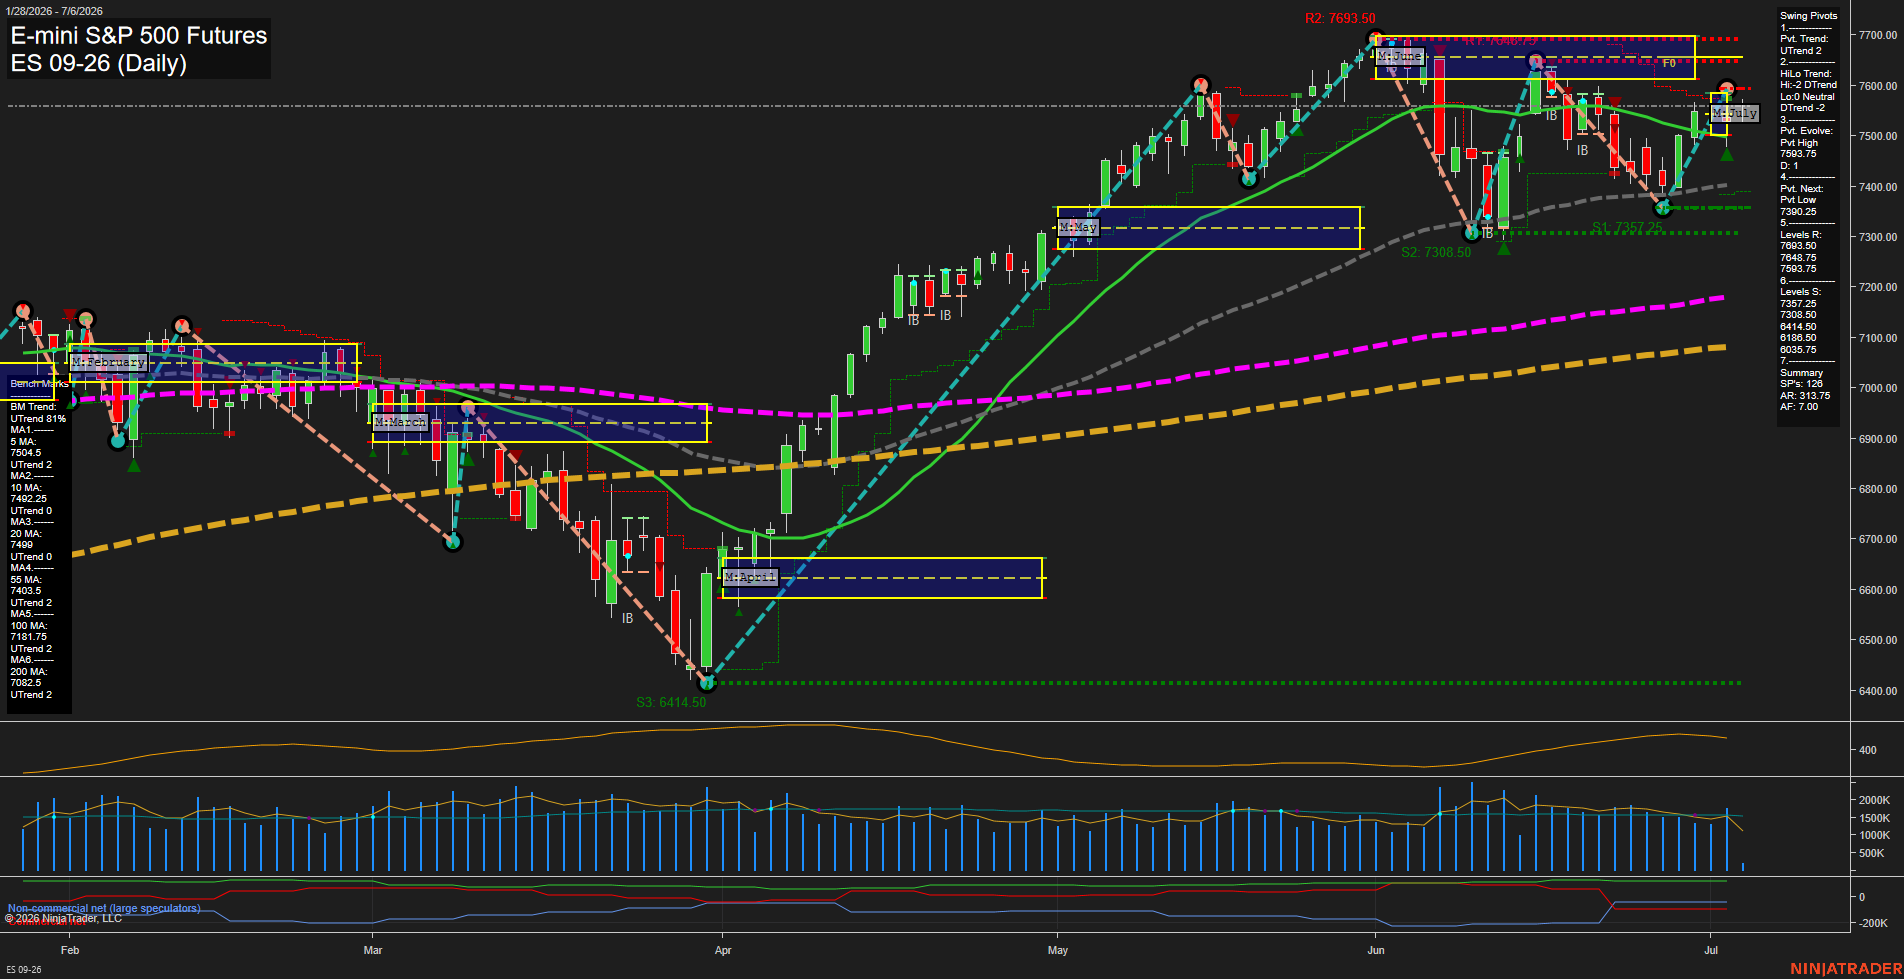
Overall Rating
- Short-Term: Neutral
- Intermediate-Term: Bullish
- Long-Term: Bullish.
Key Insights Summary
Price is holding above the rising benchmark average stack, with the 20/55/100/200-day structure still supportive of the broader uptrend. Short-term action is mixed after a push into the 7593.75 pivot high and a pullback toward the upper monthly fib zone, while the weekly session fib remains below its midpoint and keeps the near-term tone softer. Swing pivot structure still shows a higher-trend framework overall, but the immediate sequence reflects a test-and-reject pattern from recent highs, leaving the market in a consolidation-to-trend-continuation phase rather than a clean breakout state. The monthly and yearly fib grids remain constructive, and the longer-cycle bias stays aligned with the dominant rally structure from the April low into the June peak.
View charts on: AlphaWebTrader HTF Charts
NQ Daily View
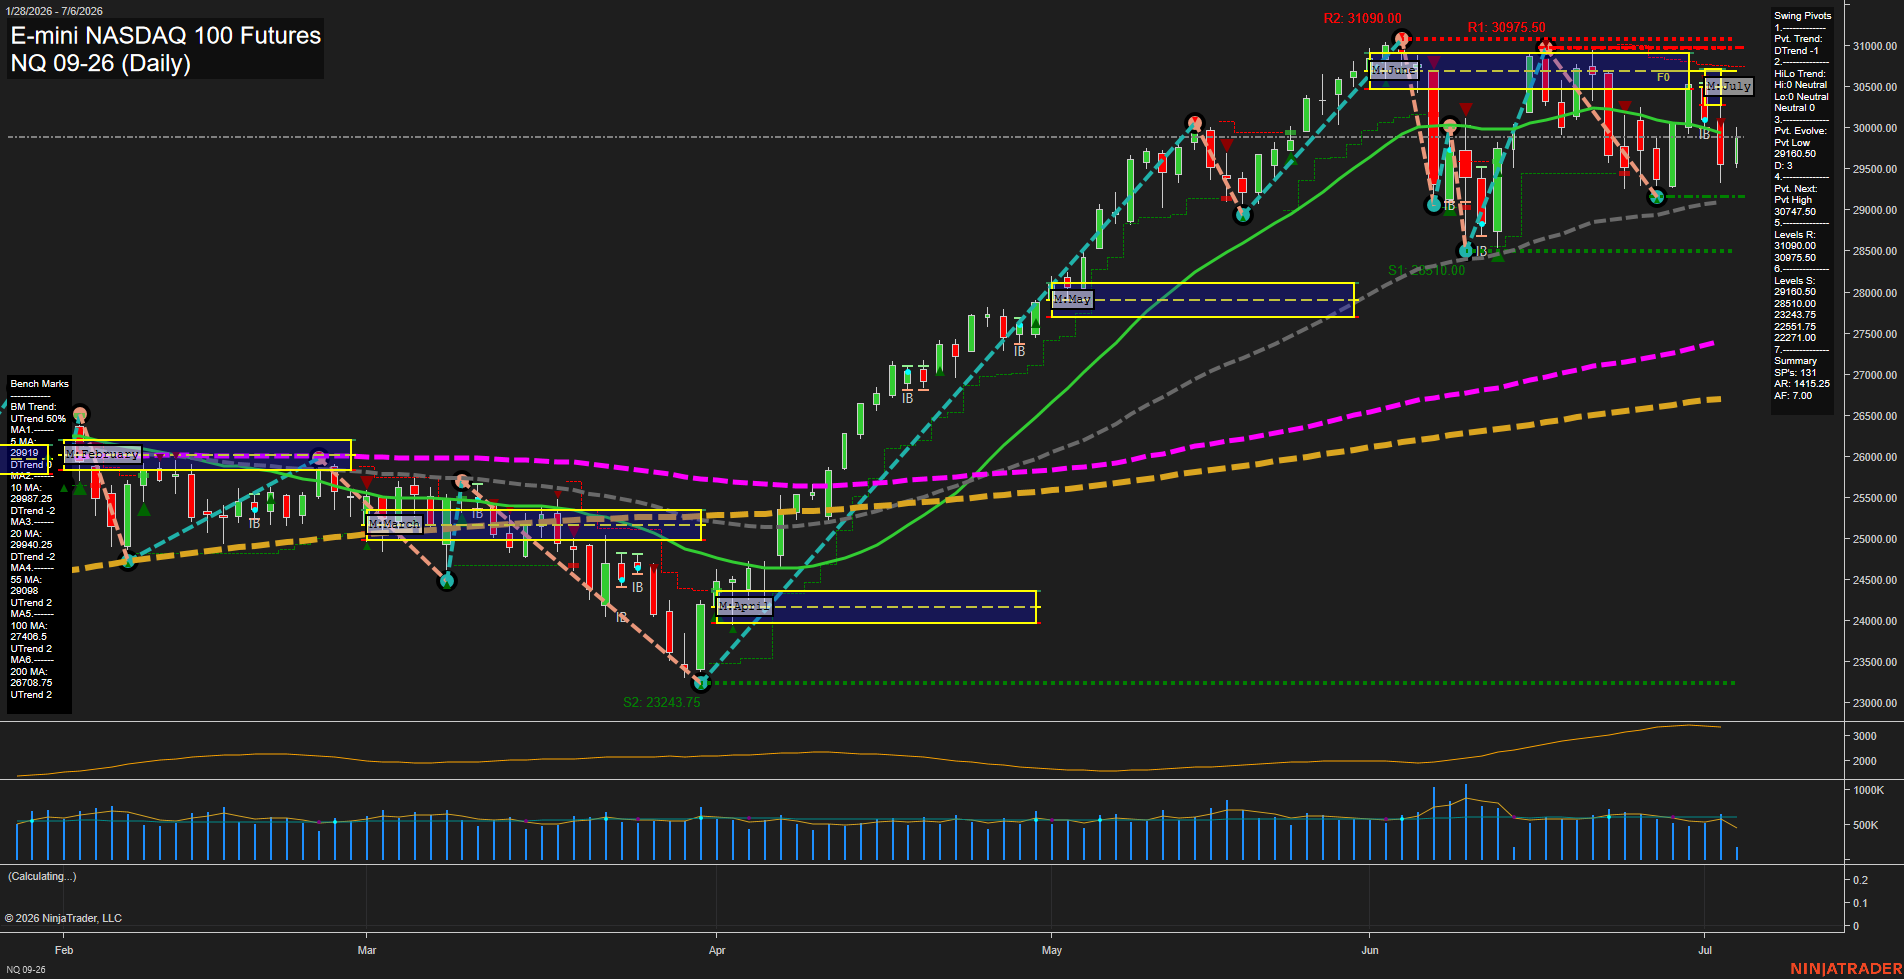
Overall Rating
- Short-Term: Bearish
- Intermediate-Term: Bearish
- Long-Term: Bullish.
Key Insights Summary
Price is working through a corrective phase after the strong June advance, with repeated rejection near the 30,975 to 31,090 resistance band and a rotation back under the July monthly fib center. The daily structure has turned down in the short term, and both the weekly and monthly session grids remain below their F0% zones, reinforcing a bearish intermediate backdrop. At the same time, the broader trend remains constructive because price is still holding well above the rising 55, 100, and 200 day benchmarks, while the yearly session grid stays firmly above its center line. The current tape looks like a pullback/consolidation inside a larger uptrend, with lower highs from the recent swing peaks and nearby support clustering around the 29,160 pivot low and the 28,510 level.
View charts on: AlphaWebTrader HTF Charts
CL Daily View
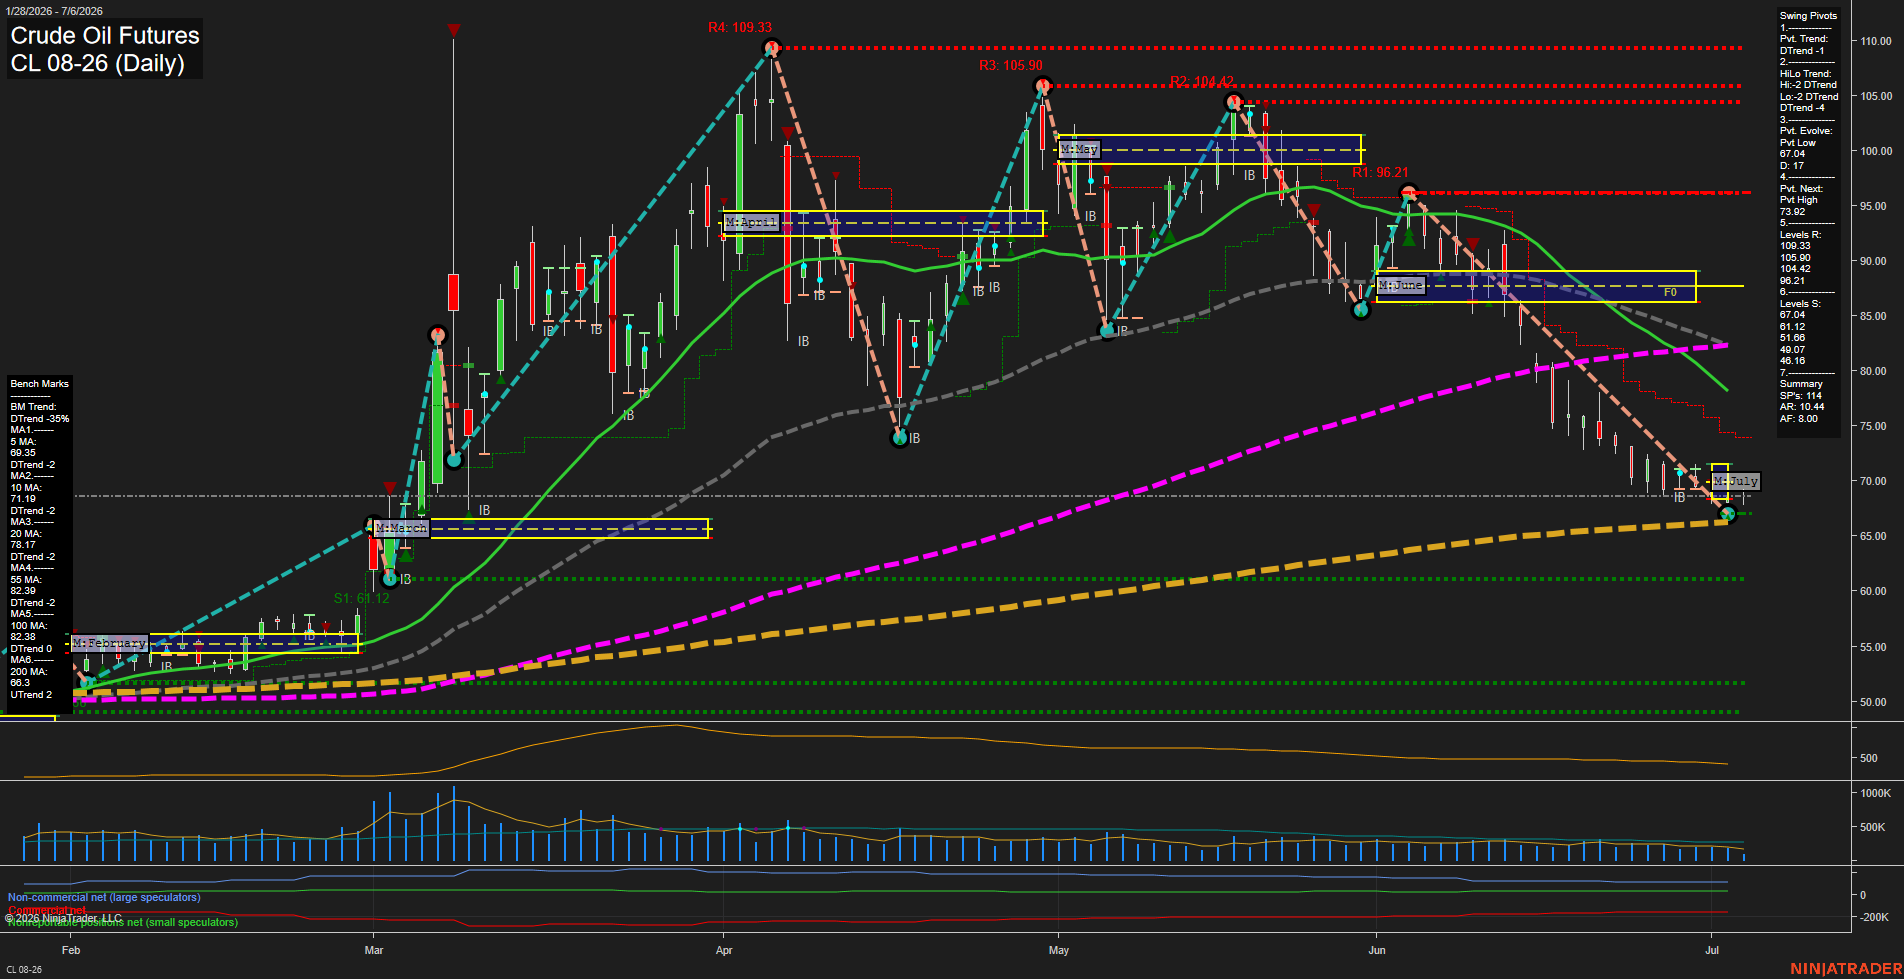
Overall Rating
- Short-Term: Bearish
- Intermediate-Term: Bearish
- Long-Term: Bearish.
Key Insights Summary
Crude oil is pressing into the lower end of the yearly range with the daily structure still dominated by a clear downtrend of lower highs and lower lows. The latest swing pivot is a confirmed pivot low at 67.04, with the next reference pivot high sitting at 73.92, showing the market is still operating inside a declining swing sequence. Price is below the monthly F0%/NTZ zone for July, matching the negative MSFG reading and reinforcing the intermediate-term bearish bias. The daily benchmark stack is also heavy, with price below the 5, 10, 20, 55, and 100 day averages, while the 200 day sits just above price and acts as the closest long-term reference. Recent candles show contraction and smaller bars after the sharp decline, suggesting a pause near support rather than a confirmed reversal. Overall, the chart reflects a bearish daily trend with a possible stabilization phase around the mid-60s after the steep June selloff.
View charts on: AlphaWebTrader HTF Charts
GC Daily View
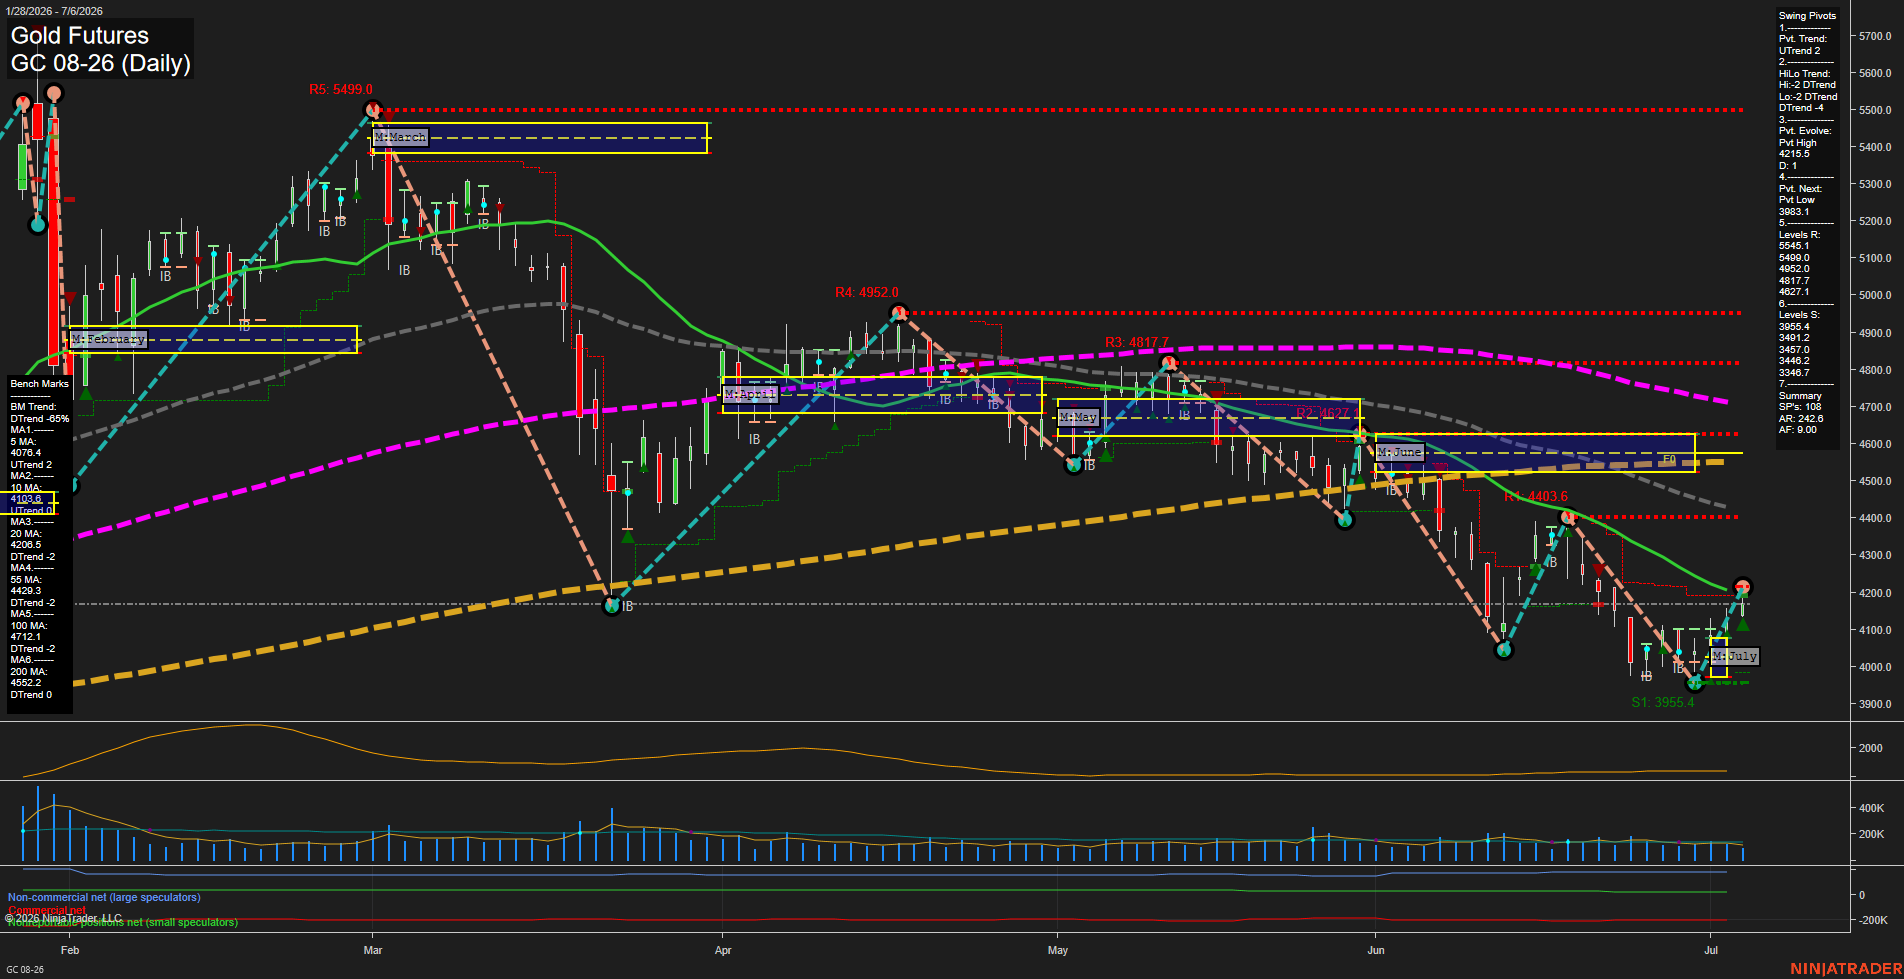
Overall Rating
- Short-Term: Neutral
- Intermediate-Term: Bearish
- Long-Term: Bearish.
Key Insights Summary
Gold is in a fast-moving corrective bounce after a sharp June selloff, with price pressing back above the 5 and 10 day benchmarks while still sitting under the 20 day and far below the 55/100/200 day layers. The short-term pivot structure has flipped to UTrend, and the current move is testing a rebound into overhead resistance zones created by prior swing highs and the monthly session grid. Intermediate-term structure remains pressured because the HiLo trend is still down and the dominant moving averages continue to slope lower. Long-term trend remains bearish overall, with the yearly session bias still deeply negative and price trading well under major benchmark averages, while the July monthly grid shows a positive internal bounce that is not yet confirmed by the broader trend structure.
View charts on: AlphaWebTrader HTF Charts