U.S. futures and ETFs are mixed as USO, META and AMZN firm while QQQ and TSLA lag. Oil, gold and yields weigh on sentiment ahead of Fed minutes.
Fundamentals: U.S. equity futures were lower as renewed Middle East tensions pushed crude and gold higher and added pressure to risk assets. Tech and semiconductor shares were weaker amid concern over higher yields and AI valuations, while traders also looked ahead to U.S. crude inventories and Federal Reserve meeting minutes for policy cues.
Technicals: U.S. index futures and key ETFs show a mixed opening tone, with recent weakness in QQQ and TSLA offset by gains in USO, META and AMZN. Weekly and daily structures across ES, NQ, YM, EMD, RTY and FDAX remain largely constructive over the long term, while short-term and intermediate readings are softer, reflecting recent pullbacks, rotations and resistance tests.
Pre-Market Trading 360° view Market Radar of: holidays, earnings, eco-news, market-news summary, news sentiment, prior session major ETFs, MAG7, Higher Time Frame Analysis Indices Futures Summary, and E-mini S&P500, Nasdaq 100, NYMEX Crude, Gold Futures Daily Chart analysis.
As of: July 8, 2026 07:16 CT
EcoNews Radar U.S. Events
| Day | Time | Impact | Event |
|---|---|---|---|
| Wed | 10:30 | Low | Crude Oil Inventories |
| Wed | 14:00 | High | FOMC Meeting Minutes |
| Thu | 08:30 | Medium | Unemployment Claims |
EcoNews Summary
Wednesday carries the main market focus with High USD FOMC Meeting Minutes, the key high-impact release for index futures. Also on Wednesday, Low USD Crude Oil Inventories adds an energy-supply angle, with potential spillover into inflation-sensitive sectors and broader risk sentiment. Thursday’s Unemployment Claims are listed but are excluded here because they are medium impact and not directly tied to oil, crude inventories, energy prices, or petroleum supply.
Event Notes:
- Wednesday 10:30 – Low USD Crude Oil Inventories: A weekly measure of crude stockpiles. Traders monitor it for clues on petroleum supply and energy-price pressure, which can feed into inflation expectations and equity index reactions.
- Wednesday 14:00 – High USD FOMC Meeting Minutes: A detailed record of the Federal Reserve’s latest policy meeting. It is watched for the tone on inflation, growth, and policy path, which can drive broad index volatility.
Conclusion:
The single most important event of the week is Wednesday’s High USD FOMC Meeting Minutes. Market momentum and volume often slow ahead of major events such as FOMC, with volatility increasing at release time. Wednesday’s crude oil inventory data also matters for energy and inflation context, and high oil prices remain relevant through inflation and geopolitical concerns.
For full details visit: Forex Factory EcoNews
Market News Summary:
Risk assets faced pressure from Middle East tensions, with oil and gold firmer while U.S. index futures weakened on tech selling and higher rate-sensitive concerns.
Primary Drivers & Risks:
- Primary Driver: Middle East escalation lifts oil
- Primary Risk: Tech weakness and higher yields
Tone:
Defensive and risk-sensitive, with energy strength offsetting broader equity pressure.
Stock Market / ETFs / Indices:
U.S. stock futures moved lower as tech and semiconductor shares sold off and sector rotation intensified. The S&P 500, Nasdaq, Dow, and related index futures faced added pressure from stronger oil prices and renewed concern around AI and chip valuations. The Nikkei 225 traded sideways after an earlier tech rebound, while a broad equity rally and ETF momentum remained in focus.
Geopolitical:
Renewed U.S.-Iran strikes and threats to the Strait of Hormuz dominated headlines. The fragile Mideast truce was described as under strain, with renewed conflict and commercial shipping risks weighing on sentiment.
Oil / Energy:
Crude prices jumped on supply-disruption fears tied to the U.S.-Iran exchange and revocation of Iranian oil sales licenses. Brent rose above $79 a barrel in one report, while U.S. crude climbed sharply in Asian and European trading.
Gold / Metals:
Gold rose with renewed Middle East tensions, but separate coverage noted pressure from higher oil, a stronger dollar, and rising Treasury yields. Silver also eased alongside gold in the face of tighter financial conditions.
Fed / Financials:
Investors focused on upcoming Fed minutes and the tone of rate policy communication under the new chair. Higher rate-hike bets and rising Treasury yields added pressure to equities and precious metals.
Macro / Other:
Asian currencies weakened against the dollar amid the Middle East flare-up. U.S. grocers came into view after the White House pressed major chains on beef prices, adding a separate consumer inflation angle.
Conclusion:
Middle East escalation and the jump in crude prices are the main drivers behind the session’s risk-off tone. Technology stocks, futures, and rate-sensitive assets are under pressure as traders absorb higher energy costs and policy uncertainty.
Secondary cross-currents include stronger Treasury yields, a firmer dollar, and shifting sector rotation within equities. Gold remains supported by geopolitical stress, while broader market breadth and AI-linked sentiment add another layer of volatility.
Market News Sentiment
Market News Articles: 48
- Neutral: 54.17%
- Positive: 25.00%
- Negative: 20.83%
Sentiment Summary: Market news is mostly neutral at 54%, with 25% positive and 21% negative coverage across 48 articles.
Conclusion: The overall news flow is neutral, with positive and negative items making up smaller, mixed shares of coverage.
GLD,Gold Articles: 11
- Positive: 72.73%
- Neutral: 27.27%
Sentiment Summary: GLD/Gold articles are mostly positive at 73%, with 27% neutral coverage, indicating a favorable news tone.
Conclusion: The sentiment profile is positive overall, with no negative coverage in the provided snapshot.
USO,Oil Articles: 17
- Neutral: 41.18%
- Positive: 29.41%
- Negative: 29.41%
Sentiment Summary: USO oil coverage is mixed and broadly neutral, with 41% neutral, 29% positive, and 29% negative articles across 17 items.
Conclusion: The article set shows balanced sentiment with no clear directional bias in the oil-related news flow.
Market Data Snapshot
ETF Snapshot of major stock market ETFs, Mag7, and others as of: July 8, 2026 07:16
Top Movers & Losers
- USO 108.92 Bullish 4.38% ▲
- META 615.58 Bullish 2.55% ▲
- AMZN 245.98 Bullish 0.75% ▲
- IJH 75.47 Bearish -1.24% ▼
- QQQ 709.43 Bearish -1.85% ▼
- TSLA 402.90 Bearish -4.02% ▼
Major Index ETFs: SPY, QQQ, DIA, IWM, IJH
- DIA 528.45 Bearish -0.31% ▼
- SPY 747.71 Bearish -0.48% ▼
- IWM 296.19 Bearish -0.91% ▼
- IJH 75.47 Bearish -1.24% ▼
- QQQ 709.43 Bearish -1.85% ▼
Indices futures tone is Bearish across the group, with DIA as the least negative mover at -0.31% and QQQ leading the downside at -1.85%. SPY is down -0.48%, IWM is down -0.91%, and IJH is down -1.24%, keeping the session uniformly red and tilted lower.
Mag 7 Stocks: AAPL, MSFT, GOOG, AMZN, META, NVDA, TSLA
- META 615.58 Bullish 2.55% ▲
- AMZN 245.98 Bullish 0.75% ▲
- NVDA 196.93 Bullish 0.71% ▲
- MSFT 388.84 Bullish 0.54% ▲
- GOOG 363.62 Bearish -0.35% ▼
- AAPL 310.66 Bearish -0.64% ▼
- TSLA 402.90 Bearish -4.02% ▼
Mag7 is Mixed, with META leading on the upside at +2.55%, followed by AMZN at +0.75%, NVDA at +0.71%, and MSFT at +0.54%; on the downside, TSLA is the clear most bearish mover at -4.02%, while AAPL at -0.64% and GOOG at -0.35% are comparatively near-flat declines.
Cross-Market ETFs: TLT, GLD, USO, IBIT
- USO 108.92 Bullish 4.38% ▲
- IBIT 36.15 Bullish 0.08% ▲
- TLT 84.55 Bearish -1.05% ▼
- GLD 377.49 Bearish -1.21% ▼
Mixed cross-market tone: USO is the most bullish mover at +4.38%, IBIT is near-flat at +0.08%, while TLT is bearish at -1.05% and GLD is the most bearish mover at -1.21%.
ETF, Mag7, and Cross-Market ETF Insights
Overall Tone
Mixed risk tone with equities and Mag7 showing selective leadership while cross-market assets lean defensive and soft; the most bullish mover is USO at +4.38%, and the most bearish mover is TSLA at -4.02%.
Equity ETFs and Mag7:
Equity ETFs are mixed-to-bearish, with SPY at -0.48%, QQQ at -1.85%, DIA at -0.31%, IWM at -0.91%, and IJH at -1.24%. Mag7 is also selective: META leads at +2.55%, while AMZN +0.75%, NVDA +0.71%, and MSFT +0.54% are modestly higher; AAPL is at -0.64%, GOOG at -0.35%, and TSLA is the clear downside leader at -4.02%. Broad equity alignment is weak, with large-cap growth underperforming and leadership concentrated in a few names.
Cross-Market ETFs:
Cross-market flows are mixed, with USO notably stronger at +4.38% while IBIT is essentially flat at +0.08%. TLT at -1.05% and GLD at -1.21% are both lower, which contrasts with the equity mix and points to softness in duration and gold hedging. The strongest cross-market move is USO, and the weakest is GLD at -1.21%.
Futures Indices – Higher Time Frame Analysis
Summary of the current state of US Indices Futures based on higher time-frame (HTF) technical analysis as of: 2026-07-08: 07:16 CT.
US Indices Futures
- ES Yearly grid above F0%, monthly/weekly below F0%, above 20/55/100/200-day benchmarks, swing pivots mixed-to-lower, support near 7500, resistance near 7600s and 7683.50.
- NQ Yearly grid above F0%, monthly/weekly below F0%, above 20/55/100/200-day benchmarks, pivot UTrend but corrective, support 28495.50, resistance near 31090.
- YM Yearly and monthly grids above F0%, weekly grid down-bias, benchmarks in bullish stack, pivot UTrend, support 52410 then 50136, resistance near 53856.
- EMD Yearly grid above F0%, weekly/monthly below F0%, benchmarks fully upward stacked, pivot UTrend, support near 3805.3 and 3829, resistance near 3892.4.
- RTY Yearly above midpoint, weekly/monthly below center, benchmarks upward but daily under 20-day, pivot DTrend on daily, support 2950.1 and 2820.4, resistance near 3059.1 and 3068.4.
- FDAX Yearly above F0%, monthly neutral, weekly below F0%, benchmarks rising, pivot structure soft near overhead resistance, support 24958, 24130, 23827, 22777, resistance 25672 and 26064.
Overall State
- Short-Term: Bearish
- Intermediate-Term: Bearish
- Long-Term: Bullish
Conclusion
Yearly session fib grids remain above F0% for ES, NQ, YM, EMD, RTY, and FDAX, preserving the higher-timeframe bullish backdrop. Weekly and monthly session grids are generally below F0% or in down-bias alignment for ES, NQ, EMD, RTY, and FDAX, with YM the clearest relative exception. Benchmark stacks stay constructive across the complex, but current swing pivots and recent signals show short-term retracement, rotation, and rejection from recent highs in ES, NQ, RTY, and FDAX, while YM and EMD retain stronger structural momentum. Correlation remains broadly aligned at the long-term level, with near-term divergence concentrated in session-grid bias and pivot phase.
Note: Intra-day counter-trend pullbacks or retracements may occur, HTF is context for informational usage and market structure. Glossary: Session Fib Grids periods of YSFG:’Yearly’, MSFG:’Monthly’, WSFG:’Weekly’
For full details visit: AlphaWebTrader Technicals
ES Daily View
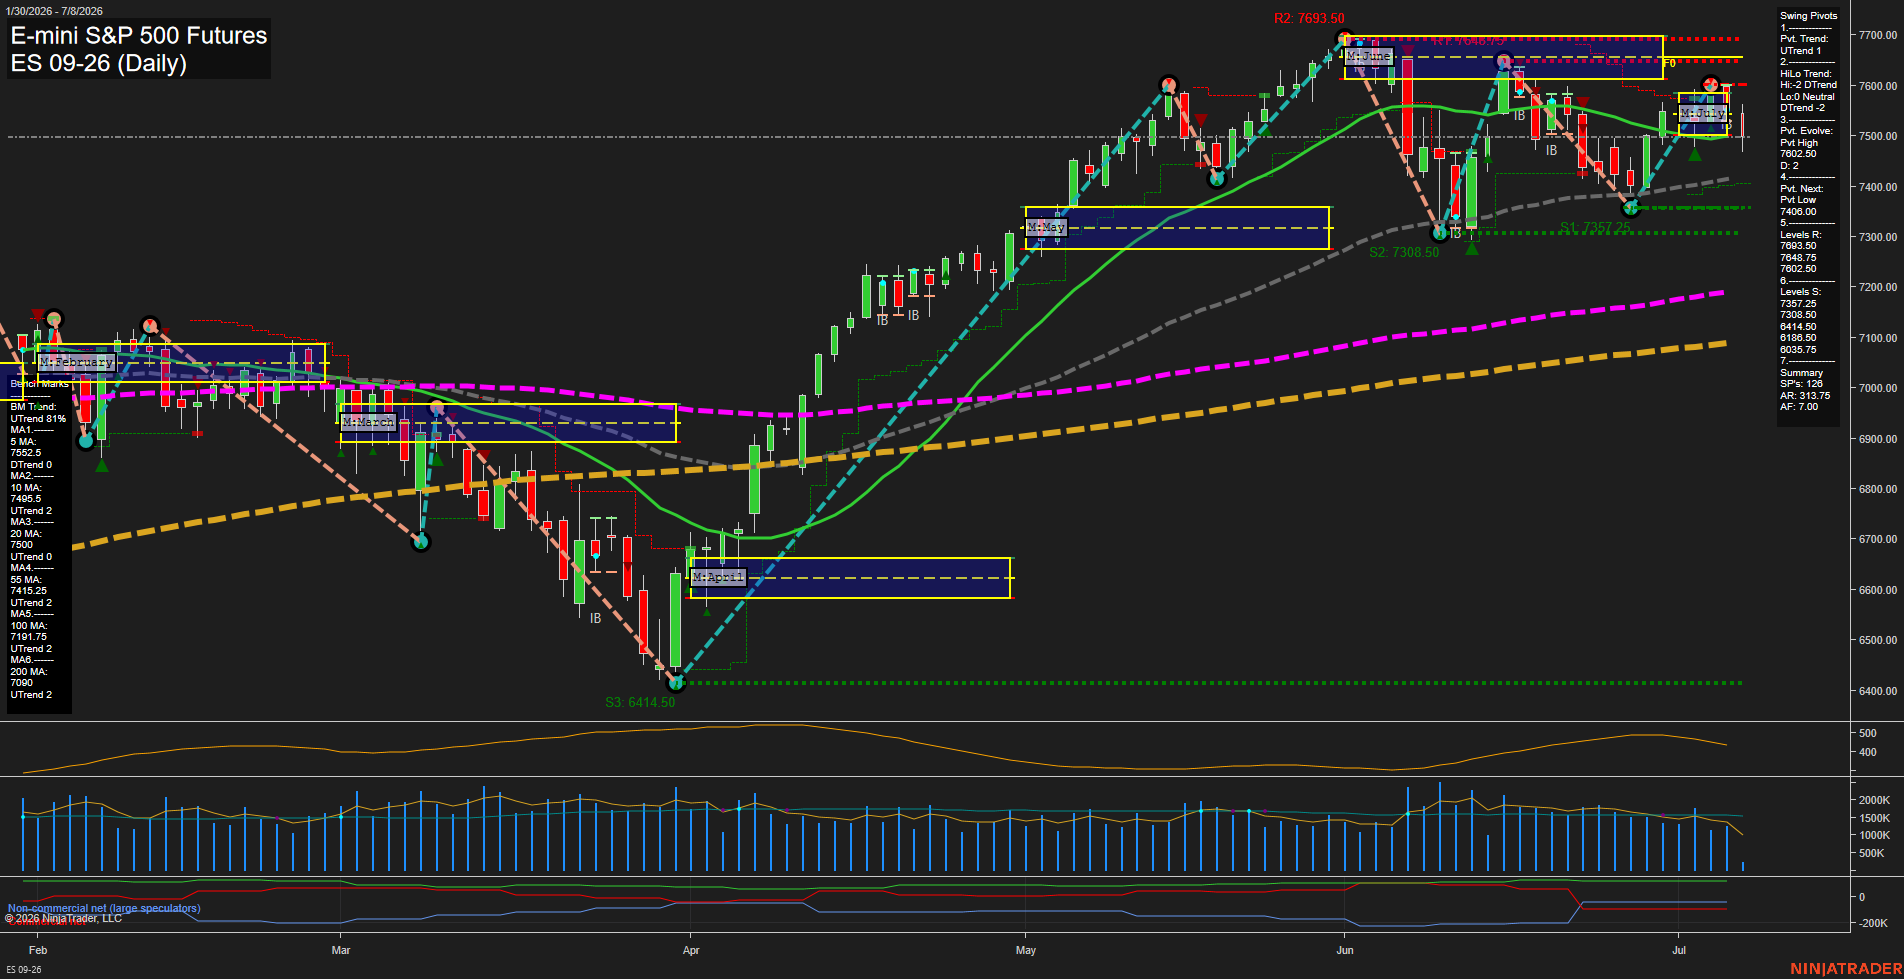
Overall Rating
- Short-Term: Bearish
- Intermediate-Term: Bearish
- Long-Term: Bullish.
Key Insights Summary
Price is trading above the 20-day and 55-day benchmark averages, but the immediate structure has rolled over from the recent June highs and is working back into the upper support band near the 7500 area. The weekly and July monthly fib grids both show price below F0% with negative current bias, which keeps the short-term and intermediate swing tone defensive despite the larger 2026 year grid still holding above F0% with an upward long-term bias. Swing pivot structure remains mixed-to-lower in the near term, with the current pivot trend up but the HiLo trend down and the next pivot focused on a lower low reference. The chart is in a post-run retracement phase after a strong impulsive rally, with recent inside bars and rejection from the upper supply zone near the 7600s showing a loss of momentum and a transition into consolidation-to-pullback behavior. Overall, the long-term backdrop remains constructive while the near-term daily swing path is softer and more range/rotation driven.
View charts on: AlphaWebTrader HTF Charts
NQ Daily View
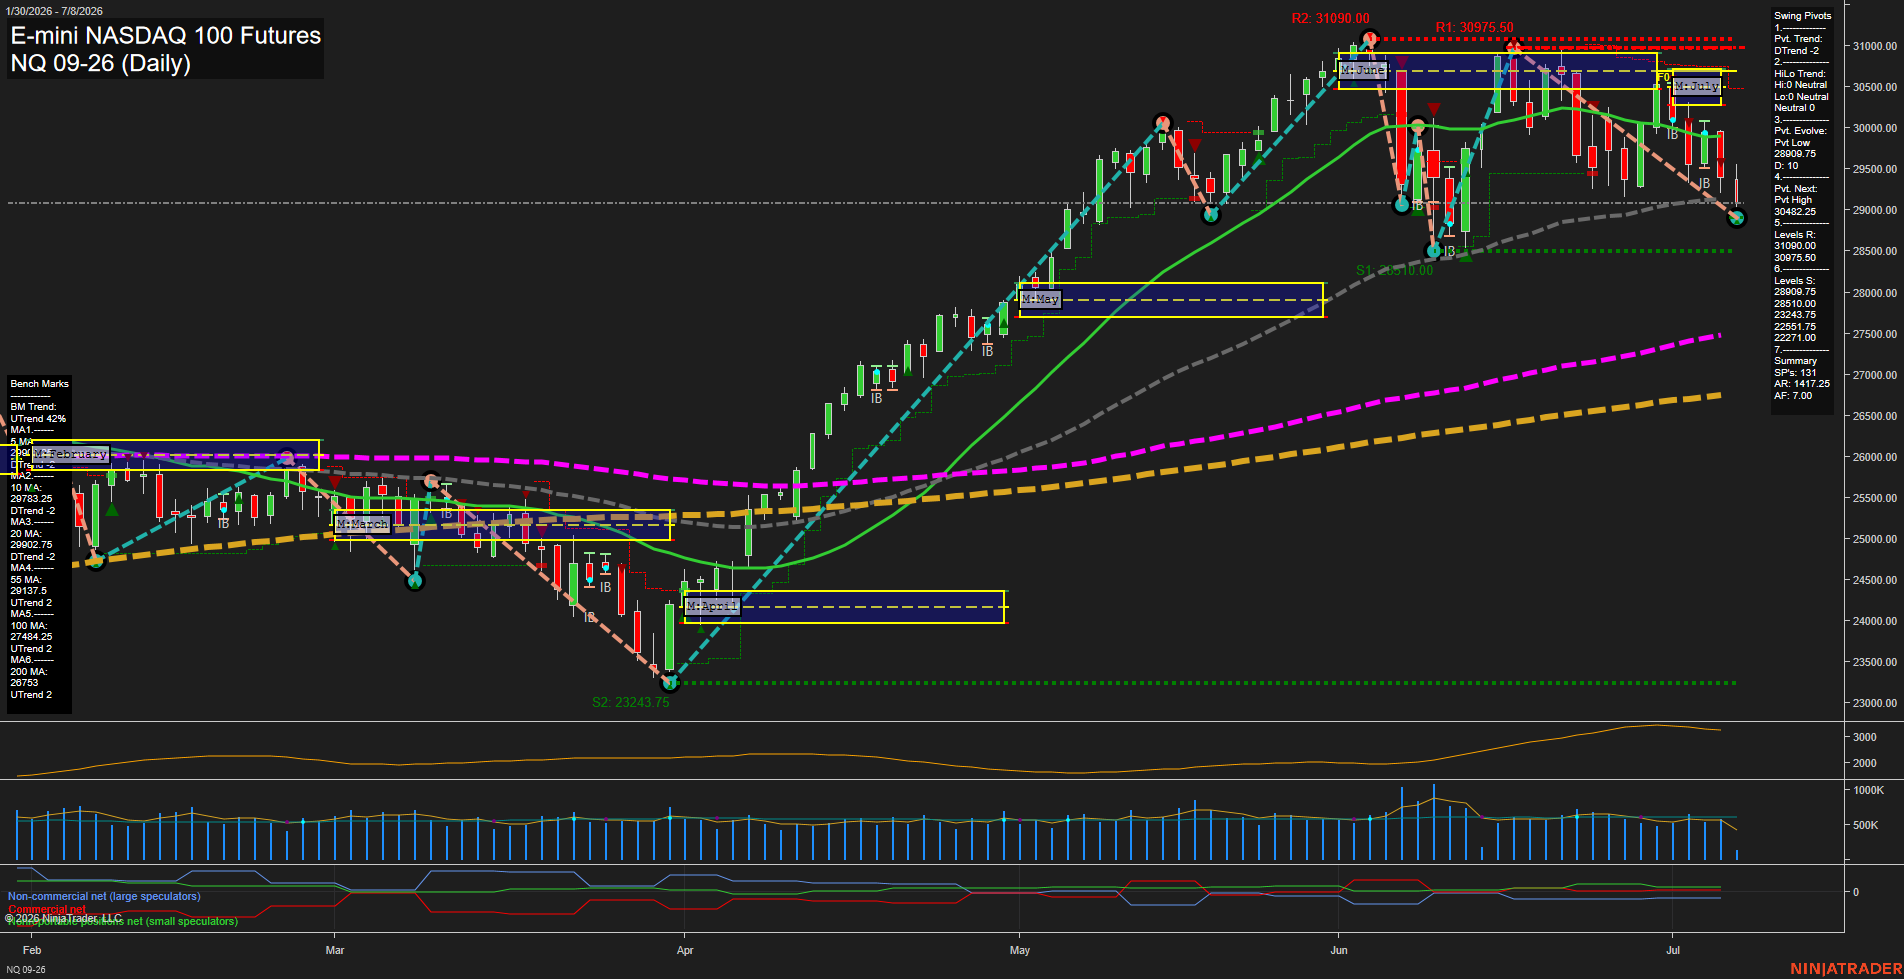
Overall Rating
- Short-Term: Bearish
- Intermediate-Term: Bearish
- Long-Term: Bullish.
Key Insights Summary
Price is trading back under the weekly and monthly session fib grid midlines, with the short-term swing structure pointing lower and the latest pivot evolving into a lower-low sequence. Daily momentum is stretched to the downside, matching the recent short signals and the rejection from the 30K area. The price pattern shows a sharp June rally followed by a distribution phase and a fast July pullback, leaving a clear lower-high / lower-low structure near the top of the prior advance. The long-term backdrop remains constructive because the yearly session grid is still above its center and the 100/200-day benchmarks are above the current market context, but the near-term tape is dominated by a corrective selloff and failed retests of overhead resistance.
View charts on: AlphaWebTrader HTF Charts
CL Daily View
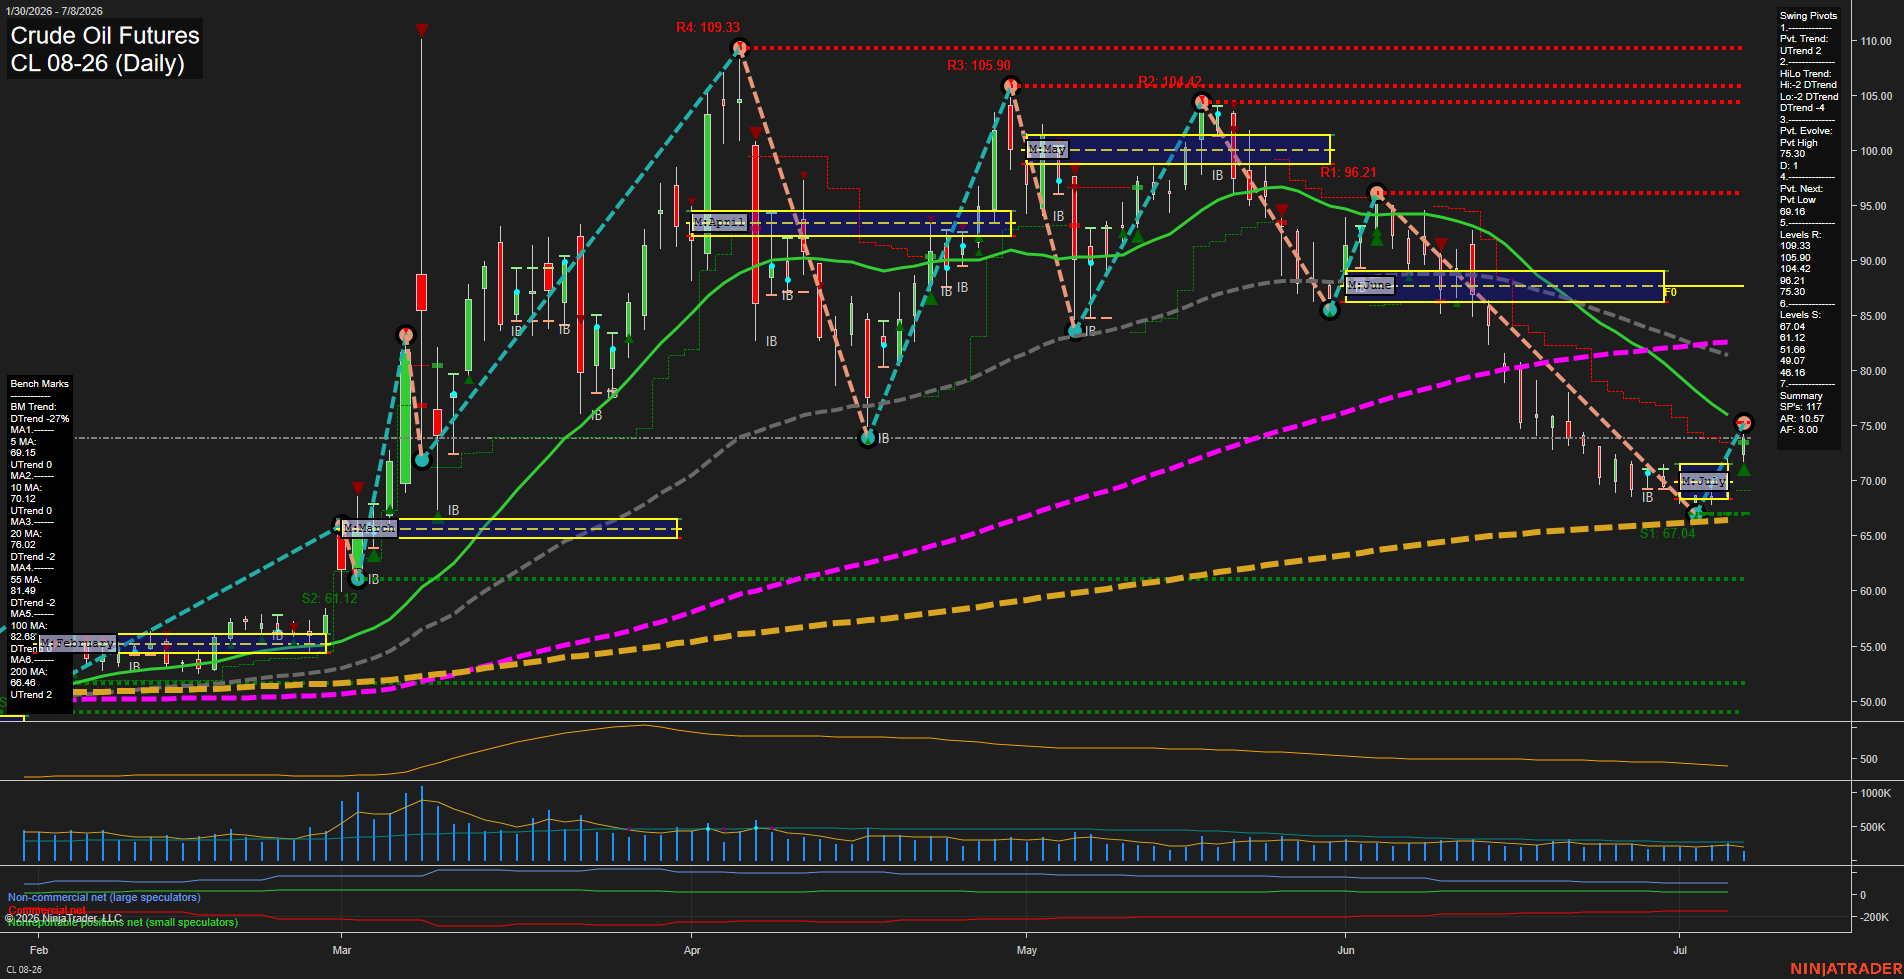
Overall Rating
- Short-Term: Bullish
- Intermediate-Term: Neutral
- Long-Term: Neutral.
Key Insights Summary
Crude oil is in a strong short-term rebound structure after holding the low pivot near 67.04 and pushing back toward the 75 area. The pivot trend has turned up, and the recent signal sequence shows improving upside response across TR120, WSFG, and MSFG. Weekly, monthly, and yearly session fib grids all remain in positive alignment with price above the F0/NTZ bias, which supports the current recovery theme. At the same time, the benchmark moving averages still reflect a broader mixed-to-soft structure, with price back above the very short-term averages but still below the 20, 55, and 100 day benchmarks, keeping the intermediate backdrop more balanced than directional. The chart shows a sharp selloff into early July followed by a V-shaped rebound attempt and a test of prior swing levels, with overhead resistance clustered in the 75 to 96 zone and layered support below 70.
View charts on: AlphaWebTrader HTF Charts
GC Daily View
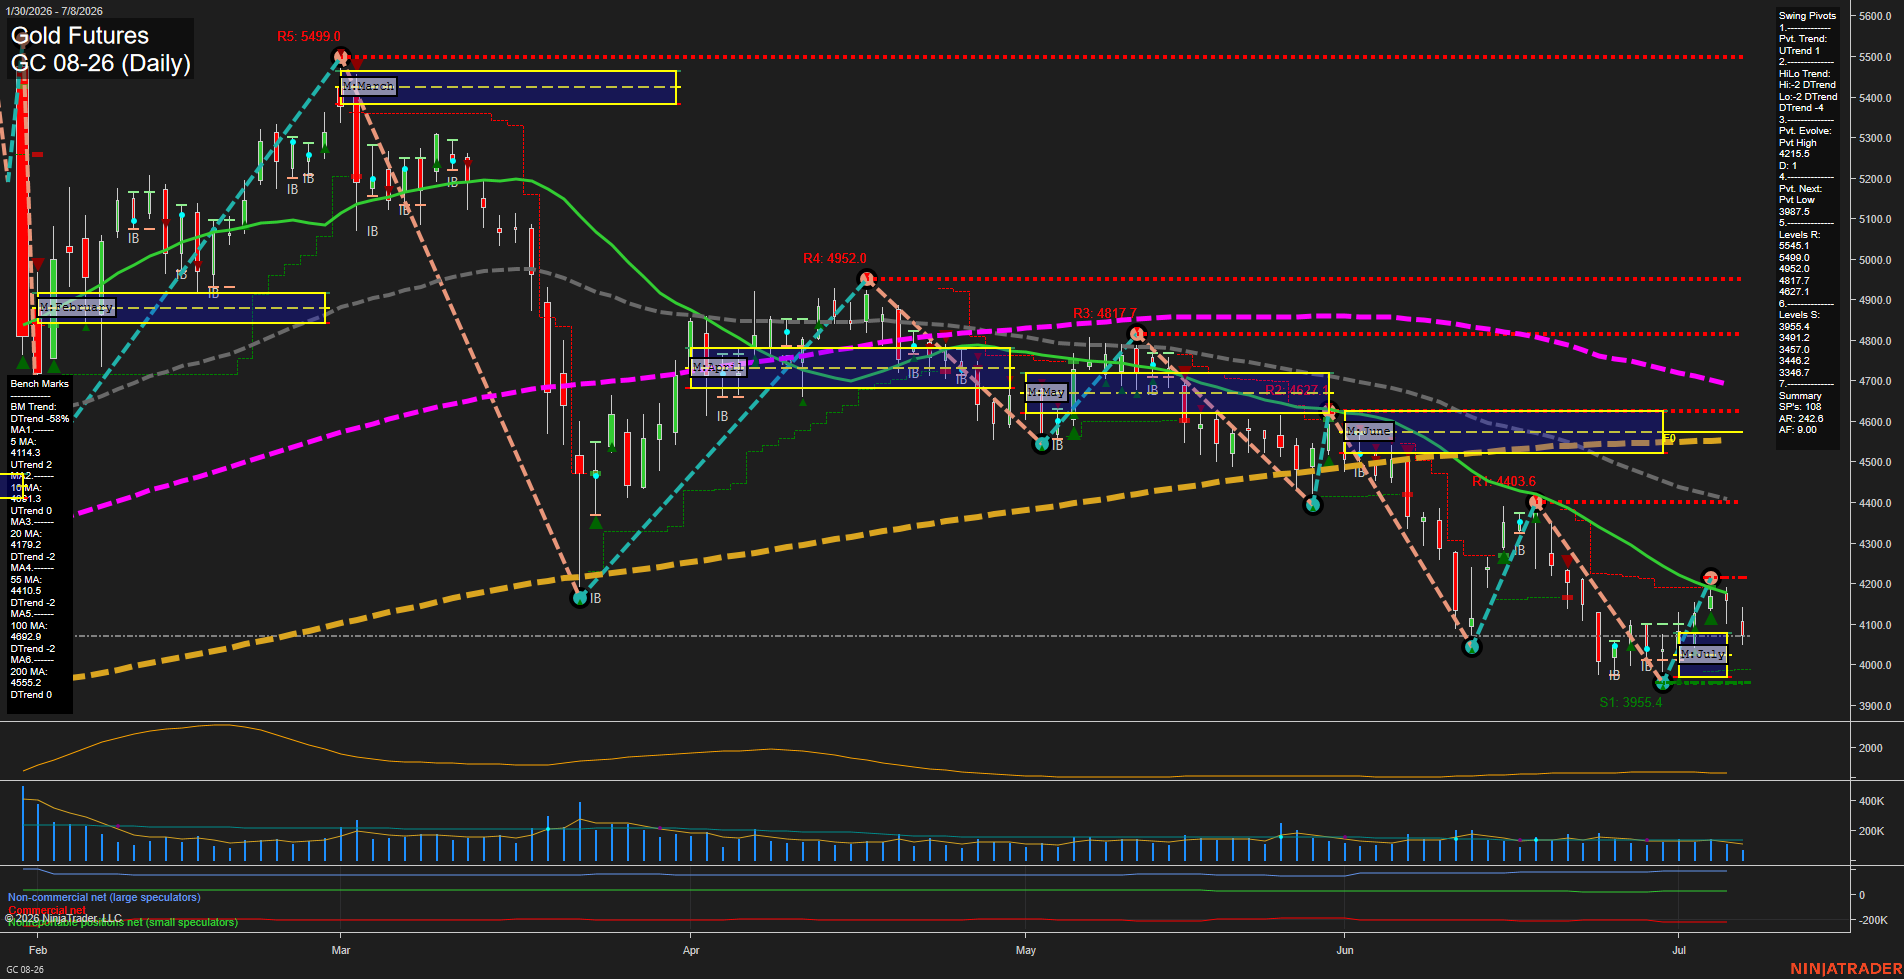
Overall Rating
- Short-Term: Bearish
- Intermediate-Term: Bearish
- Long-Term: Bearish.
Key Insights Summary
Gold futures are in a broad corrective phase with heavy downside pressure from the daily moving-average stack and the intermediate/long-term pivot structure. Price is trading below the 5-day and 10-day benchmarks, while the 20-day, 55-day, 100-day, and 200-day benchmarks all lean lower, confirming a bearish daily framework. The weekly fib grid remains negative and below its F0% line, reinforcing short-term weakness, while the monthly fib grid is still positive and above F0%, reflecting a larger monthly countertrend uplift that has not yet translated into a sustained daily reversal. Swing structure is still anchored by a short-term up pivot, but the intermediate HiLo trend is down and the next pivot reference sits near 3997.5, with the 3955.4 support zone standing out as the nearest major support shelf. Recent signals show a sharp shift from the July 7 MSFG long to the July 8 WSFG short, matching the current selloff and the failed rebound from the early-July retracement. The tape is showing a lower-high, lower-low sequence with fast momentum and expanded daily range behavior, typical of a trending decline with intermittent bounce attempts.
View charts on: AlphaWebTrader HTF Charts