NYSE pre-market action is mixed as TSLA, META and IBIT rise while MSFT and TLT lag, with futures, oil, gold and Fed signals in focus.
Fundamentals: U.S. index futures opened with a mixed tone as tech and AI shares paused, Asia traded lower, and oil prices firmed on shipping risk in the Strait of Hormuz. Fed commentary kept rate-sensitive assets in view, while gold eased ahead of policy minutes. Middle East tensions, defense headlines, and ongoing earnings reactions added to the cross-currents.
Technicals: Pre-market trading shows a mixed setup after a strong prior session, with TSLA, IBIT and META higher while MSFT and TLT were weaker. Futures analysis points to broad bullish structure in ES, YM, EMD and RTY, while NQ and FDAX show more two-way, corrective conditions beneath longer-term uptrends. The note highlights session fib zones, pivots and moving-average alignment across major index contracts.
Pre-Market Trading 360° view Market Radar of: holidays, earnings, eco-news, market-news summary, news sentiment, prior session major ETFs, MAG7, Higher Time Frame Analysis Indices Futures Summary, and E-mini S&P500, Nasdaq 100, NYMEX Crude, Gold Futures Daily Chart analysis.
As of: July 7, 2026 07:16 CT
EcoNews Radar U.S. Events
| Day | Time | Impact | Event |
|---|---|---|---|
| Wed | 10:30 | Low | Crude Oil Inventories |
| Wed | 14:00 | High | FOMC Meeting Minutes |
| Thu | 08:30 | Medium | Unemployment Claims |
EcoNews Summary
Wednesday carries the key market-moving releases for index futures traders, led by FOMC Meeting Minutes and supported by U.S. Crude Oil Inventories. The FOMC minutes are the week’s most important event because they provide detail on the Federal Reserve’s policy discussion and rate outlook, while crude inventories remain relevant through energy-price and inflation channels.
Event Notes:
- Wednesday 10:30 – Low USD Crude Oil Inventories: Weekly U.S. petroleum stock data that tracks changes in crude supply; traders monitor it because inventory draws or builds affect energy prices and headline inflation sensitivity.
- Wednesday 14:00 – High USD FOMC Meeting Minutes: A detailed record of the Federal Reserve’s latest policy meeting; traders watch it for clues on rate stance, inflation assessment, and future policy language.
- Thursday 08:30 – Medium USD Unemployment Claims: Weekly initial jobless claims measure new filings for unemployment benefits; traders monitor labor-market conditions, though this release is lower impact than the FOMC minutes.
Conclusion:
Wednesday is the single most important day, with the FOMC Meeting Minutes as the week’s key event. Market momentum and volume often slow ahead of major events such as FOMC, with increased volatility at release time. News flow around the 10 AM cycle also acts as a catalyst for reversals or continuations. The crude oil inventory release adds an energy-price and inflation lens to the session.
For full details visit: Forex Factory EcoNews
Market News Summary:
Tech leadership, oil disruptions, and Fed-sensitive metals set the tone for index futures, while Asia weakness and rate commentary add cross-currents.
Primary Drivers & Risks:
- Primary Driver: Tech and AI-led equity rotation
- Primary Risk: Oil shock and Fed tightening
Tone:
Mixed, with risk-on tech support offset by macro and geopolitical pressure.
Stock Market / ETFs / Indices:
U.S. tech futures were weaker after Asia turned lower and AI-related shares took a breather. Broader stock market context remained constructive, with the S&P 500 on pace for another strong year and large-cap growth and Nasdaq-linked products still in focus.
Geopolitical:
Strain in the Middle East remained a live market factor, with reports of attacks on commercial ships in the Strait of Hormuz and renewed attention on U.S.-Iran talks. NATO also announced drone purchases, adding to the broader defense and security backdrop.
Oil / Energy:
Oil prices rose on reports tied to ship attacks near Hormuz, but gains were limited by supply growth and softer demand signals. Traders also noted Saudi price cuts, concerns over other shipping corridors, and support levels in WTI and Brent.
Gold / Metals:
Gold slipped ahead of Fed minutes after recent gains, while later commentary pointed to official-sector demand and constrained mine supply supporting both gold and silver. Industrial metals were not a dominant theme in the headlines.
Fed / Financials:
Former Fed President Jim Bullard said core inflation remains too high and that the Federal Reserve may resume tightening later this year after a pause. That backdrop kept rates and policy sensitivity in focus for rate-sensitive assets.
Macro / Other:
Asian equities were mostly lower, led by South Korea after Samsung Electronics disappointed despite strong profit guidance. Bank earnings, ETF positioning, and broader valuation discussion also stayed in view, with volatility noted around financial results.
Conclusion:
Tech leadership and AI exposure remain the main equity support, while the oil complex adds a separate source of market direction. Index futures also face pressure from weaker Asian sentiment and renewed attention on Fed policy.
Secondary inputs include Middle East shipping risks, gold weakness ahead of policy releases, and commentary on possible further tightening. These cross-currents keep the session tied to headline flow rather than a single clean trend.
Market News Sentiment
Market News Articles: 22
- Neutral: 36.36%
- Negative: 31.82%
- Positive: 31.82%
Sentiment Summary: Market news is broadly balanced, with 36% neutral articles and an even split between negative and positive articles at 32% each across 22 headlines.
Conclusion: The news flow shows no dominant directional bias for indices futures day traders.
GLD,Gold Articles: 3
- Negative: 66.67%
- Positive: 33.33%
Sentiment Summary: Gold-related coverage is mostly negative, with 67% negative and 33% positive sentiment across 3 articles.
Conclusion: The overall tone is negative.
USO,Oil Articles: 6
- Neutral: 33.33%
- Positive: 33.33%
- Negative: 33.33%
Sentiment Summary: Oil-related coverage is evenly mixed, with 33% neutral, 33% positive, and 33% negative articles across 6 items.
Conclusion: The snapshot shows no clear directional sentiment bias in oil-related news.
Market Data Snapshot
ETF Snapshot of major stock market ETFs, Mag7, and others as of: July 7, 2026 07:16
Top Movers & Losers
- TSLA 419.77 Bullish 6.69% ▲
- IBIT 36.12 Bullish 3.58% ▲
- META 600.29 Bullish 2.98% ▲
- USO 104.35 Bullish 0.36% ▲
- TLT 85.45 Bearish -0.07% ▼
- MSFT 386.74 Bearish -0.96% ▼
Major Index ETFs: SPY, QQQ, DIA, IWM, IJH
- QQQ 722.82 Bullish 1.43% ▲
- SPY 751.28 Bullish 0.87% ▲
- IWM 298.90 Bullish 0.44% ▲
- IJH 76.42 Bullish 0.43% ▲
- DIA 530.09 Bullish 0.42% ▲
Major index ETFs were broadly bullish, led by QQQ at +1.43% as the most bullish mover. SPY also firmed at +0.87%, while IWM +0.44%, IJH +0.43%, and DIA +0.42% were positive but more muted, with DIA the least positive mover.
Mag 7 Stocks: AAPL, MSFT, GOOG, AMZN, META, NVDA, TSLA
- TSLA 419.77 Bullish 6.69% ▲
- META 600.29 Bullish 2.98% ▲
- GOOG 364.90 Bullish 2.45% ▲
- AAPL 312.66 Bullish 1.31% ▲
- AMZN 244.16 Bullish 0.61% ▲
- NVDA 195.55 Bullish 0.37% ▲
- MSFT 386.74 Bearish -0.96% ▼
Mag7 snapshot is Mixed, with leadership from TSLA +6.69% and follow-through in META +2.98%, GOOG +2.45%, and AAPL +1.31%; AMZN +0.61% and NVDA +0.37% were near-flat bullish, while MSFT was the most bearish mover at -0.96%.
Cross-Market ETFs: TLT, GLD, USO, IBIT
- IBIT 36.12 Bullish 3.58% ▲
- GLD 382.13 Bullish 1.06% ▲
- USO 104.35 Bullish 0.36% ▲
- TLT 85.45 Bearish -0.07% ▼
Mixed tape across the group, with IBIT leading as the most bullish mover at +3.58%, followed by GLD at +1.06% and USO at +0.36%. TLT was the most bearish mover, but its -0.07% move was near-flat.
ETF, Mag7, and Cross-Market ETF Insights
Overall Tone
Mixed-to-Bullish, with equities broadly positive and leadership concentrated in higher-beta names rather than evenly across the full complex.
Equity ETFs and Mag7:
Major Index ETFs were generally aligned to the upside, led by QQQ +1.43% and SPY +0.87%, while IWM +0.44%, IJH +0.43%, and DIA +0.42% were steadier and more modest. In Mag7, TSLA stood out as the most bullish mover at +6.69%, followed by META +2.98% and GOOG +2.45%; MSFT was the most bearish mover at -0.96%, making the group selective rather than uniformly strong. AAPL +1.31%, AMZN +0.61%, and NVDA +0.37% were constructive but less forceful than the leaders.
Cross-Market ETFs:
Cross-market ETFs were mostly constructive but not fully synchronized with equities: IBIT was the strongest mover at +3.58%, GLD added +1.06%, and USO edged higher by +0.36%. TLT was essentially flat-to-lower at -0.07%, showing little hedging strength, while the positive tone in IBIT and GLD points to active strength outside the equity complex. Overall, cross-market flows leaned Mixed-to-Bullish, with the clearest momentum in IBIT and the most bearish move in TLT.
Futures Indices – Higher Time Frame Analysis
Summary of the current state of US Indices Futures based on higher time-frame (HTF) technical analysis as of: 2026-07-07: 07:16 CT.
US Indices Futures
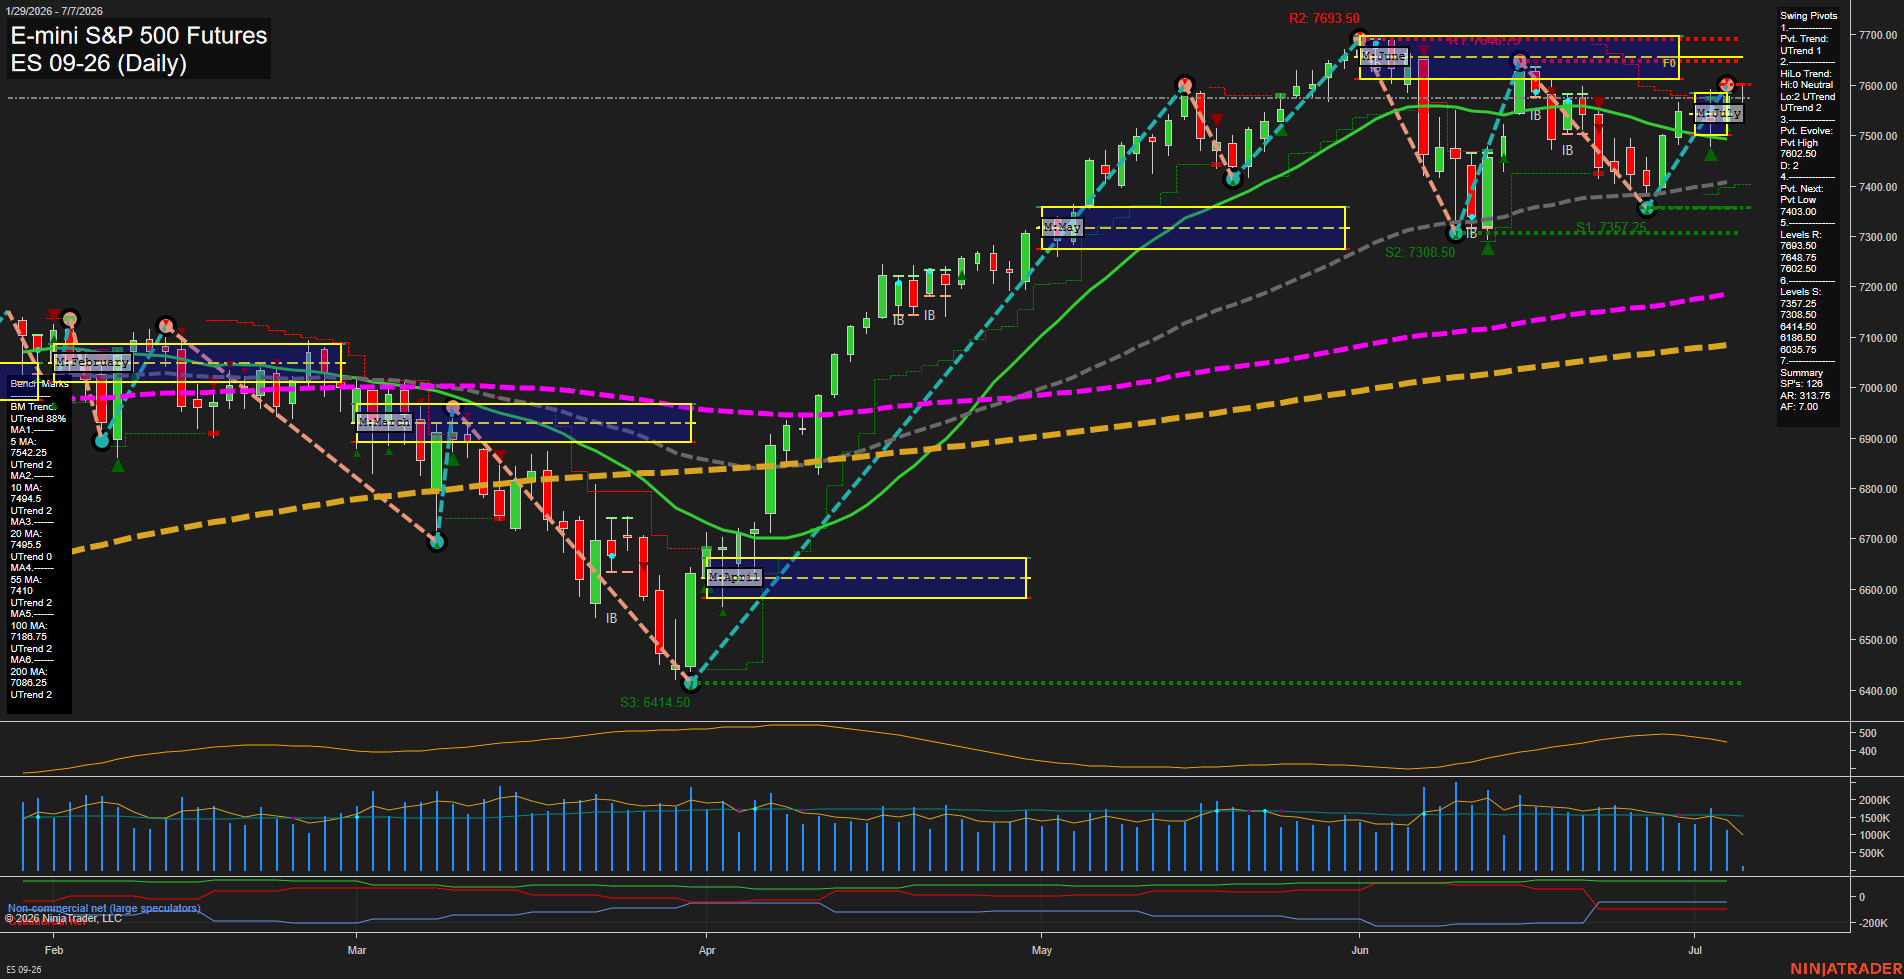
- ES YSFG/MSFG/WSFG above F0%/NTZ, bullish benchmark stack 5-200D, uptrend pivots intact, support 7403.00, 7267.50, resistance near 7802.50, 7683.50.
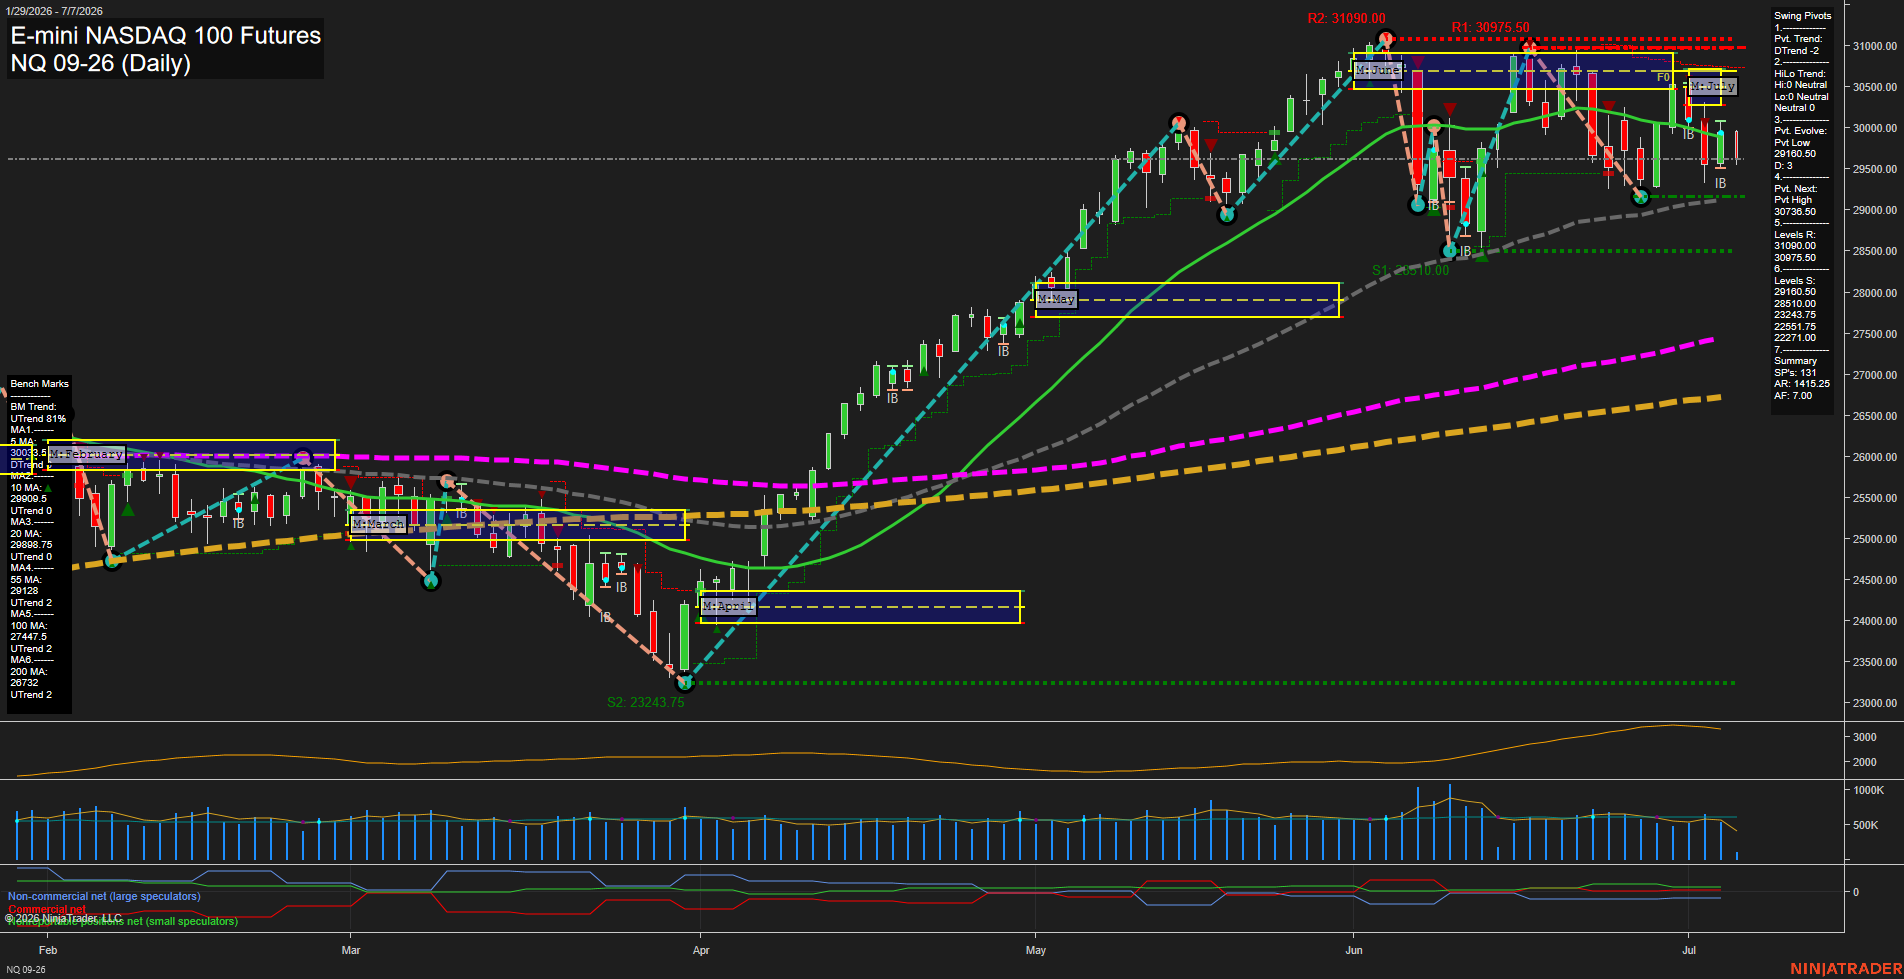
- NQ YSFG above F0%, MSFG/WSFG below NTZ on near-term frames, 55-200D still rising, short/intermediate bearish inside long-term uptrend, support 29160.50, 28510.00, resistance 30730.50.
- YM YSFG/MSFG/WSFG above F0%/NTZ, all benchmarks rising and stacked bullish, uptrend pivots intact, resistance at fresh highs, support ladder at 52289, 50136.
- EMD YSFG above F0%, MSFG in down-bias recovery phase, WSFG bullish, benchmarks 5-200D bullish, UTrend pivots, resistance at highs near 3892.4.
- RTY YSFG/MSFG/WSFG above F0%, UTrend pivots and HiLo constructive, benchmarks rising 20-200D, fresh highs near 3068.4, support 2957.2, 2828.1, 2748.8.
- FDAX YSFG below F0% on weekly, MSFG/YSFG supportive long-term, weekly short-term weak after 26064 rejection, daily bullish above 5-200D, resistance near prior highs.
Overall State
- Short-Term: Bullish
- Intermediate-Term: Bullish
- Long-Term: Bullish
Conclusion
HTF structure remains broadly trend-positive across ES, YM, EMD, and RTY, with YSFG, MSFG, and WSFG generally above F0%/NTZ and benchmark averages aligned higher. NQ is the main mixed component, with short and intermediate weakness while long-term structure stays bullish. FDAX is also mixed at the weekly level, with short-term weakness against a constructive higher-time-frame base. Swing pivots remain predominantly UTrend across the complex, with resistance at or near prior highs and support held at higher pivot references, keeping the broader directional correlation aligned to persistent uptrend structures.
Note: Intra-day counter-trend pullbacks or retracements may occur, HTF is context for informational usage and market structure. Glossary: Session Fib Grids periods of YSFG:’Yearly’, MSFG:’Monthly’, WSFG:’Weekly’
For full details visit: AlphaWebTrader Technicals
ES Daily View
Overall Rating
- Short-Term: Bullish
- Intermediate-Term: Bullish
- Long-Term: Bullish.
Key Insights Summary
Price remains above the weekly, monthly, and yearly F0%/NTZ reference zones, keeping the broader structure in a constructive uptrend. The daily chart shows a strong advance from the April swing low into the June peak, followed by a two-sided consolidation and pullback that is now working back toward the upper benchmark cluster. All benchmark moving averages are aligned in upward trend order, with price holding above the 5, 10, 20, 55, 100, and 200 day measures, which reinforces trend continuity. Swing pivot structure is still upward on both the short-term and intermediate-term readings, while the current pivot map shows a prior high at 7802.50 and a lower reference pivot at 7403.00, framing the present range as a digestion phase inside a larger bullish cycle. Recent signals on the weekly and monthly session fib grids align with the trend and reflect continued upside acceptance after the June pullback. The overall tape looks like a trend-led market with periodic inside bars, retracements, and rejection tests around prior highs and session zones, while the long-term structure stays firmly higher low, higher high.
View charts on: AlphaWebTrader HTF Charts
NQ Daily View
Overall Rating
- Short-Term: Bearish
- Intermediate-Term: Bearish
- Long-Term: Bullish.
Key Insights Summary
Price is trading below the weekly and monthly NTZ/F0% zones, keeping the short-term and intermediate-term tone bearish with lower highs and repeated rejection near the 30k area. The pivot structure remains in a short-term downtrend, with the next upside reversal pivot still higher at 30730.50, while support is anchored at 29160.50 and then 28510.00. Daily benchmarks show near-term averages rolled over beneath price, while the 55-day, 100-day, and 200-day averages remain upward sloping, preserving a constructive long-term backdrop despite the current selloff. The tape reflects a retracement from the June peak, with choppy consolidation and sharp intraday swings after the prior rally, and the latest trade signals align with the downside pressure across WSFG, MSFG, and TR120.
View charts on: AlphaWebTrader HTF Charts
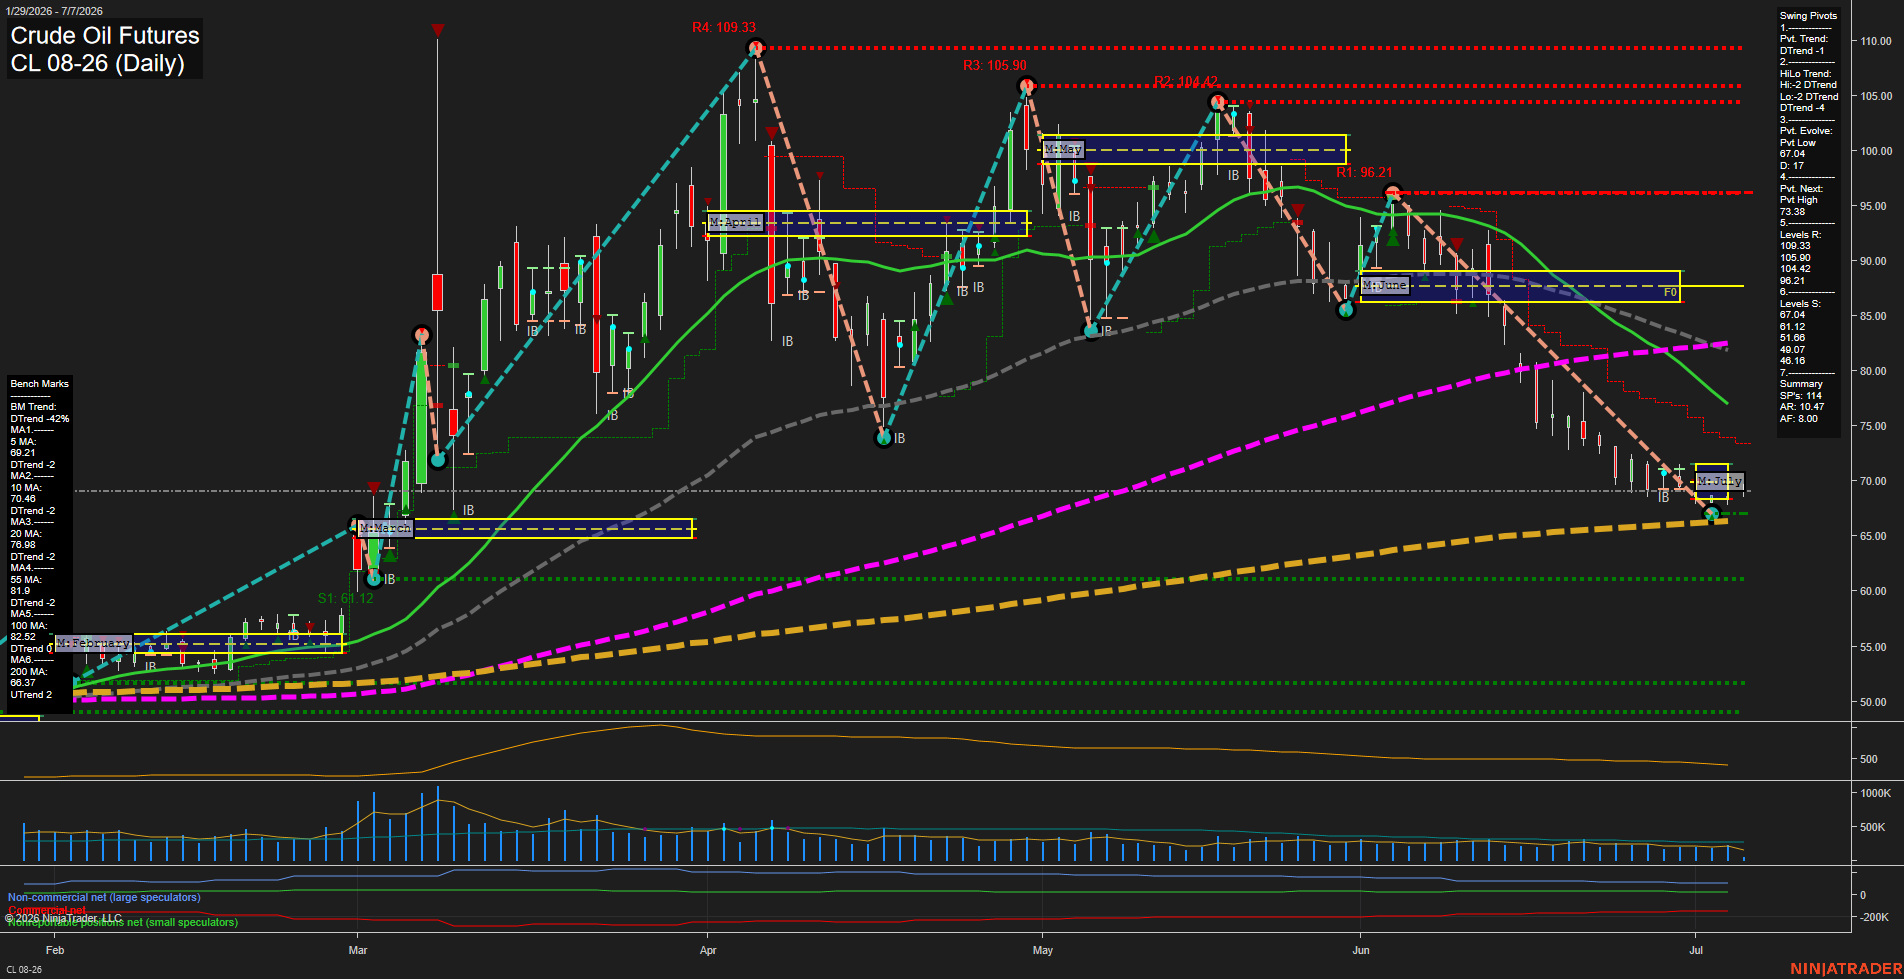
CL Daily View
Overall Rating
- Short-Term: Bearish
- Intermediate-Term: Bearish
- Long-Term: Neutral.
Key Insights Summary
Price is pressing the lower end of the current swing structure after a sharp multi-week selloff from the June highs, with large daily bars and strong downside momentum showing continued trend pressure. The pivot framework remains in a downtrend, and price is below the 5, 10, 20, 55, and 100 day benchmarks, which keeps the intermediate picture firmly weak. The 200 day benchmark still trends higher, and the yearly session grid remains above its center, so the broader long-term backdrop is not fully broken. Near-term action is testing the 67 area, which aligns with the latest pivot support and the lower boundary of the current pullback phase, while overhead resistance remains layered at 73.38, 96.21, and higher swing pivot levels.
View charts on: AlphaWebTrader HTF Charts
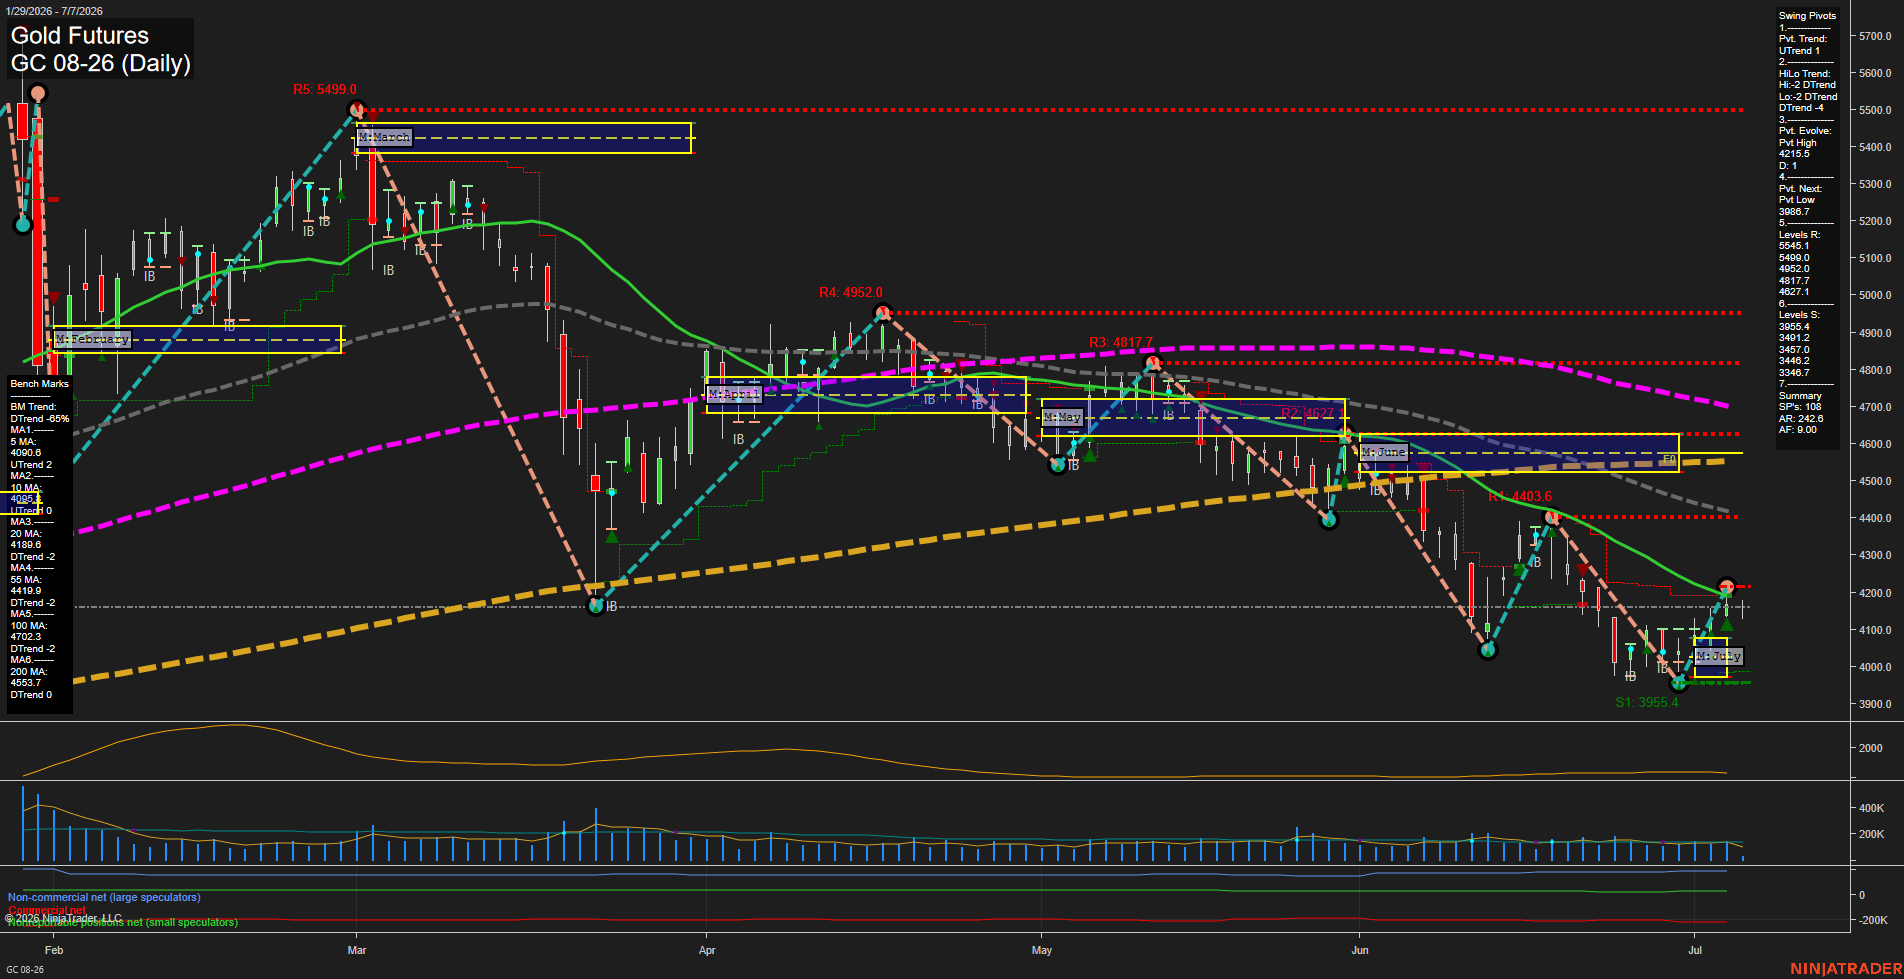
GC Daily View
Overall Rating
- Short-Term: Bearish
- Intermediate-Term: Bearish
- Long-Term: Bearish.
Key Insights Summary
Gold futures remain in a broader corrective downtrend with price trading below the 20, 55, 100, and 200 day benchmarks, while the weekly fib grid stays bearish and the yearly structure remains deeply negative. The daily swing pivot trend has turned up off the recent low, but the intermediate HiLo structure is still down and the market remains capped below the key 4215.5 pivot high and 4198.6 20-day benchmark area. The current tape looks like a bounce within a larger decline, with recent lower highs, lower lows, and repeated rejection near prior pivot resistance zones. Monthly structure is still constructive relative to the month’s fib grid, but the dominant swing profile shows a market testing recovery levels inside a larger bearish trend cycle.
View charts on: AlphaWebTrader HTF Charts