
U.S. stocks fell as chip weakness and AI valuation pressure hit tech, while oil rose on Middle East tensions and gold drew safe-haven demand.
Fundamentals: U.S. equities finished lower as chip stocks weakened and investors reassessed AI valuations, prompting a rotation toward healthcare, staples, and financials. Oil gained after renewed tensions near the Strait of Hormuz and U.S. actions against Iran, while gold remained in focus as a defensive asset. The session reflected a risk-off tone ahead of earnings season.
Technicals: The market roundup highlighted a mixed finish at the NYSE, with USO, MSFT, and META among the top ETF movers while IJH, QQQ, and TSLA lagged. Futures studies showed broad bullish weekly structure in ES, YM, EMD, and RTY, while NQ and FDAX showed shorter-term corrective pressure despite longer-term uptrends. Price action remained tied to moving-average stacks, pivot levels, and session fib zones across major index contracts.
After Market Close daily snapshot: market news summary and sentiment, major ETFs, Magnificent 7 analysis, Indices Futures Higher Time Frame Analysis, and E-mini S&P500, Nasdaq 100, NYMEX Crude, Gold Futures Daily Chart analysis.
As of: July 7, 2026 05:00 CT
Market News Summary:
U.S. equities moved lower as chip stocks weakened and Middle East tensions lifted oil, while gold held in focus as investors rotated toward defensive assets.
Primary Drivers & Risks:
- Primary Driver: Chip selloff and AI valuation pressure
- Primary Risk: Escalating Strait of Hormuz tensions
Tone:
Risk-off, with technology weakness and energy/geopolitical stress.
Stock Market / ETFs / Indices:
Nasdaq and S&P 500 declined as chip stocks came under pressure and investors rotated into healthcare, staples, and financials. The Dow slipped from record levels, while commentary across the session pointed to cooling tech momentum and attention shifting to upcoming earnings.
Geopolitical:
Renewed attacks on commercial vessels near the Strait of Hormuz and U.S. strikes on Iran added a fresh risk backdrop. Market commentary highlighted Iran and the Strait of Hormuz as a major wildcard for risk assets.
Oil / Energy:
Oil prices moved higher after the U.S. revoked a waiver tied to Iranian oil sales and following attacks on shipping near the Strait of Hormuz. Energy commentary also noted continued upside risk even as OPEC+ lifted output and Hormuz reopened.
Gold / Metals:
Gold drew renewed attention as a safe-haven asset, with GLD showing strong twelve-month gains. Central bank demand remained in focus after China added to gold reserves, and gold prices attempted a recovery against trend resistance.
Macro / Other:
Small-cap discussion centered on interest rates and moderating outperformance, while broader market coverage emphasized a cooler tone into earnings season. ETF headlines also highlighted momentum in Japanese equities and continued interest in income-focused portfolios.
Conclusion:
Chip weakness and AI valuation pressure drove the main index losses, while oil gains reflected worsening Middle East tensions. The session centered on a rotation away from high-beta technology and toward defensive sectors and safe-haven assets.
Secondary drivers included the approach of earnings season, small-cap rate sensitivity, and steady demand for gold. Geopolitical developments around Iran and the Strait of Hormuz remained the main cross-current for oil and broad risk sentiment.
Market News Sentiment
Market News Articles: 51
- Neutral: 52.94%
- Positive: 27.45%
- Negative: 19.61%
Sentiment Summary: News flow is mostly neutral at 53%, with positive coverage at 27% and negative coverage at 20%, indicating a mixed but slightly constructive tone.
Conclusion: The article set does not show a strong directional bias, with neutral commentary outweighing both positive and negative sentiment.
GLD,Gold Articles: 7
- Positive: 85.71%
- Neutral: 14.29%
Sentiment Summary: GLD/Gold articles were 86% positive and 14% neutral across 7 articles, indicating a strongly positive news tone.
Conclusion: The snapshot shows positive sentiment concentrated in gold-related coverage, with no negative articles reported.
USO,Oil Articles: 16
- Neutral: 43.75%
- Positive: 31.25%
- Negative: 25.00%
Sentiment Summary: Oil-related coverage is mixed, with 44% neutral, 31% positive, and 25% negative sentiment across 16 articles.
Conclusion: The tone is broadly neutral, with slightly more positive than negative coverage.
Market Data Snapshot
ETF Snapshot of major stock market ETFs, Mag7, and others as of: July 7, 2026 05:00
Top Movers & Losers
- USO 106.97 Bullish 2.51% ▲
- MSFT 394.62 Bullish 2.04% ▲
- META 608.58 Bullish 1.38% ▲
- IJH 75.74 Bearish -0.89% ▼
- QQQ 712.96 Bearish -1.36% ▼
- TSLA 409.25 Bearish -2.51% ▼
Major Index ETFs: SPY, QQQ, DIA, IWM, IJH
- SPY 749.09 Bearish -0.29% ▼
- DIA 528.40 Bearish -0.32% ▼
- IWM 297.63 Bearish -0.42% ▼
- IJH 75.74 Bearish -0.89% ▼
- QQQ 712.96 Bearish -1.36% ▼
Mixed-to-Bearish across the major index ETFs, with the -1.36% move in QQQ leading the downside and IJH the least negative mover at -0.89%; SPY was at -0.29%, DIA at -0.32%, and IWM at -0.42%.
Mag 7 Stocks: AAPL, MSFT, GOOG, AMZN, META, NVDA, TSLA
- MSFT 394.62 Bullish 2.04% ▲
- META 608.58 Bullish 1.38% ▲
- NVDA 197.41 Bullish 0.95% ▲
- AMZN 245.86 Bullish 0.70% ▲
- AAPL 313.90 Bullish 0.40% ▲
- GOOG 366.24 Bullish 0.37% ▲
- TSLA 409.25 Bearish -2.51% ▼
Mixed Mag7 tone: MSFT led the group as the most bullish mover at +2.04%, followed by META at +1.38% and NVDA at +0.95%; AMZN at +0.70%, AAPL at +0.40%, and GOOG at +0.37% were modestly positive, while TSLA was the most bearish mover at -2.51%.
Cross-Market ETFs: TLT, GLD, USO, IBIT
- USO 106.97 Bullish 2.51% ▲
- IBIT 36.26 Bullish 0.39% ▲
- GLD 380.35 Bearish -0.47% ▼
- TLT 84.78 Bearish -0.78% ▼
Mixed cross-market tone: USO led as the most bullish mover at +2.51%, IBIT was mildly bullish at +0.39%, while GLD was bearish at -0.47% and TLT was the most bearish mover at -0.78%.
ETF, Mag7, and Cross-Market ETF Insights
Overall Tone
Mixed, with a selective risk-on feel in parts of Mag7 offset by broad equity ETF softness and a bearish tone in QQQ-led growth.
Equity ETFs and Mag7:
Major Index ETFs were mostly weaker, led by QQQ at -1.36% and IJH at -0.89%, while SPY was near-flat to slightly lower at -0.29% and DIA and IWM also edged down. Mag7 was broadly better aligned than the index ETFs, with MSFT the most bullish mover at +2.04%, followed by META at +1.38% and NVDA at +0.95%; TSLA was the most bearish mover overall at -2.51%. Overall, equities were selective rather than fully aligned, with leadership concentrated in MSFT and META while QQQ and TSLA weighed on the tone.
Cross-Market ETFs:
Cross-market ETFs were mixed, with USO the most bullish mover at +2.51% and IBIT modestly higher at +0.39%. TLT moved lower at -0.78% and GLD also softened at -0.47%, showing some weakness in traditional hedging assets versus the stronger energy move. Compared with equities, the setup leaned risk-selective: commodity strength stood out, while bonds and gold did not provide broad defensive support.
Futures Indices – Higher Time Frame Analysis
Summary of the current state of US Indices Futures based on higher time-frame (HTF) technical analysis as of: 2026-07-07: 17:00 CT.
US Indices Futures
- ES Yearly/Monthly/Weekly fib grids above F0%/NTZ, bullish benchmark stack, uptrend pivots, resistance near 7802.50, support 7403.00 then 7267.50.
- NQ Yearly fib bullish, weekly/monthly below NTZ, daily below WSFG/MSFG bias, pivot downtrend on daily, resistance 30730.50, support 29160.50 then 28510.00.
- YM Yearly/Monthly/Weekly fib grids above F0%/NTZ, benchmarks rising and stacked, UTrend pivots, highs near 53533, support 52289 then 50136.
- EMD Weekly and daily above yearly F0%/NTZ, bullish benchmark stack, UTrend pivots, monthly grid still down-bias, resistance near 3892.4, higher-low structure intact.
- RTY Weekly/Monthly/Yearly fib grids above F0%, benchmarks rising, UTrend pivots, new highs near 3068.4, support 2957.2 then 2828.1.
- FDAX Weekly corrective at 26064 resistance, WSFG below F0%, monthly/yearly above F0%, daily bullish above benchmark stack, support near recent breakout levels.
Overall State
- Short-Term: Neutral
- Intermediate-Term: Bullish
- Long-Term: Bullish
Conclusion
HTF structure remains broadly bullish across ES, YM, EMD, and RTY, with weekly, monthly, and yearly session fib grids generally holding above F0%/NTZ and benchmark moving averages stacked higher. ES and YM show the clearest alignment of WSFG, MSFG, and YSFG in trend continuation. RTY remains in a strong expansion phase, while EMD holds a bullish daily and weekly structure despite a monthly countertrend phase. NQ is the main lagging contract on short- and intermediate-term readings, with daily and weekly structure below session fib bias levels and a corrective pivot sequence, though long-term trend remains higher. FDAX is mixed, with weekly correction against a larger bullish framework and a bullish daily recovery. Correlations remain constructive at the index complex level, with long-term trend alignment intact and short-term rotation concentrated in NQ and FDAX.
Note: Intra-day counter-trend pullbacks or retracements may occur, HTF is context for informational usage and market structure. Glossary: Session Fib Grids periods of YSFG:’Yearly’, MSFG:’Monthly’, WSFG:’Weekly’
For full details visit: AlphaWebTrader Technicals
ES Daily View
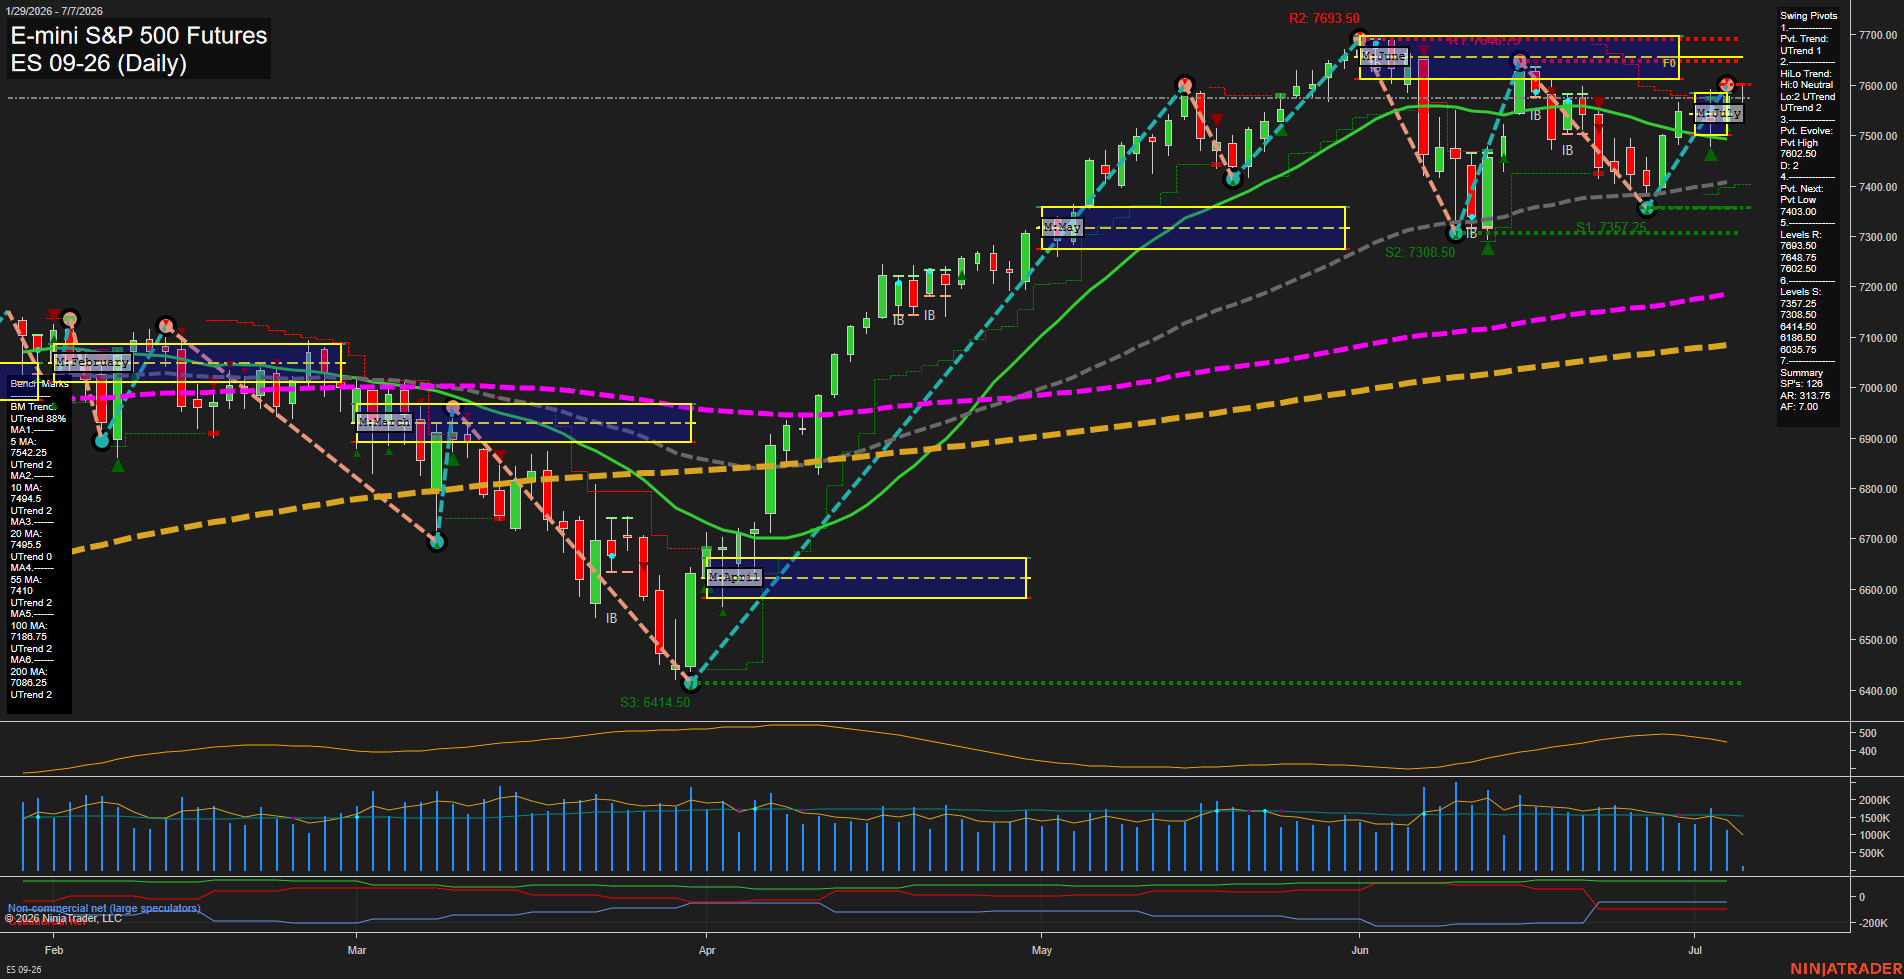
Overall Rating
- Short-Term: Bullish
- Intermediate-Term: Bullish
- Long-Term: Bullish.
Key Insights Summary
Price remains above the weekly, monthly, and yearly F0%/NTZ reference zones, keeping the broader structure in a constructive uptrend. The daily chart shows a strong advance from the April swing low into the June peak, followed by a two-sided consolidation and pullback that is now working back toward the upper benchmark cluster. All benchmark moving averages are aligned in upward trend order, with price holding above the 5, 10, 20, 55, 100, and 200 day measures, which reinforces trend continuity. Swing pivot structure is still upward on both the short-term and intermediate-term readings, while the current pivot map shows a prior high at 7802.50 and a lower reference pivot at 7403.00, framing the present range as a digestion phase inside a larger bullish cycle. Recent signals on the weekly and monthly session fib grids align with the trend and reflect continued upside acceptance after the June pullback. The overall tape looks like a trend-led market with periodic inside bars, retracements, and rejection tests around prior highs and session zones, while the long-term structure stays firmly higher low, higher high.
View charts on: AlphaWebTrader HTF Charts
NQ Daily View
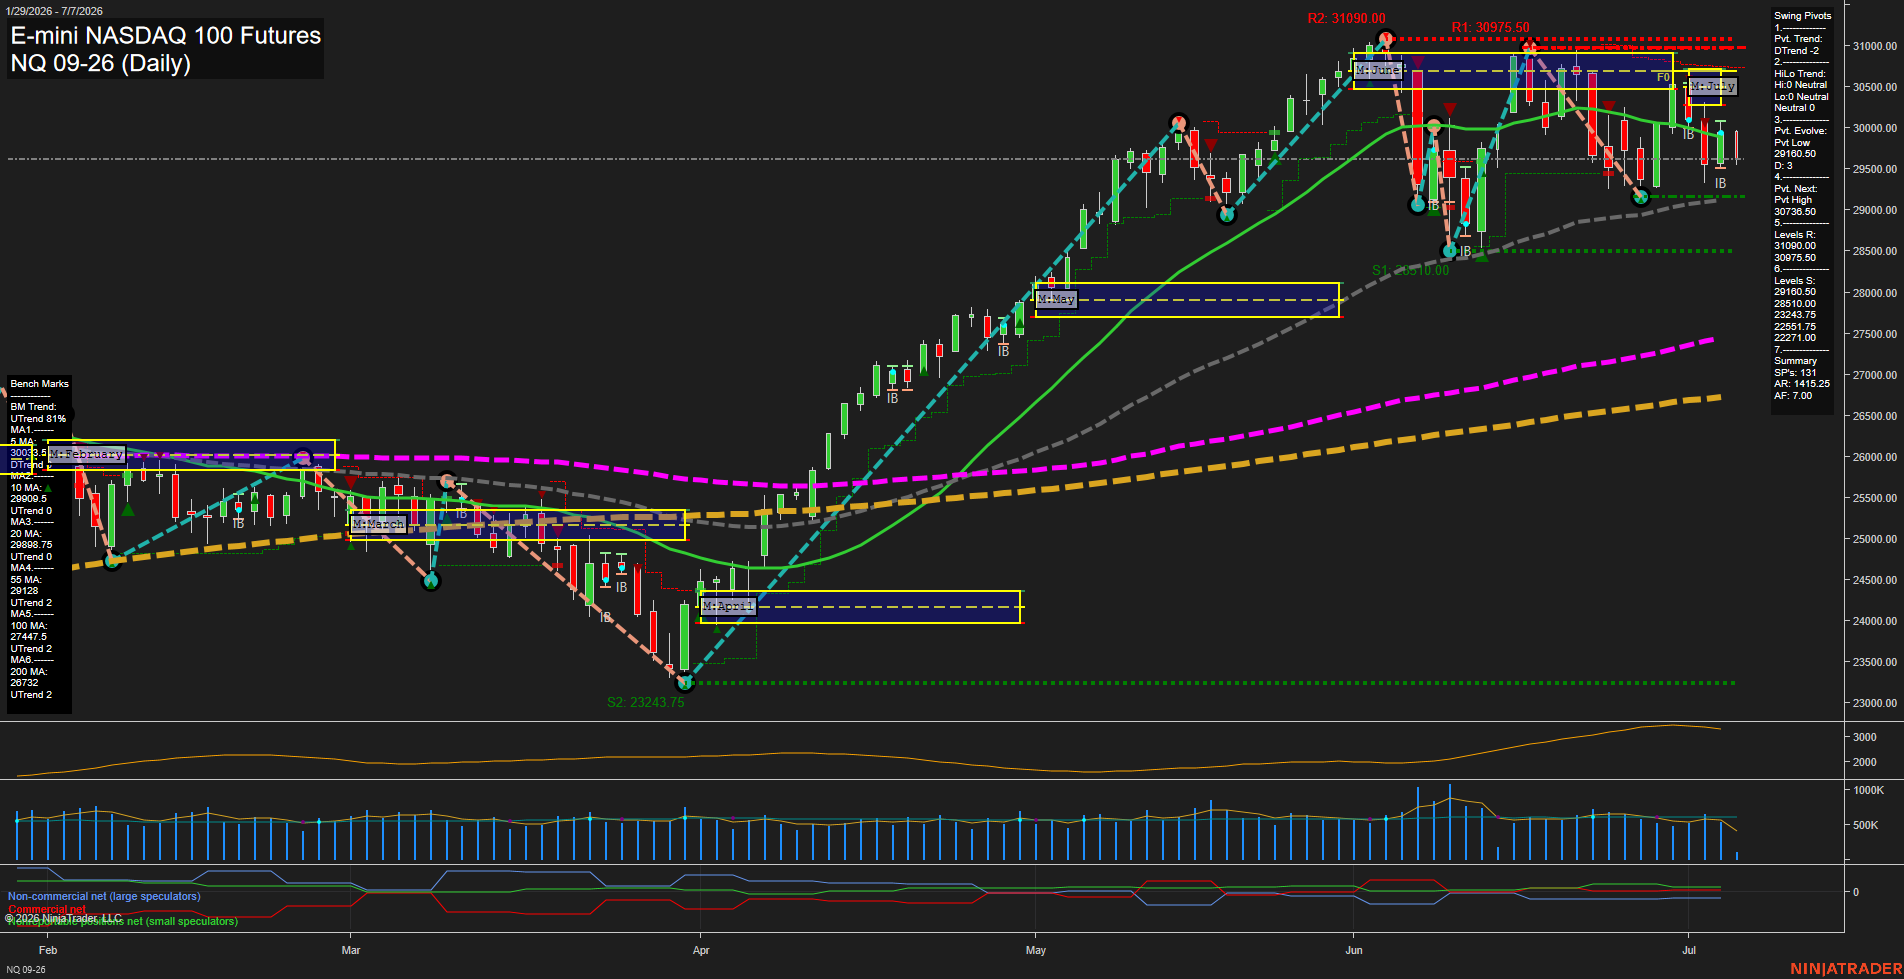
Overall Rating
- Short-Term: Bearish
- Intermediate-Term: Bearish
- Long-Term: Bullish.
Key Insights Summary
Price is trading below the weekly and monthly NTZ/F0% zones, keeping the short-term and intermediate-term tone bearish with lower highs and repeated rejection near the 30k area. The pivot structure remains in a short-term downtrend, with the next upside reversal pivot still higher at 30730.50, while support is anchored at 29160.50 and then 28510.00. Daily benchmarks show near-term averages rolled over beneath price, while the 55-day, 100-day, and 200-day averages remain upward sloping, preserving a constructive long-term backdrop despite the current selloff. The tape reflects a retracement from the June peak, with choppy consolidation and sharp intraday swings after the prior rally, and the latest trade signals align with the downside pressure across WSFG, MSFG, and TR120.
View charts on: AlphaWebTrader HTF Charts
CL Daily View
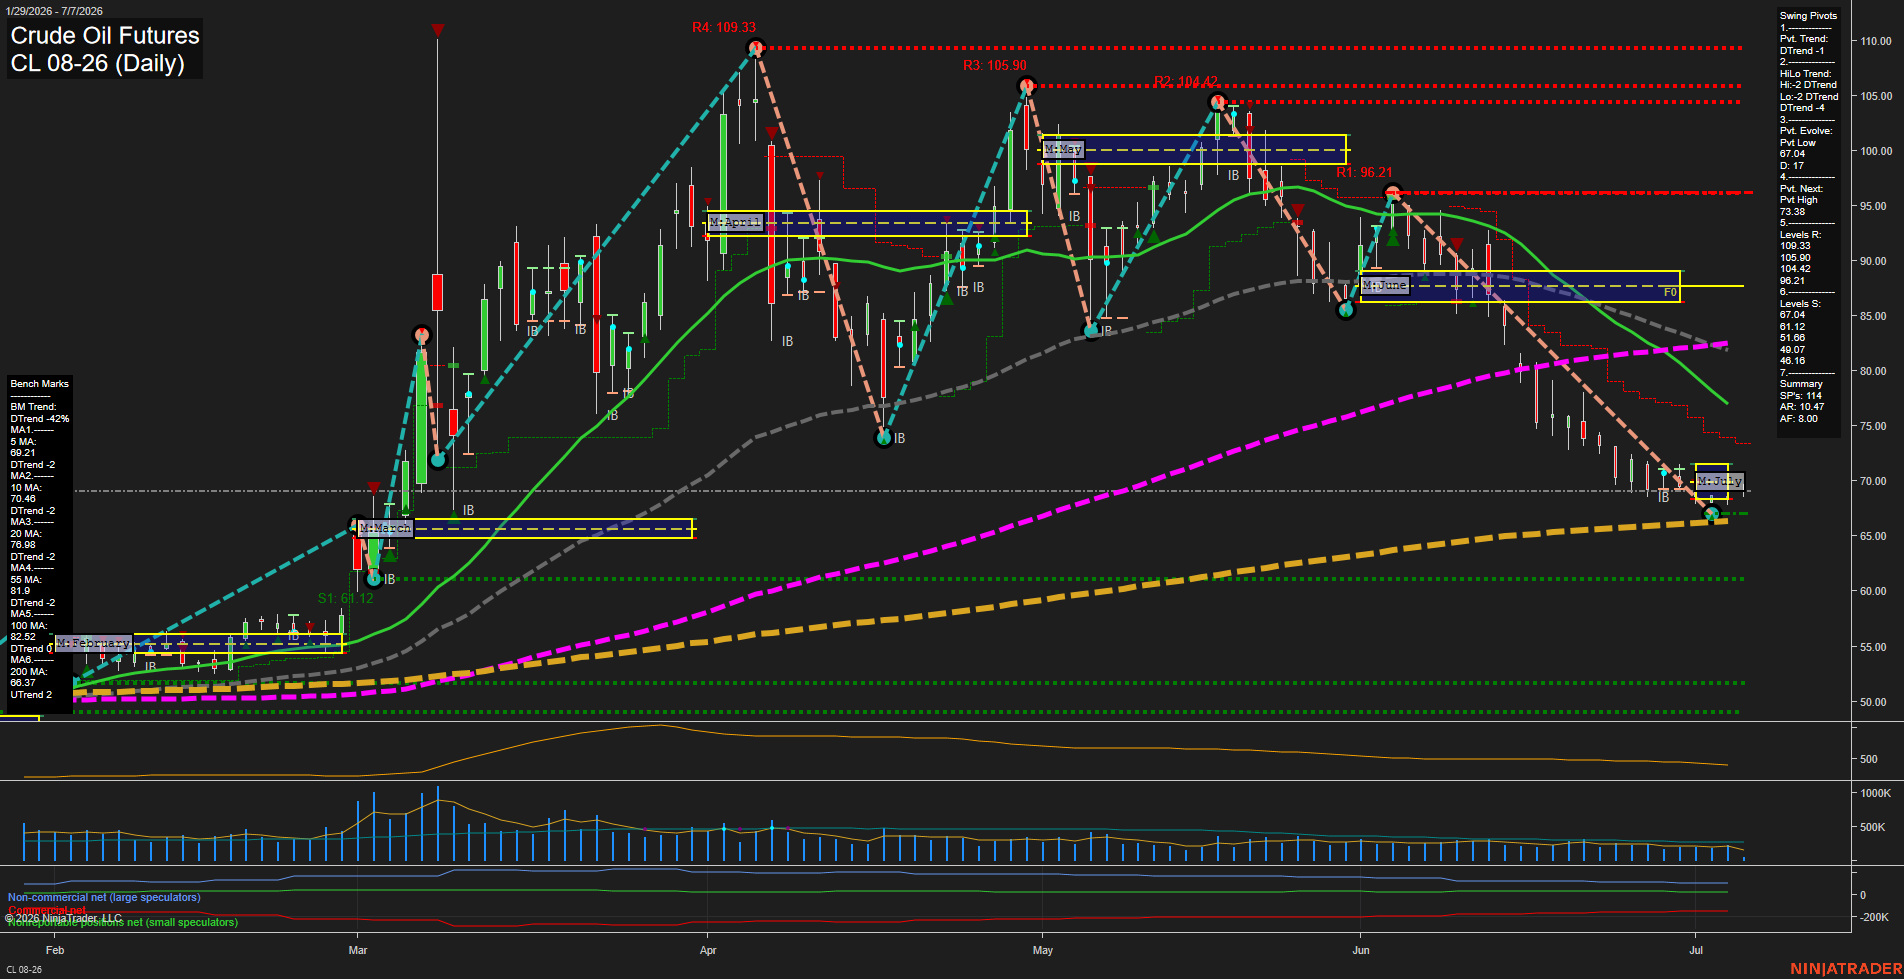
Overall Rating
- Short-Term: Bearish
- Intermediate-Term: Bearish
- Long-Term: Neutral.
Key Insights Summary
Price is pressing the lower end of the current swing structure after a sharp multi-week selloff from the June highs, with large daily bars and strong downside momentum showing continued trend pressure. The pivot framework remains in a downtrend, and price is below the 5, 10, 20, 55, and 100 day benchmarks, which keeps the intermediate picture firmly weak. The 200 day benchmark still trends higher, and the yearly session grid remains above its center, so the broader long-term backdrop is not fully broken. Near-term action is testing the 67 area, which aligns with the latest pivot support and the lower boundary of the current pullback phase, while overhead resistance remains layered at 73.38, 96.21, and higher swing pivot levels.
View charts on: AlphaWebTrader HTF Charts
GC Daily View
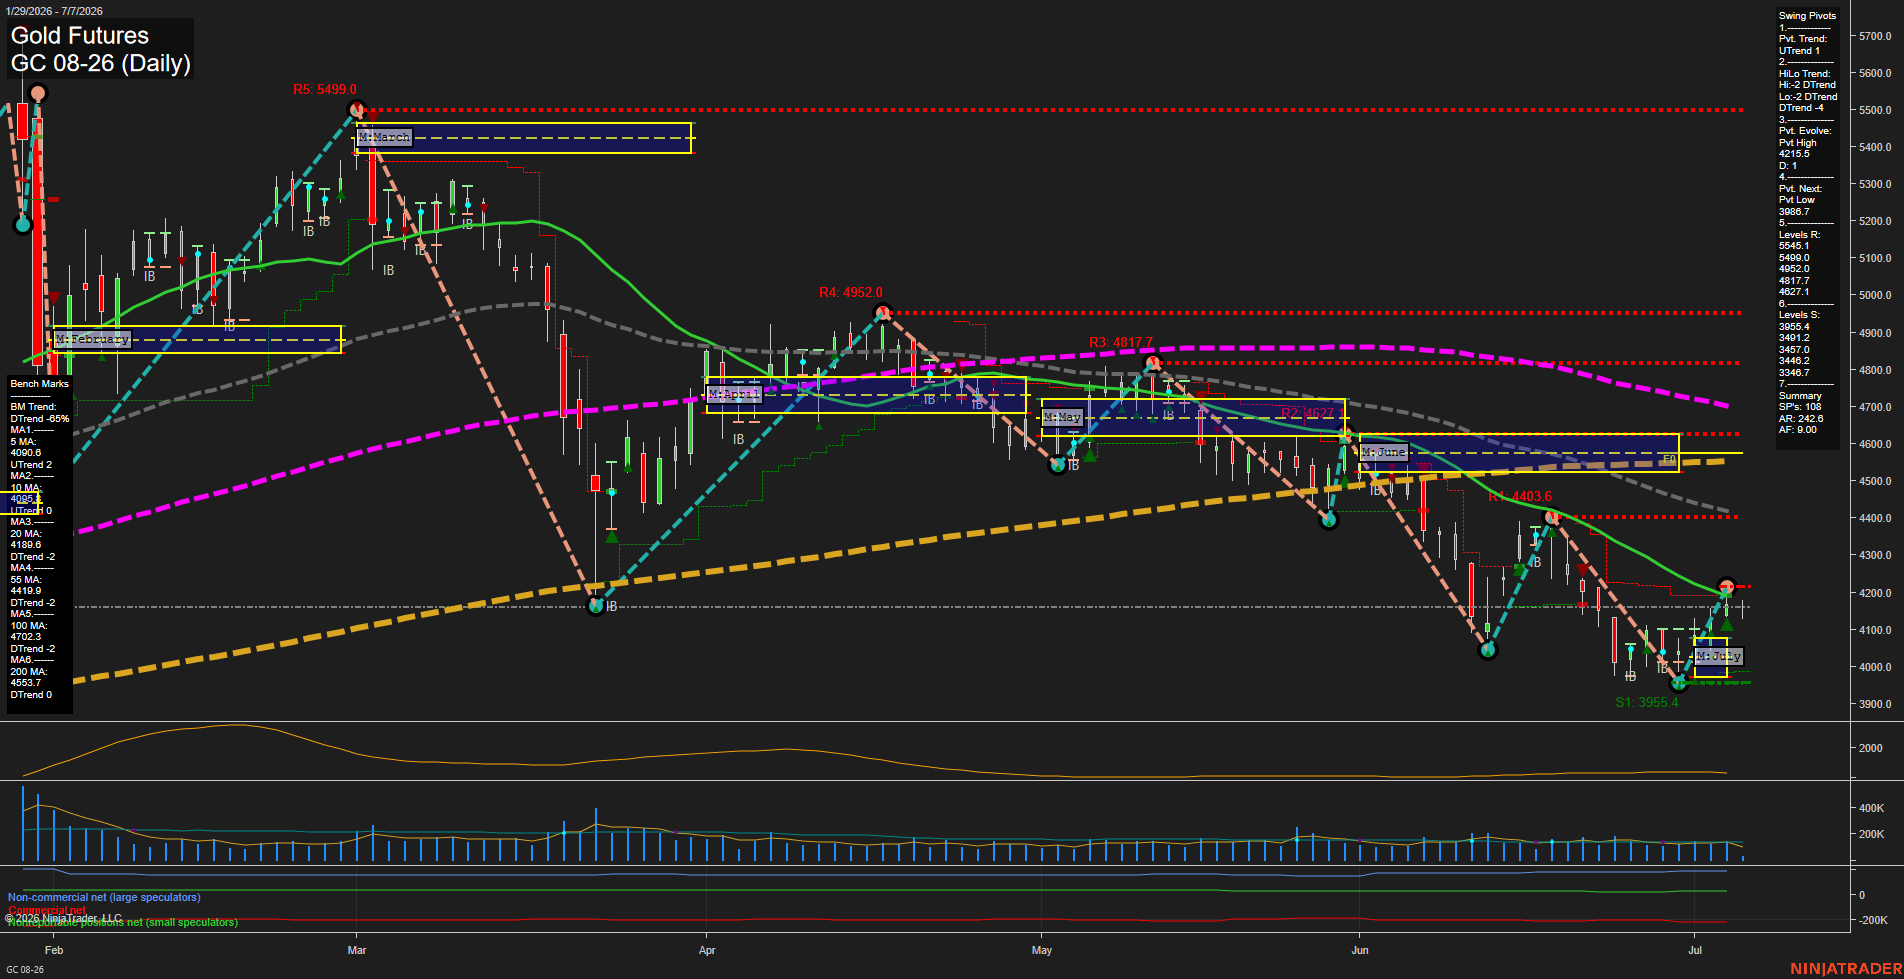
Overall Rating
- Short-Term: Bearish
- Intermediate-Term: Bearish
- Long-Term: Bearish.
Key Insights Summary
Gold futures remain in a broader corrective downtrend with price trading below the 20, 55, 100, and 200 day benchmarks, while the weekly fib grid stays bearish and the yearly structure remains deeply negative. The daily swing pivot trend has turned up off the recent low, but the intermediate HiLo structure is still down and the market remains capped below the key 4215.5 pivot high and 4198.6 20-day benchmark area. The current tape looks like a bounce within a larger decline, with recent lower highs, lower lows, and repeated rejection near prior pivot resistance zones. Monthly structure is still constructive relative to the month’s fib grid, but the dominant swing profile shows a market testing recovery levels inside a larger bearish trend cycle.
View charts on: AlphaWebTrader HTF Charts