U.S. futures gain on AI-led tech optimism as traders track ETF movers, index resistance, Treasury yields, China data and Middle East shipping risks.
Fundamentals: U.S. index futures advanced as Amazon’s cloud results renewed AI demand optimism, lifting technology shares and supporting Asian markets. Higher Treasury yields following the Fed’s steady-rate decision, China’s manufacturing contraction and ongoing Middle East shipping disruptions remained key market cross-currents. Employment cost and consumer sentiment data are also scheduled.
Technicals: Pre-market focus includes strong prior-session gains in Microsoft, Amazon and Tesla, while Meta, Apple and USO declined. Index futures show broadly constructive long-term trends, but several daily charts remain in countertrend recoveries beneath key moving averages and pivot resistance. Traders are monitoring resistance in ES, NQ, YM, RTY and FDAX alongside mixed E-mini S&P and Russell momentum.
Pre-Market Trading 360° view Market Radar of: holidays, earnings, eco-news, market-news summary, news sentiment, prior session major ETFs, MAG7, Higher Time Frame Analysis Indices Futures Summary, and E-mini S&P500, Nasdaq 100, NYMEX Crude, Gold Futures Daily Chart analysis.
As of: July 31, 2026 07:16 CT
Earnings Radar
Monitoring for earnings releases by the Magnificent 7, AI-tech-related firms, and major financial institutions.
- AMD Release: 2026-08-04 T:AMC
- MCHP Release: 2026-08-04 T:AMC
Conclusion: AMD and Microchip Technology report after the Aug. 4 close, placing semiconductor and AI-related earnings at the center of index-futures attention; market momentum and volume can slow ahead of these releases.
For full details visit: Yahoo Earnings Calendar
EcoNews Radar U.S. Events
| Day | Time | Impact | Event |
|---|---|---|---|
| Fri | 08:30 | Medium | Employment Cost Index q/q |
| Fri | 10:00 | Medium | Revised UoM Consumer Sentiment |
| Fri | 10:00 | Medium | Revised UoM Inflation Expectations |
EcoNews Summary
No qualifying high-impact EcoNews events are listed. The listed releases are medium-impact U.S. labor-cost and consumer-survey data and are excluded because they do not relate directly to oil, crude inventories, energy prices, or petroleum supply.
Event Notes:
- No qualifying events under the specified inclusion criteria.
Conclusion:
No single qualifying most important event is identified for the week. Friday is the only listed data day, but its releases do not meet the required high-impact or energy-related criteria.
For full details visit: Forex Factory EcoNews
Market News Summary:
U.S. index futures advanced on renewed AI optimism, while higher Treasury yields, China growth weakness, and Middle East energy disruptions remained key cross-currents.
Primary Drivers & Risks:
- Primary Driver: AI-led technology futures rebound
- Primary Risk: Rising yields and inflation concerns
Tone:
Constructive for equity futures, with elevated macro and geopolitical risk.
Stock Market / ETFs / Indices:
U.S. futures rose before the open as Amazon’s cloud results revived AI demand enthusiasm: Nasdaq 100 futures gained 1.22%, S&P 500 futures added 0.48%, and Dow futures rose 340 points. Asian equities also rallied, led by sharp gains in South Korean technology shares and a 2.7% rise in Japan’s Nikkei; Apple’s cautious outlook and reports of an AI-stock rout remained offsets.
Geopolitical:
The U.S.-Iran conflict and disruptions around the Strait of Hormuz and Red Sea continued to reshape energy shipping and tanker availability. Chinese use of U.S. AI-model outputs for defense-system research and reports of AI cyber testing added technology-security concerns.
Oil / Energy:
Oil fell more than $1 as crude traffic through Hormuz recovered to roughly 30% to 35% of pre-war levels, easing the immediate supply premium. Prices remained substantially higher for the month, while ongoing transit disruptions supported energy-sector earnings and elevated European fuel costs through refining margins.
Gold / Metals:
Gold slipped in Asian trade and remained within its recent consolidation range as markets assessed the Fed decision, dollar moves, inflation data, and geopolitical tensions. Stronger central-bank gold buying in the second quarter and a persistent silver supply deficit supported longer-term metals demand context.
Fed / Financials:
Treasury yields rose, led by short maturities, after the Fed held rates steady and investors assessed Chairman Kevin Warsh’s communication. Bond-market commentary emphasized the need for continued commitment to the inflation fight, creating a rate-sensitive headwind for equities.
Macro / Other:
China’s official manufacturing PMI unexpectedly indicated contraction, increasing pressure on Beijing to provide growth support. The Bank of Japan left policy unchanged and maintained its view of inflation around 2%, while coordinated Japan-Korea currency intervention affected the yen and won.
Conclusion:
AI-related earnings enthusiasm lifted U.S. futures and supported broad Asian equity strength. Technology leadership remained the central equity-market catalyst.
Higher Treasury yields and inflation credibility concerns restrained the risk backdrop. China’s manufacturing contraction and unresolved Middle East transit disruption added global growth and energy-price cross-currents.
Market News Sentiment
Market News Articles: 21
- Positive: 38.10%
- Negative: 33.33%
- Neutral: 28.57%
Sentiment Summary: Market news sentiment is mixed, with 38% positive, 33% negative, and 29% neutral coverage across 21 articles.
Conclusion: Positive coverage holds a narrow lead over negative coverage, indicating broadly balanced news flow for indices futures day traders.
GLD,Gold Articles: 3
- Neutral: 66.67%
- Negative: 33.33%
Sentiment Summary: Gold coverage is predominantly neutral at 67%, with 33% negative sentiment across three articles.
Conclusion: The snapshot indicates a mostly neutral tone toward GLD and gold, with a smaller negative component.
USO,Oil Articles: 7
- Negative: 42.86%
- Positive: 42.86%
- Neutral: 14.29%
Sentiment Summary: USO/Oil coverage is evenly split, with 43% positive, 43% negative, and 14% neutral articles across 7 reports.
Conclusion: Oil-related news presents a balanced sentiment backdrop for indices futures day traders, with no dominant directional tone.
Market Data Snapshot
ETF Snapshot of major stock market ETFs, Mag7, and others as of: July 31, 2026 07:16
Top Movers & Losers
- MSFT 451.10 Bullish 15.51% ▲
- AMZN 235.50 Bullish 3.90% ▲
- TSLA 308.85 Bullish 3.53% ▲
- AAPL 333.43 Bearish -1.41% ▼
- USO 127.48 Bearish -1.42% ▼
- META 539.03 Bearish -7.95% ▼
Major Index ETFs: SPY, QQQ, DIA, IWM, IJH
- QQQ 683.55 Bullish 3.30% ▲
- SPY 741.69 Bullish 1.68% ▲
- IWM 292.59 Bullish 1.39% ▲
- DIA 521.51 Bullish 1.18% ▲
- IJH 75.35 Bullish 0.83% ▲
Major index ETFs were Bullish across the group: QQQ led with +3.30%, followed by SPY at +1.68%, IWM at +1.39%, and DIA at +1.18%. IJH was the least positive mover at +0.83%, while all five ETFs remained Bullish.
Mag 7 Stocks: AAPL, MSFT, GOOG, AMZN, META, NVDA, TSLA
- MSFT 451.10 Bullish 15.51% ▲
- AMZN 235.50 Bullish 3.90% ▲
- TSLA 308.85 Bullish 3.53% ▲
- NVDA 195.04 Bullish 2.65% ▲
- GOOG 333.68 Bearish -0.62% ▼
- AAPL 333.43 Bearish -1.41% ▼
- META 539.03 Bearish -7.95% ▼
Mixed Mag7 snapshot: MSFT is the most bullish mover at +15.51%, followed by AMZN +3.90%, TSLA +3.53%, and NVDA +2.65%. META is the most bearish mover at -7.95%, with AAPL at -1.41% and GOOG at -0.62%.
Cross-Market ETFs: TLT, GLD, USO, IBIT
- IBIT 36.70 Bullish 1.94% ▲
- GLD 377.16 Bullish 1.64% ▲
- TLT 82.80 Bearish -0.06% ▼
- USO 127.48 Bearish -1.42% ▼
Mixed cross-market conditions: IBIT is the most bullish mover at +1.94%, followed by GLD at +1.64%. USO is the most bearish mover at -1.42%, while TLT is marginally bearish and near-flat at -0.06%.
ETF, Mag7, and Cross-Market ETF Insights
Overall Tone
Mixed, with Bullish equity-index and select technology strength alongside Bearish pressure in several major technology names and oil.
Equity ETFs and Mag7:
Major Index ETFs were broadly Bullish: QQQ led at +3.30%, followed by SPY at +1.68%, IWM at +1.39%, DIA at +1.18%, and IJH at +0.83%. Mag7 performance was selective, with MSFT the most bullish mover at +15.51%, while AMZN, TSLA, and NVDA were Bullish; META was the most bearish mover at -7.95%, with AAPL at -1.41% and GOOG at -0.62%.
Cross-Market ETFs:
Cross-market ETFs were Mixed: IBIT was the most bullish mover at +1.94%, while GLD was also Bullish at +1.64%. USO was the most bearish mover at -1.42%, while TLT was marginally Bearish at -0.06%, showing limited bond movement versus Bullish gold and bitcoin exposure.
Futures Indices – Higher Time Frame Analysis
Summary of the current state of US Indices Futures based on higher time-frame (HTF) technical analysis as of: 2026-07-31: 07:16 CT.
US Indices Futures
- ES: YSFG/WSFG up, MSFG down; above rising 20–200-day benchmarks; 7693.50 resistance, 7290.50 pivot-next support; weekly consolidation.
- NQ: YSFG/WSFG up, MSFG down; above rising long-term benchmarks; 29938.00 pivot threshold, 31090.00 resistance, 27201.50 swing support.
- YM: YSFG/MSFG/WSFG up; benchmarks broadly rising beneath price; 53658 resistance, 51152 pivot-next support; short-term pullback within higher-high structure.
- EMD: YSFG up, MSFG/WSFG down; above rising 10–200-week benchmarks; 3892.4 resistance, 3680.0 pivot-next support; corrective short-term structure.
- RTY: YSFG/WSFG up, MSFG below F0%; rising benchmark stack; 3068.4 resistance, 2906.5 benchmark and 2843.8 pivot-next support.
- FDAX: YSFG/MSFG/WSFG up; above all rising benchmarks; 26084 resistance, 24352 opposite-pivot support; higher-low recovery tests prior high.
Overall State
- Short-Term: Bullish
- Intermediate-Term: Bullish
- Long-Term: Bullish
Conclusion
Higher-timeframe structure is broadly aligned upward, led by YM, RTY, and FDAX, with NQ maintaining an established weekly uptrend. ES and EMD show monthly-grid countertrend phases and nearby pivot resistance. Most contracts remain above rising long-term benchmarks and YSFG reference areas; principal overhead swing references are ES 7693.50, NQ 31090.00, YM 53658, EMD 3892.4, RTY 3068.4, and FDAX 26084.
Note: Intra-day counter-trend pullbacks or retracements may occur, HTF is context for informational usage and market structure. Glossary: Session Fib Grids periods of YSFG:’Yearly’, MSFG:’Monthly’, WSFG:’Weekly’
For full details visit: AlphaWebTrader Technicals
ES Daily View
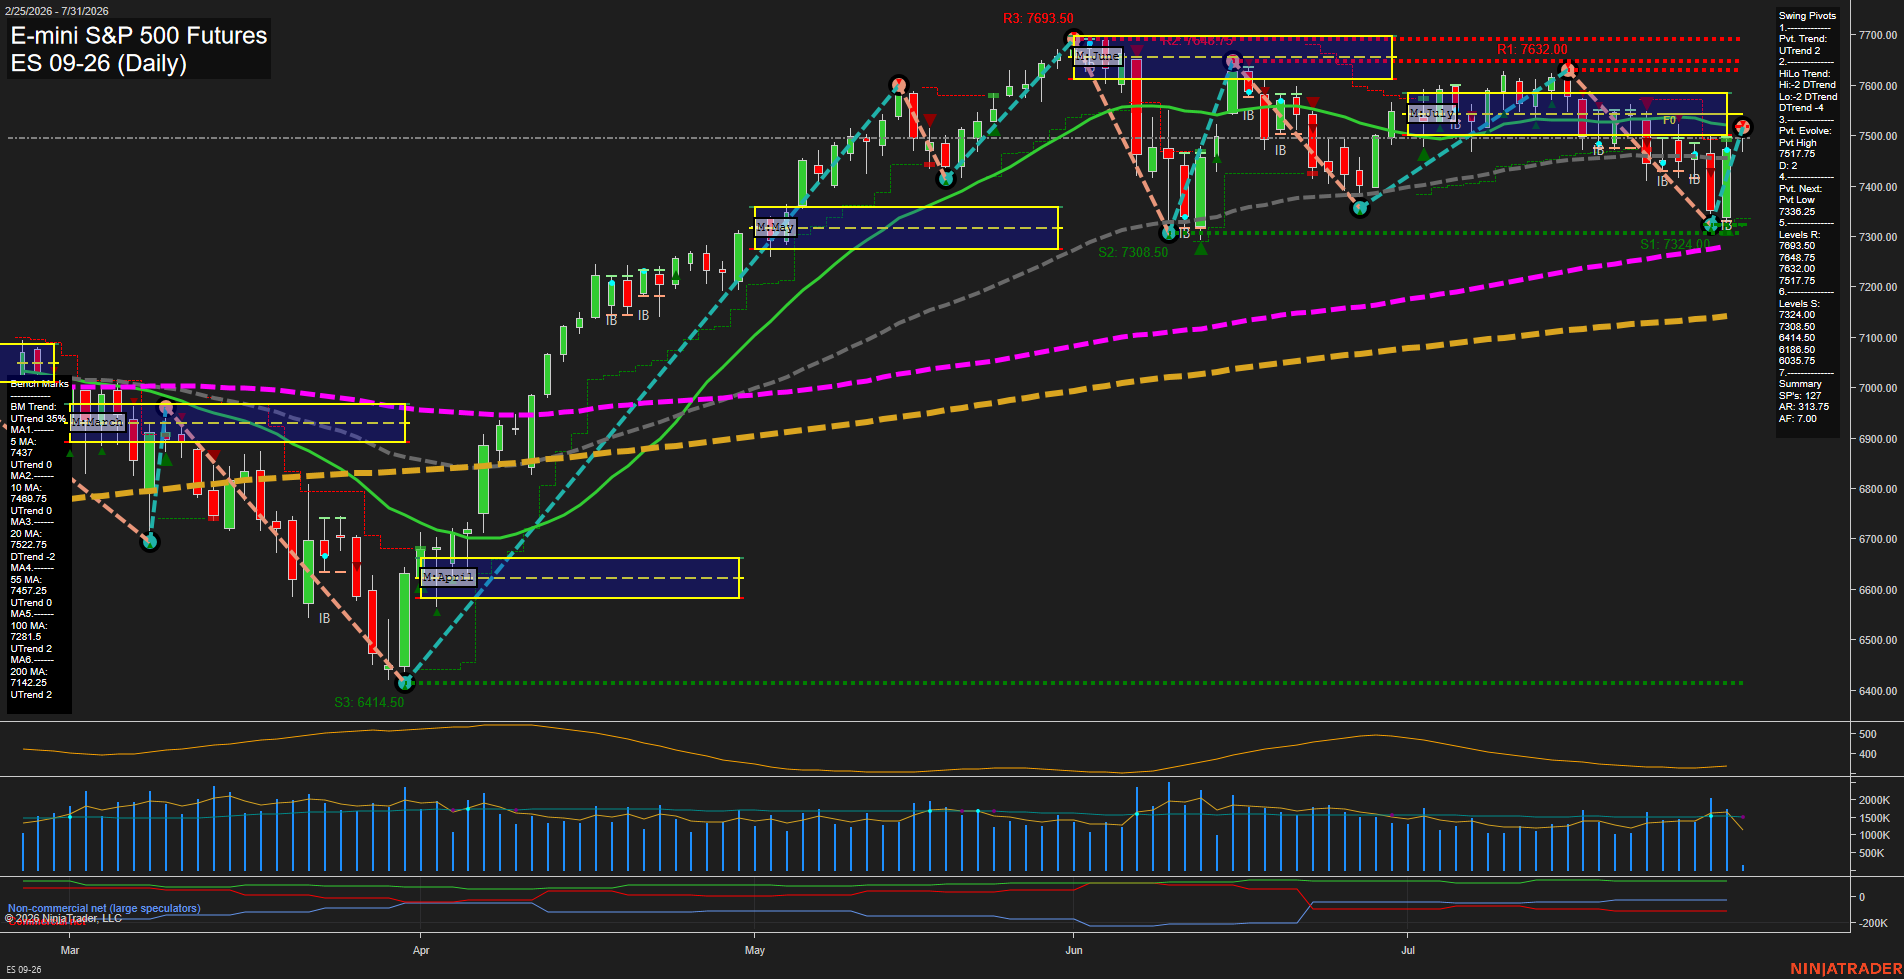
Overall Rating
- Short-Term: Bullish
- Intermediate-Term: Bearish
- Long-Term: Bullish.
Key Insights Summary
The daily structure shows a sharp V-style rebound from the 7324.50 support area, restoring the short-term UTrend and returning price above the 5-day, 10-day, and 55-day benchmarks. The rally is testing the 7517.75 pivot-high area and remains beneath the declining 20-day average at 7522.75, leaving the intermediate structure in a countertrend recovery within a DTrend. The broader yearly trend remains constructive, supported by price well above rising 100-day and 200-day averages. Near-term action is fast and volatile, with overhead pivot resistance concentrated from 7517.75 through 7564.50 and support clustered at 7324.50 to 7308.50.
View charts on: AlphaWebTrader HTF Charts
NQ Daily View
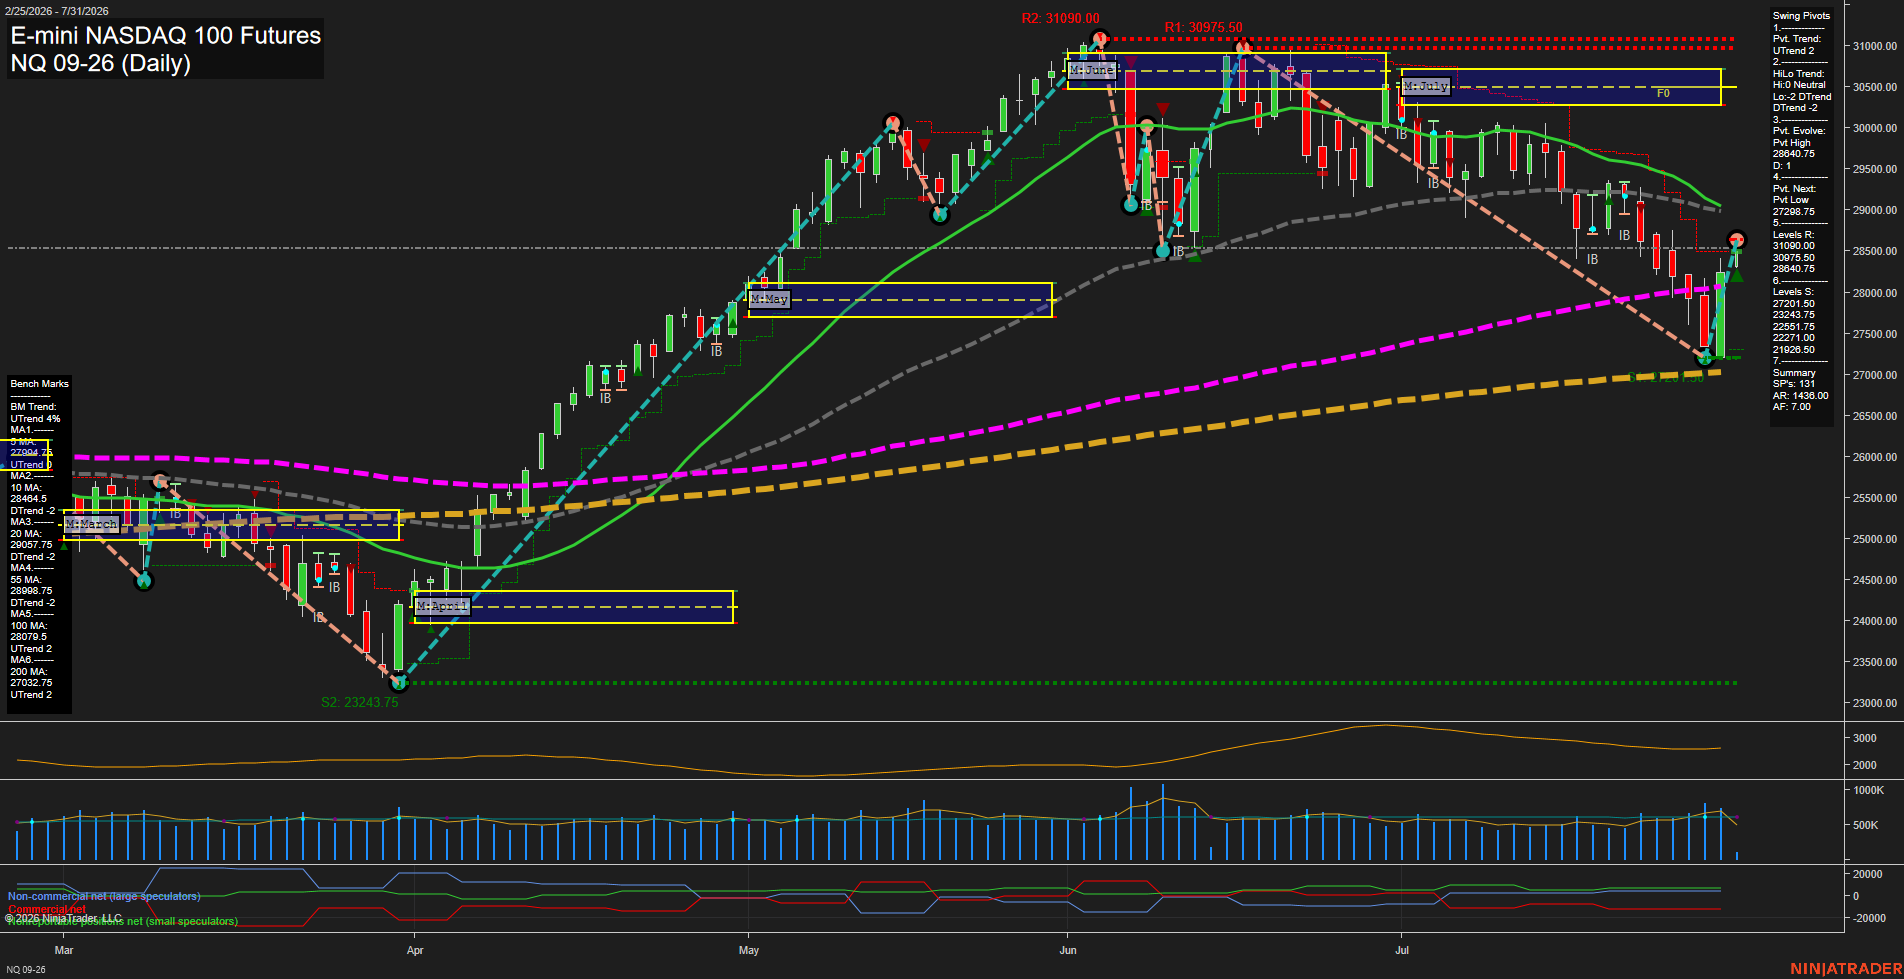
Overall Rating
- Short-Term: Bullish
- Intermediate-Term: Bearish
- Long-Term: Bullish.
Key Insights Summary
NQ produced a large, fast upside reversal from the 27201.50 swing-support area and has restored the short-term pivot structure to UTrend. Price is above the weekly F0% level and the rising 5-day benchmark, but remains beneath declining 20-day and 55-day benchmarks near 28958-28999, defining an intermediate-term countertrend bounce within a monthly Down trend. The 28640.75 pivot high is the immediate price reference, while 27298.75 is the next pivot-reversal level. Longer-term structure remains constructive, with price above rising 100-day and 200-day benchmarks and the yearly grid holding above F0%.
View charts on: AlphaWebTrader HTF Charts
CL Daily View
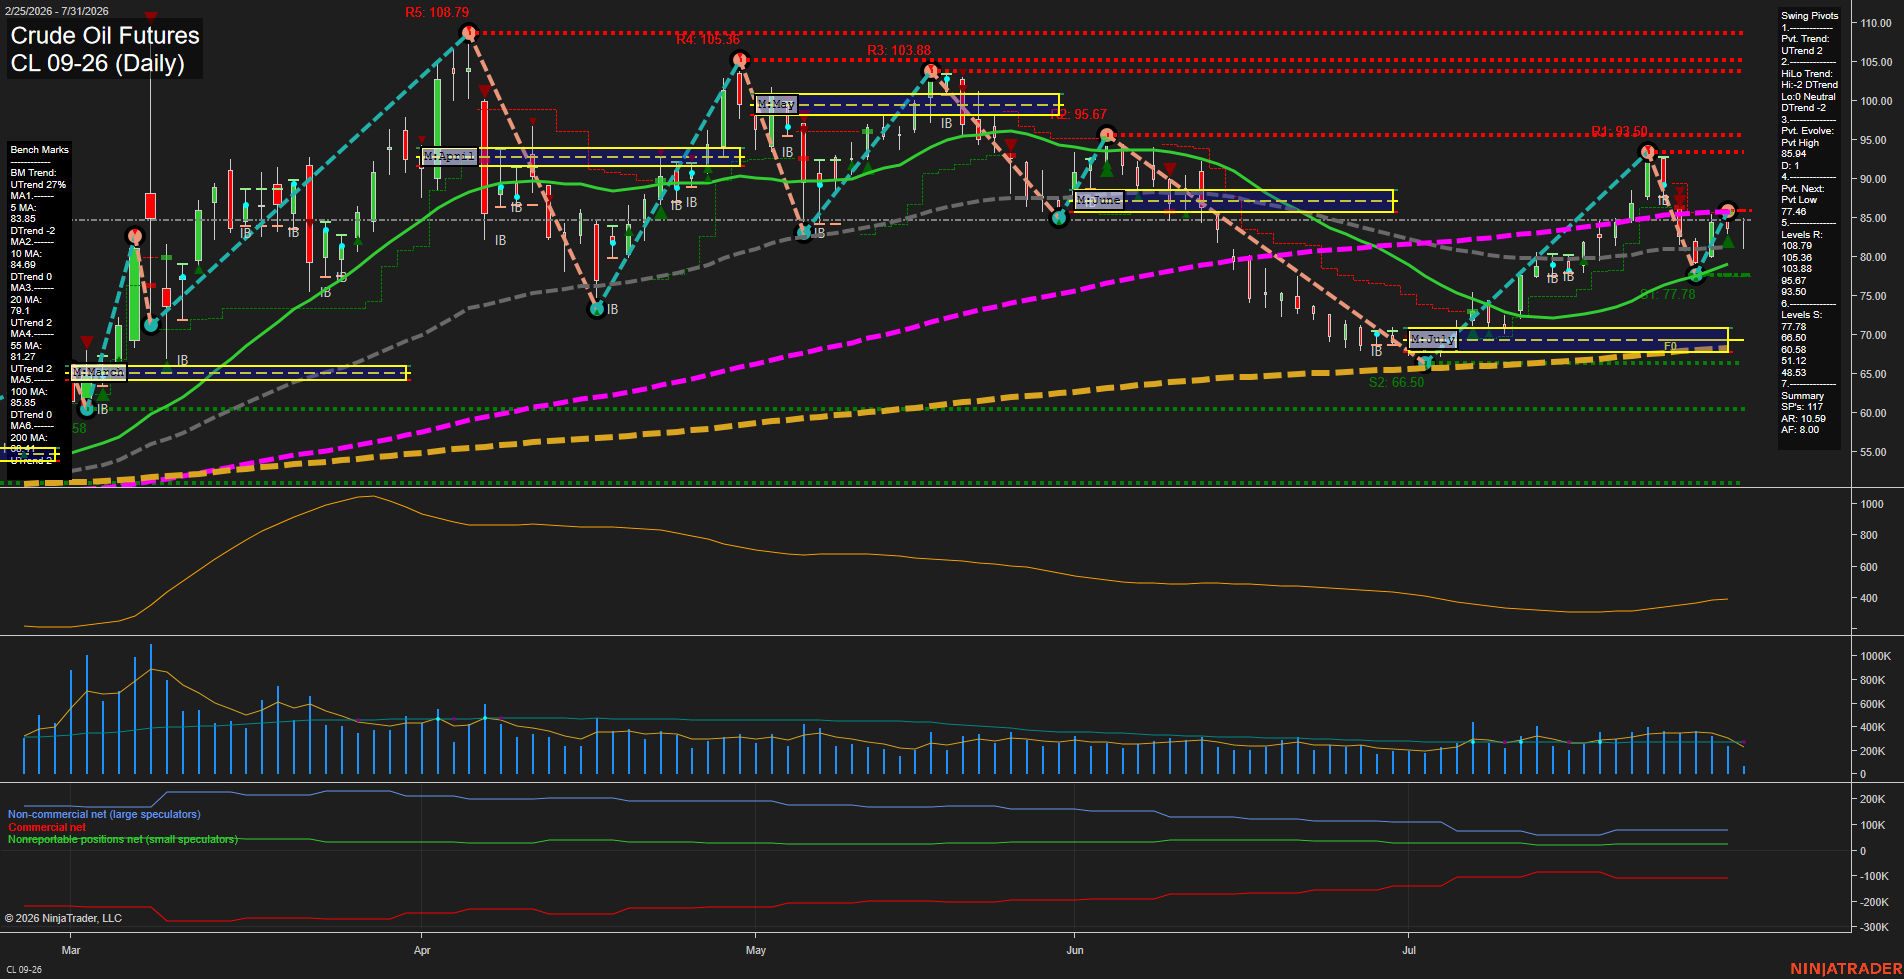
Overall Rating
- Short-Term: Bearish
- Intermediate-Term: Bullish
- Long-Term: Neutral.
Key Insights Summary
CL has rebounded sharply from the July 77.78 swing-low area and remains above the rising 20-day and 55-day benchmarks, preserving an intermediate bullish recovery structure. Short-term conditions are mixed-to-soft: price remains below the weekly F0%/NTZ reference, the 5-day and 10-day benchmarks are down, and the active pivot evolution is a pivot high near 85.46. The 85.85 to 87.00 benchmark and grid area is the immediate overhead test zone, followed by pivot resistance at 93.50. The broader yearly structure remains positive above the 200-day average, while the declining 100-day average near 85.85 and the long-term short signal reflect unresolved overhead supply and a still-neutral longer-term transition.
View charts on: AlphaWebTrader HTF Charts
GC Daily View
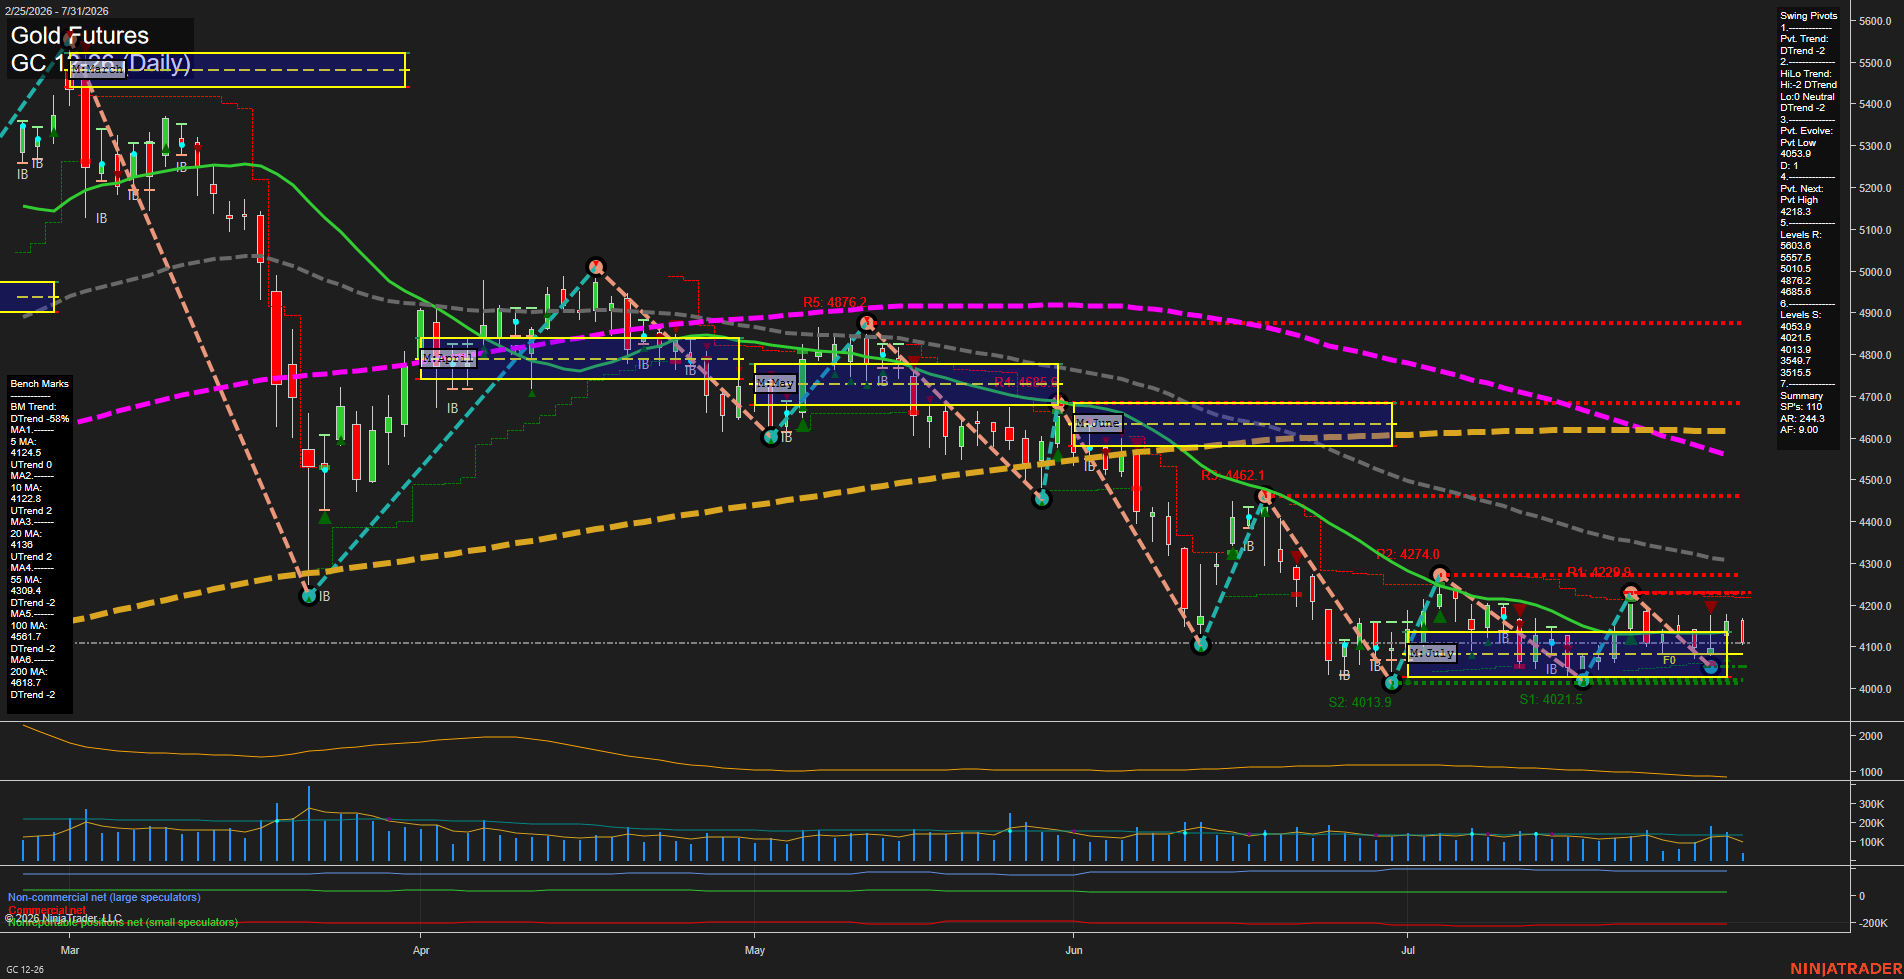
Overall Rating
- Short-Term: Bearish
- Intermediate-Term: Bearish
- Long-Term: Bearish.
Key Insights Summary
Gold is consolidating in a tight, low-momentum range near 4112 after a broader decline, with price below the 5-day, 10-day, and 20-day benchmarks despite their short upward slope. The weekly grid remains below F0% and the pivot structure is DTrend across both short- and intermediate-term measures, defining the recent bounce as a countertrend recovery within a larger bearish sequence of lower highs. The 4038.9 pivot low and clustered 4053.9 to 4013.9 supports frame the active base, while 4218.3 is the next pivot-reversal threshold and nearby resistance. Longer-term pressure remains dominant because price is materially below the declining 55-day, 100-day, and 200-day averages; elevated ATR also reflects a volatile contract despite the recent narrow daily bars.
View charts on: AlphaWebTrader HTF Charts