S&P 500, Nasdaq, Dow, Russell and DAX futures technical levels, ETF movers and market drivers including jobs data, yields, Iran and OPEC+ supply.
Fundamentals: Markets enter the new month with strong Big Tech earnings supporting attention on the S&P 500 and Nasdaq-100, while rising Treasury yields and the Iran conflict add pressure. The July employment report is the immediate macro focus after the Fed held rates in July. Oil markets also face a new supply variable following OPEC+'s planned September production increase.
Technicals: U.S. index futures enter Sunday with broadly constructive long-term trends, while short-term conditions vary across major contracts. ES is testing resistance after a sharp recovery, Nasdaq remains volatile within a mixed intermediate structure, and Dow futures have rebounded toward overhead levels. Russell, E-mini S&P MidCap and DAX analysis highlights key pivot areas, benchmarks and active support zones.
Market Week Ahead – Trading 360° view Market Radar for: holidays, earnings, eco-news, market-news summary, news sentiment, and major ETFs, MAG7, Higher Time Frame Analysis Indices Futures Summary, and ETF SPY S&P500, QQQ Tech, USO Oil, GLD Gold Weekly Chart analysis
As of: August 2, 2026 06:15 CT
Earnings Radar
Monitoring for earnings releases by the Magnificent 7, AI-tech-related firms, and major financial institutions.
- MCHP Release: 2026-08-06 T:AMC
- AMD Release: 2026-08-04 T:AMC
Conclusion: AMD reports after the close on Aug. 4, placing AI, semiconductor, and broader technology sentiment in focus; MCHP follows after the close on Aug. 6, extending semiconductor-sector event risk. Market momentum and volume can slow ahead of these major semiconductor earnings releases.
For full details visit: Yahoo Earnings Calendar
EcoNews Radar U.S. Events
| Day | Time | Impact | Event |
|---|---|---|---|
| Mon | 10:00 | High | ISM Manufacturing PMI |
| Mon | 10:00 | Medium | ISM Manufacturing Prices |
| Tue | 10:00 | Medium | JOLTS Job Openings |
| Wed | 08:15 | Medium | ADP Non-Farm Employment Change |
| Wed | 10:00 | Medium | ISM Services PMI |
| Wed | 10:30 | Low | Crude Oil Inventories |
| Thu | 08:30 | Medium | Unemployment Claims |
| Fri | 08:30 | High | Average Hourly Earnings m/m |
| Fri | 08:30 | High | Non-Farm Employment Change |
| Fri | 08:30 | High | Unemployment Rate |
EcoNews Summary
High-impact U.S. manufacturing and labor data headline the week. Monday’s ISM Manufacturing PMI provides an early reading on factory-sector activity. Friday’s 08:30 employment release cluster, led by Non-Farm Employment Change, carries the week’s strongest broad market significance through labor-market conditions, wage growth, and unemployment.
Event Notes:
- Monday 10:00 ISM Manufacturing PMI: A survey-based index of U.S. factory activity, including production, orders, employment, and supplier deliveries. Traders monitor it for evidence of manufacturing-sector expansion or contraction and its implications for growth conditions.
- Friday 08:30 Average Hourly Earnings m/m: Measures the monthly change in average employee pay. Traders monitor wage growth as an input to labor-cost and inflation conditions.
- Friday 08:30 Non-Farm Employment Change: Measures the monthly change in U.S. payroll employment outside farm work. Traders monitor it as a primary gauge of labor-market strength and economic activity.
- Friday 08:30 Unemployment Rate: Measures the percentage of the labor force actively seeking work but without employment. Traders monitor it for changes in labor-market slack and employment conditions.
Conclusion:
The single most important event is Friday at 08:30, Non-Farm Employment Change, alongside Average Hourly Earnings and the Unemployment Rate. Market momentum and volume often slow ahead of Friday’s major employment release, with increased volatility at release time. Monday’s 10:00 ISM Manufacturing PMI is the other major scheduled catalyst, and the 10:00 time cycle often acts as a catalyst for reversals or continuations.
For full details visit: Forex Factory EcoNews
Market News Summary:
Index futures enter the new month with strong Big Tech earnings offset by oil-war uncertainty, rising Treasury yields, and focus on the July jobs report.
Primary Drivers & Risks:
- Primary Driver: Big Tech profit growth
- Primary Risk: Rising yields and Iran conflict
Tone:
Mixed, with earnings strength facing macro and geopolitical pressure.
Stock Market / ETFs / Indices:
Amazon’s reported earnings growth, including paper gains tied to Anthropic investments, added to strong Big Tech profit momentum. S&P 500 and Nasdaq-100 coverage emphasized concentration in large technology companies, while dividend screens pointed to valuation discounts in selected U.S. equities. Futures activity begins amid attention to the July employment report.
Geopolitical:
The Iran war remains a key market uncertainty and has driven substantial short-term earnings gains for Exxon Mobil, Chevron, and Valero. The conflict also supported crude-price-volatility and refining ETFs over the past six months.
Oil / Energy:
OPEC+ approved an approximately 188,000-barrel-per-day September production increase, completing the rollback of voluntary output cuts. The group’s sixth consecutive output increase adds supply-side focus as the oil market remains shaped by the Iran conflict.
Gold / Metals:
Gold pulled back from record highs, while central-bank buying and broader investor demand remained supportive themes. Rising Treasury yields erased gold’s prior post-Fed move above $4,100, leaving payroll data and elevated rate-hike risk in focus.
Fed / Financials:
The Fed held rates in July, with three FOMC members dissenting in favor of a hike. Long-dated Treasury yields have risen amid less forward guidance, higher uncertainty, and a rising term premium; balance-sheet tightening remains a central focus in discussion of Fed policy.
Macro / Other:
A proposed $20 billion modernization of Washington Dulles International Airport highlights infrastructure spending and passenger-fee funding questions.
Conclusion:
Big Tech earnings growth and the start of a new month are supporting equity-market attention. The July jobs report is the immediate macro focal point.
Higher long-term Treasury yields, Fed tightening concerns, and the Iran war remain major cross-currents. OPEC+ supply increases add another variable for oil and energy-linked assets.
Market News Sentiment
Market News Articles: 10
- Neutral: 60.00%
- Positive: 40.00%
Sentiment Summary: Market news sentiment is 60% neutral and 40% positive across 10 articles.
Conclusion: The news flow is predominantly neutral, with a meaningful positive component and no negative articles reported.
GLD,Gold Articles: 2
- Neutral: 100.00%
Sentiment Summary: GLD and gold coverage was 100% neutral across 2 articles.
Conclusion: The snapshot shows no directional sentiment signal from the available gold-related articles.
USO,Oil Articles: 3
- Positive: 33.33%
- Neutral: 33.33%
- Negative: 33.33%
Sentiment Summary: USO/Oil coverage is evenly split, with 33% positive, 33% neutral, and 33% negative articles.
Conclusion: Oil-related news presents a balanced sentiment backdrop for indices futures day traders.
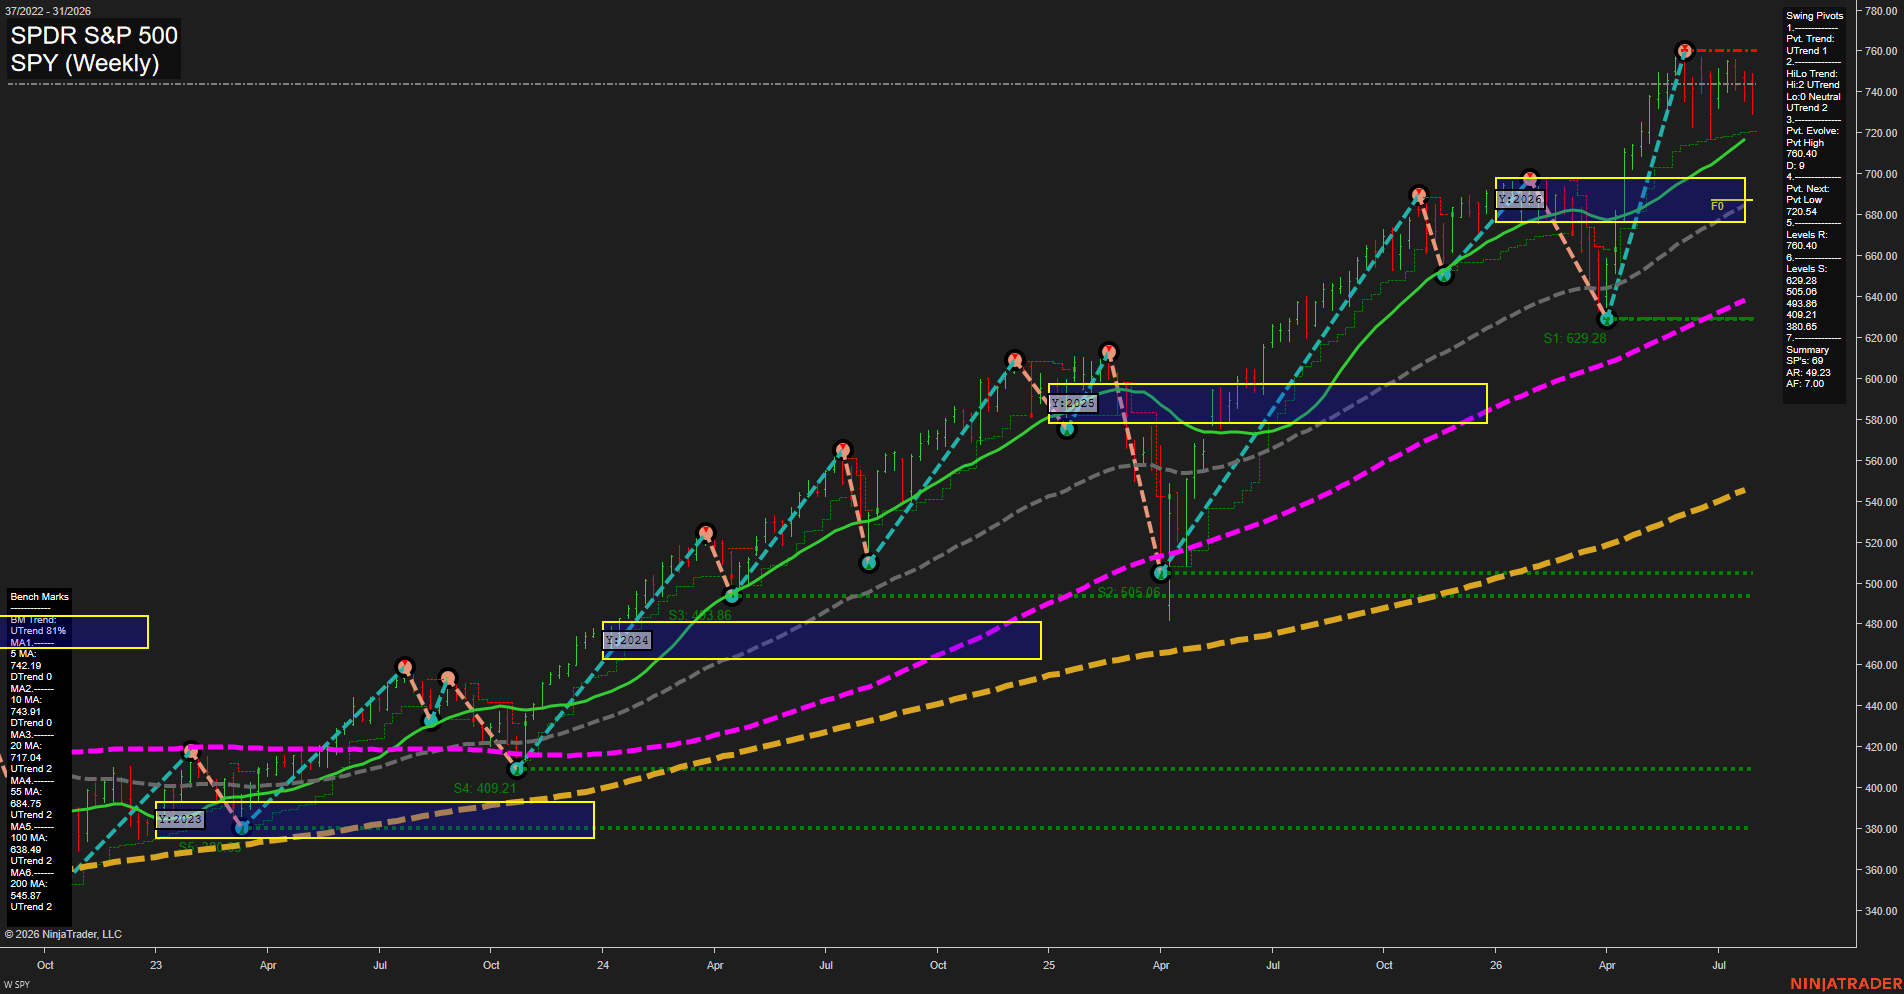
SPY Weekly View
Overall Rating
- Short-Term: Neutral
- Intermediate-Term: Bullish
- Long-Term: Bullish.
Key Insights Summary
The futures swing structure remains broadly constructive: price is holding well above rising 20-, 55-, 100-, and 200-period benchmarks, while both the pivot and HiLo trends remain in UTrend. Near-term action is consolidating beneath the 760.40 pivot-high resistance after a strong advance, with the declining 5- and 10-period benchmarks reflecting a slower short-term momentum phase. The 720.54 pivot-next level defines the nearby structural retracement reference, while the August and 2026 fib-grid positioning remains above the neutral zones and supports the intermediate- and long-term bullish trend sequence.
View charts on: AlphaWebTrader HTF Charts
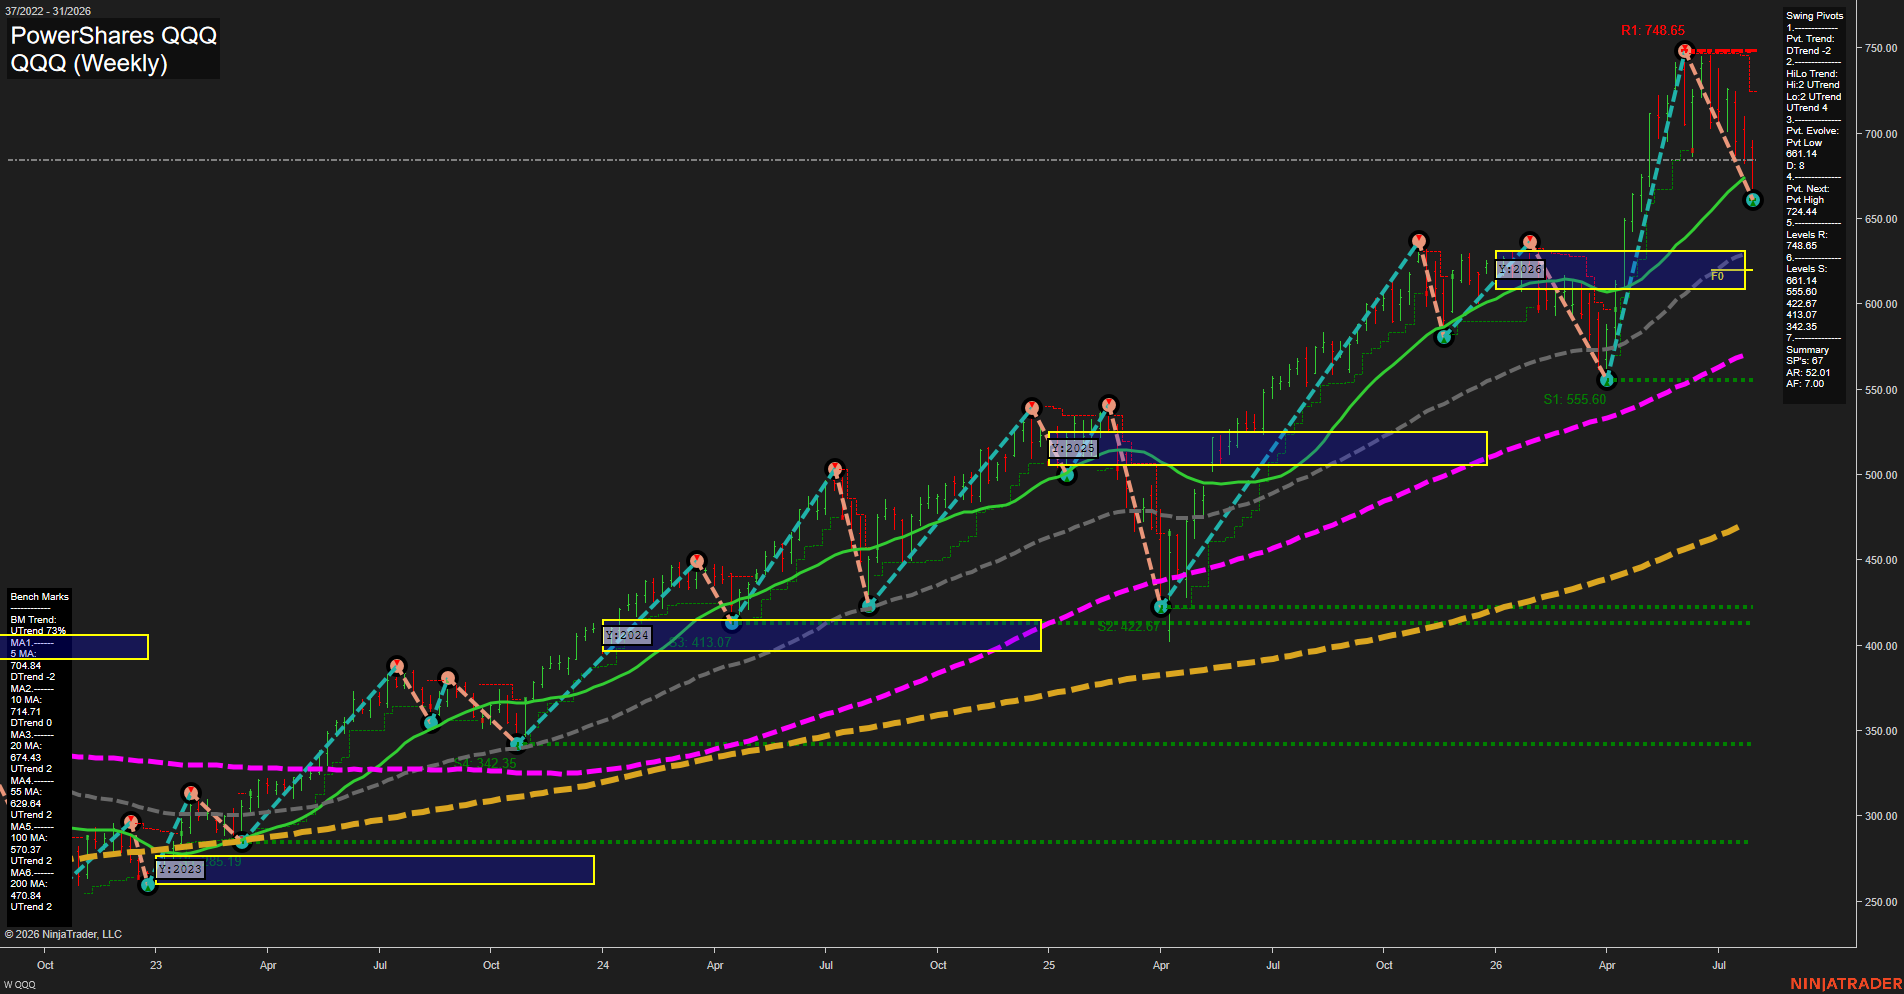
QQQ Weekly View
Overall Rating
- Short-Term: Bearish
- Intermediate-Term: Bullish
- Long-Term: Bullish.
Key Insights Summary
QQ futures-equivalent price action reflects a sharp weekly counter-trend liquidation from the 748.65 pivot high, producing large bars and fast downside momentum. The short-term pivot structure is bearish while price remains beneath the 5, 10, and 20-week benchmarks; 661.14 is the immediate swing-low reference. The intermediate and major trend structures remain constructive because the 55, 100, and 200-week benchmarks are rising, with the 2026 yearly grid still holding a bullish position above its NTZ. The current pattern is a retracement within a broader advancing cycle, with 724.44 defining the pivot-reversal threshold overhead and 555.60 the next major downside structural level.
View charts on: AlphaWebTrader HTF Charts
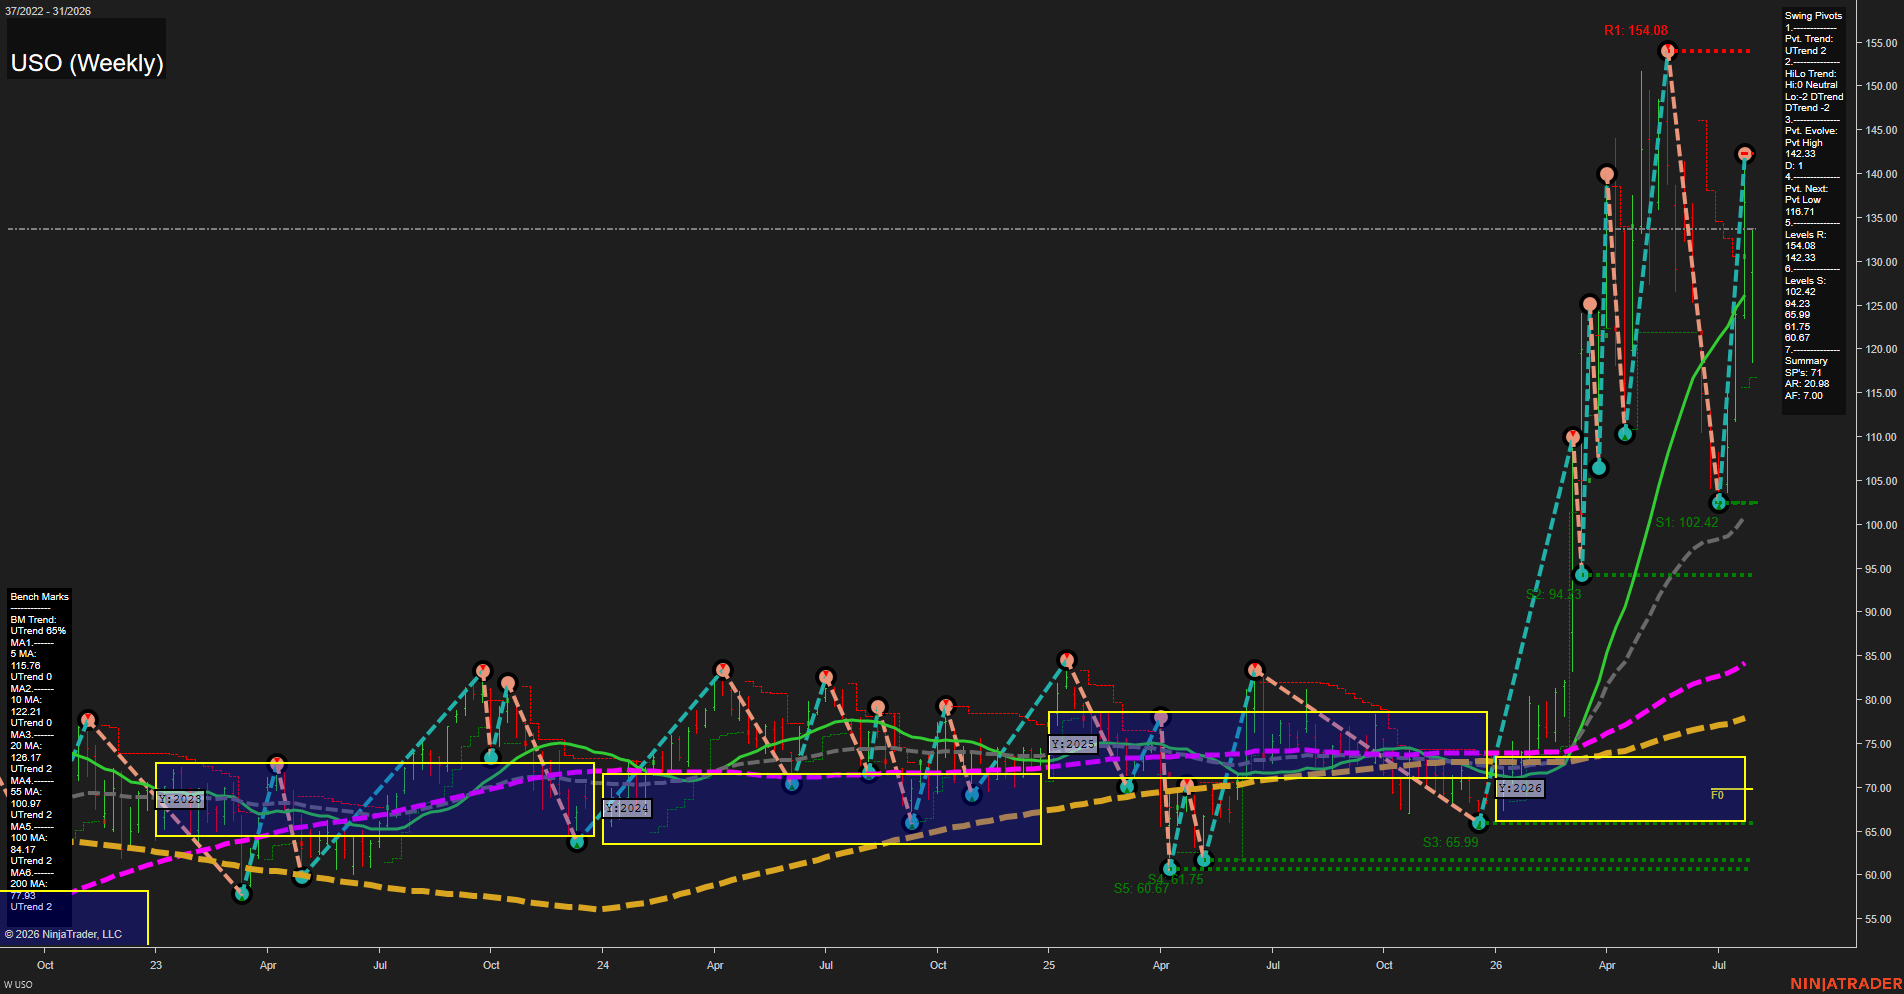
USO Weekly View
Overall Rating
- Short-Term: Bullish
- Intermediate-Term: Bullish
- Long-Term: Bullish.
Key Insights Summary
USO reflects a high-volatility energy advance, with price at 132.83 holding above every weekly benchmark and materially above the 2026 yearly NTZ. The short-term pivot structure remains upward, although the intermediate HiLo sequence remains DTrend after the sharp retracement from 154.08 to 102.42. The recovery has formed a strong V-shaped continuation and is approaching the 142.33 evolving pivot-high resistance; 154.08 remains the larger swing-cycle ceiling. The wide separation above the 20-, 55-, 100-, and 200-week benchmarks confirms unusually strong upside momentum and an extended long-term trend condition.
View charts on: AlphaWebTrader HTF Charts
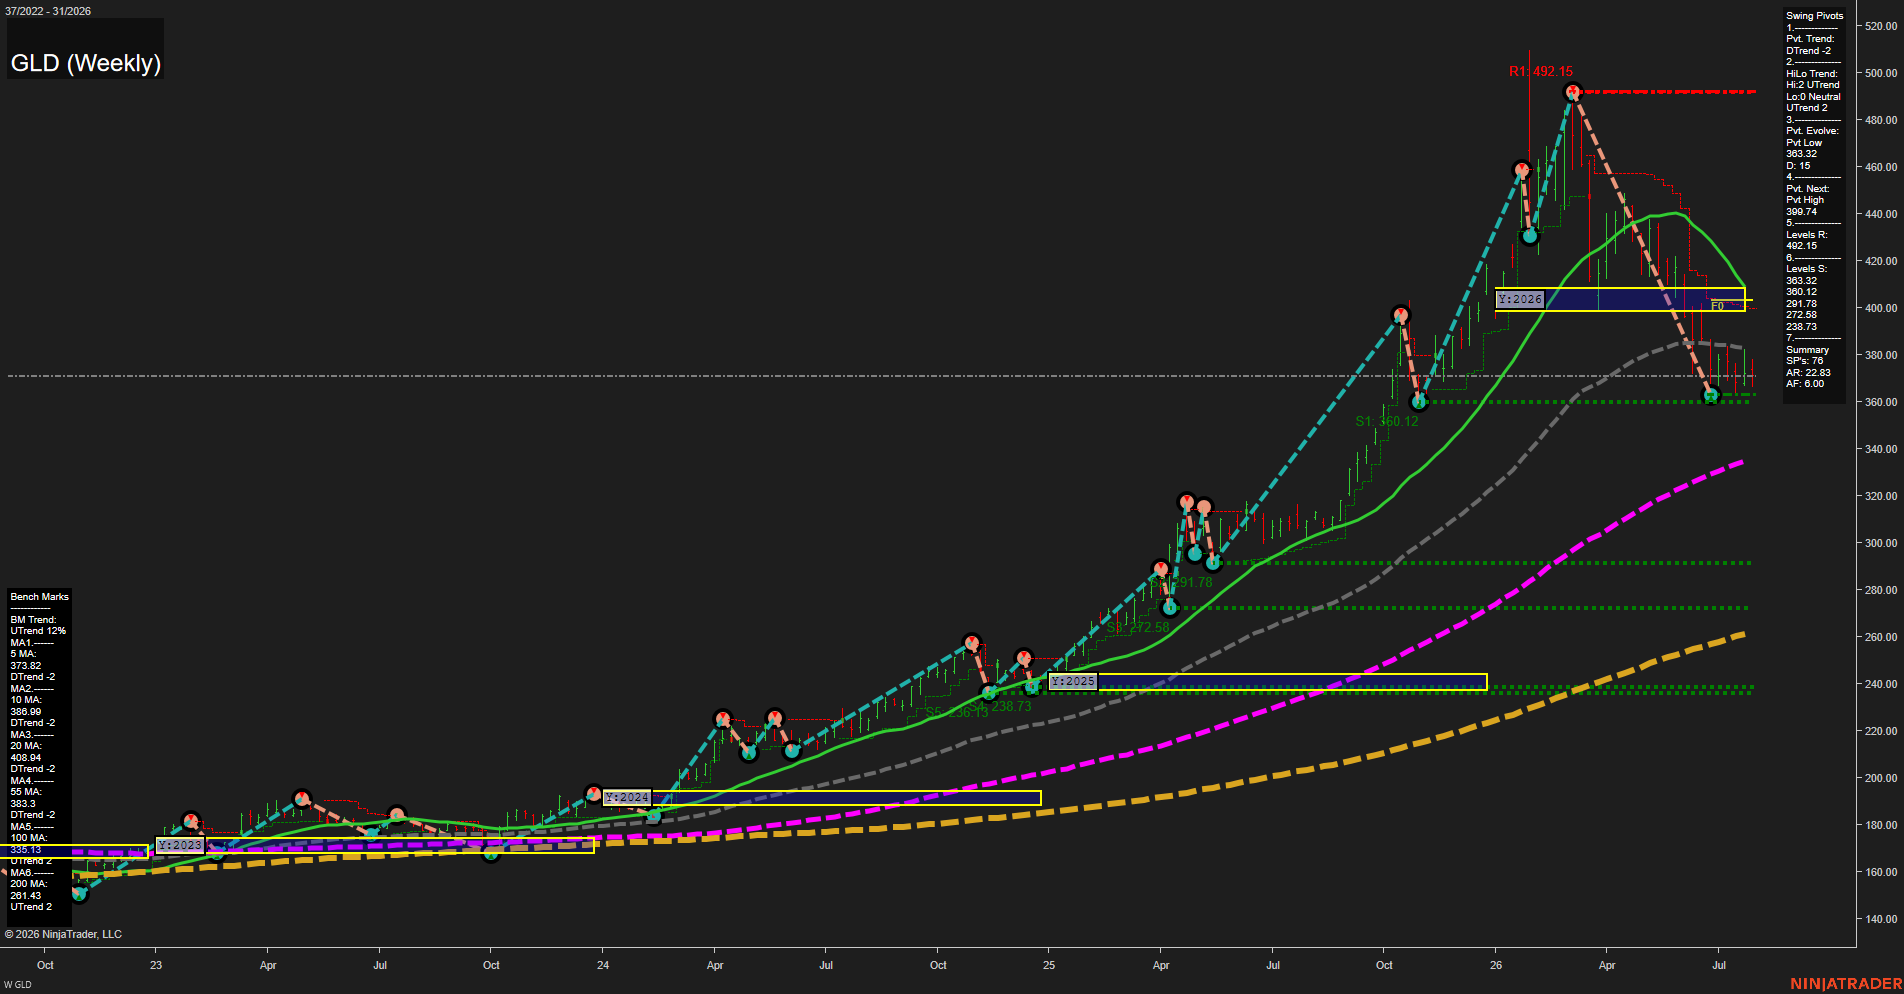
GLD Weekly View
Overall Rating
- Short-Term: Bearish
- Intermediate-Term: Bearish
- Long-Term: Bullish.
Key Insights Summary
GLD’s weekly structure reflects a futures-style countertrend decline within a still-positive major gold trend. Price is holding just above the 360.12 pivot support after a steep retreat from the 492.15 swing high, while the active pivot trend and the 5-, 10-, 20-, and 55-period benchmarks remain down. The intermediate structure is mixed because the broader HiLo sequence remains upward, but the current decline has produced lower highs and price remains below the yearly F0%/NTZ area near 400. A weekly recovery through the 373.32 to 399.74 zone would characterize a bounce into the damaged short-term structure; continued acceptance below that area keeps the focus on the 360.12 support shelf. The 100- and 200-period averages remain rising well beneath price, preserving the long-term bullish gold-cycle backdrop despite current weekly volatility.
View charts on: AlphaWebTrader HTF Charts