NYSE pre-market radar tracks ETF movers, futures technical conditions, oil, Treasury yields, yen intervention and mixed global equity markets.
Fundamentals: Markets entered the NYSE pre-market session with oil lower after U.S.-Iran de-escalation hopes reduced the immediate geopolitical premium. Elevated Treasury yields remained a central concern, while coordinated U.S.-Japan yen intervention and rising Bank of Japan tightening expectations added currency-market focus. Equities were mixed, with lower fuel costs supporting travel shares and Japanese stocks declining.
Technicals: Major ETFs showed mixed prior-session performance, led by gains in Amazon, Alphabet and Meta, while Apple, bitcoin-linked IBIT and gold ETF GLD declined. Futures technical readings remain broadly constructive for ES, YM and FDAX, while NQ faces an intermediate correction. RTY and EMD are consolidating within wider bullish structures near defined pivot support and resistance.
Pre-Market Trading 360° view Market Radar of: holidays, earnings, eco-news, market-news summary, news sentiment, prior session major ETFs, MAG7, Higher Time Frame Analysis Indices Futures Summary, and E-mini S&P500, Nasdaq 100, NYMEX Crude, Gold Futures Daily Chart analysis.
As of: August 3, 2026 07:16 CT
Earnings Radar
Monitoring for earnings releases by the Magnificent 7, AI-tech-related firms, and major financial institutions.
- MCHP Release: 2026-08-06 T:AMC
- AMD Release: 2026-08-04 T:AMC
Conclusion: AMD reports after the Aug. 4 close, placing a major semiconductor and AI-linked earnings catalyst early in the week; Microchip Technology follows after the Aug. 6 close. These releases concentrate index-futures sensitivity around chip-sector results, guidance, and post-close reactions; market momentum and volume can slow ahead of major AI and semiconductor earnings releases.
For full details visit: Yahoo Earnings Calendar
EcoNews Radar U.S. Events
| Day | Time | Impact | Event |
|---|---|---|---|
| Mon | 10:00 | High | ISM Manufacturing PMI |
| Mon | 10:00 | Medium | ISM Manufacturing Prices |
| Tue | 10:00 | Medium | JOLTS Job Openings |
| Wed | 08:15 | Medium | ADP Non-Farm Employment Change |
| Wed | 10:00 | Medium | ISM Services PMI |
| Wed | 10:30 | Low | Crude Oil Inventories |
| Thu | 08:30 | Medium | Unemployment Claims |
| Fri | 08:30 | High | Average Hourly Earnings m/m |
| Fri | 08:30 | High | Non-Farm Employment Change |
| Fri | 08:30 | High | Unemployment Rate |
EcoNews Summary
The week features two high-impact U.S. data windows: Monday’s ISM Manufacturing PMI at 10:00 and Friday’s 08:30 employment report cluster. These releases provide key readings on manufacturing activity, labor conditions, wage growth, and unemployment, with broad implications for index-futures volatility and market direction.
Event Notes:
- Monday 10:00 – ISM Manufacturing PMI: A survey-based measure of U.S. manufacturing activity. Readings above or below the expansion threshold shape views on industrial demand, business activity, and economic momentum. The 10 AM time cycle often serves as a catalyst for market reversals or continuations.
- Friday 08:30 – Average Hourly Earnings m/m: Measures the monthly change in worker pay. Traders monitor wage growth as an indicator of labor-cost pressure and inflation conditions.
- Friday 08:30 – Non-Farm Employment Change: Measures the monthly change in U.S. payroll employment outside agriculture. It is a primary gauge of labor-market strength and economic activity.
- Friday 08:30 – Unemployment Rate: Measures the share of the labor force actively seeking work but not employed. It provides context on labor-market slack and household income conditions.
Conclusion:
The single most important event is Friday’s 08:30 Non-Farm Employment Change, alongside Average Hourly Earnings and the Unemployment Rate. Market momentum and volume often slow ahead of this major employment release, with increased volatility at release time. Monday’s ISM Manufacturing PMI is the other major scheduled catalyst, particularly around the 10 AM release window.
For full details visit: Forex Factory EcoNews
Market News Summary:
Iran diplomacy drove a sharp oil retreat, while higher yields, currency intervention, and uneven equity performance kept broader market conditions mixed.
Primary Drivers & Risks:
- Primary Driver: U.S.-Iran de-escalation hopes
- Primary Risk: Rising yields and policy uncertainty
Tone:
Mixed, with lower energy costs offset by rate and geopolitical cross-currents.
Stock Market / ETFs / Indices:
Japan’s Nikkei fell 1.4%, led by electronics and auto shares, following prior gains and continued Iran-conflict uncertainty. Big Tech earnings produced sharply divergent valuation moves, while the bond selloff added pressure. Lower crude supported travel-related shares, including IAG, Wizz Air, and IHG; seasonal commentary highlighted August and September volatility following S&P 500 declines in June and July.
Geopolitical:
President Trump called off a planned attack on Iran and said talks would begin Monday, lifting hopes of reduced conflict and reopened shipping through the Strait of Hormuz. Middle East supply disruptions nevertheless remained active, with Iraqi crude offered at steep discounts for loading inside Hormuz.
Oil / Energy:
Crude prices fell sharply, with one report citing an 8% futures decline and others describing a drop to a three-week low, as Iran deal hopes reduced the immediate geopolitical premium. WTI and Brent later stabilized as traders continued to monitor Middle East supply risks. Lower oil improved sentiment toward fuel-sensitive travel companies, while U.S. shale producers faced strong profits from the earlier war-driven price rally.
Gold / Metals:
Gold rose on a technical rebound, while gold and silver traded cautiously ahead of U.S. labor-market data. Dollar direction and Treasury yields remained central influences on metals alongside easing inflation concerns from lower oil prices.
Fed / Financials:
The 30-year Treasury yield touched 5.24%, its highest level since 2007, amid persistent inflation concerns and discussion of further Fed tightening despite the latest Fed hold. Higher real yields and fiscal concerns intensified scrutiny of Fed credibility. Short-dated Japanese government bonds declined as Bank of Japan rate-increase expectations increased.
Macro / Other:
The United States and Japan confirmed coordinated yen-buying intervention, the first such action in 15 years, after the yen weakened sharply against the dollar. Japanese authorities signaled readiness for further coordinated action, while the yen subsequently eased in a technical correction.
Conclusion:
Iran talks and the cancelled planned attack drove oil sharply lower, reducing immediate energy-price pressure. Treasury yields remained elevated, sustaining a major financial-market focus.
Equities showed uneven regional and sector performance, with lower fuel costs aiding travel shares while Japanese stocks retreated. Yen intervention, BOJ tightening expectations, Middle East shipping conditions, and upcoming U.S. labor data added cross-currents.
Market News Sentiment
Market News Articles: 20
- Neutral: 45.00%
- Negative: 30.00%
- Positive: 25.00%
Sentiment Summary: Market news sentiment is mixed-to-neutral, with 45% neutral, 30% negative, and 25% positive coverage across 20 articles.
Conclusion: Neutral coverage is the largest category, while negative articles outnumber positive articles by 5 percentage points.
GLD,Gold Articles: 5
- Neutral: 60.00%
- Positive: 20.00%
- Negative: 20.00%
Sentiment Summary: GLD and gold coverage is predominantly neutral at 60%, with positive and negative sentiment each at 20%.
Conclusion: Gold-related news tone is balanced overall, with neutral coverage prevailing.
USO,Oil Articles: 9
- Positive: 44.44%
- Negative: 33.33%
- Neutral: 22.22%
Sentiment Summary: USO/Oil coverage is mixed, with 44% positive, 33% negative, and 22% neutral articles across nine reports.
Conclusion: Oil-related news tone is modestly positive overall, while negative coverage remains substantial for indices futures day traders.
Market Data Snapshot
ETF Snapshot of major stock market ETFs, Mag7, and others as of: August 3, 2026 07:16
Top Movers & Losers
- AMZN 271.58 Bullish 15.32% ▲
- GOOG 356.65 Bullish 6.88% ▲
- META 556.71 Bullish 3.28% ▲
- GLD 371.54 Bearish -1.49% ▼
- IBIT 35.64 Bearish -2.89% ▼
- AAPL 308.91 Bearish -7.35% ▼
Major Index ETFs: SPY, QQQ, DIA, IWM, IJH
- SPY 747.03 Bullish 0.72% ▲
- QQQ 687.99 Bullish 0.65% ▲
- DIA 524.32 Bullish 0.54% ▲
- IJH 75.27 Bearish -0.11% ▼
- IWM 291.20 Bearish -0.48% ▼
Mixed index ETF snapshot: SPY is the most bullish mover at +0.72%, followed by QQQ at +0.65% and DIA at +0.54%. IWM is the most bearish mover at -0.48%, while IJH is marginally bearish at -0.11%.
Mag 7 Stocks: AAPL, MSFT, GOOG, AMZN, META, NVDA, TSLA
- AMZN 271.58 Bullish 15.32% ▲
- GOOG 356.65 Bullish 6.88% ▲
- META 556.71 Bullish 3.28% ▲
- MSFT 464.72 Bullish 3.02% ▲
- NVDA 200.75 Bullish 2.93% ▲
- TSLA 311.21 Bullish 0.76% ▲
- AAPL 308.91 Bearish -7.35% ▼
Mixed Mag7 snapshot: AMZN is the most bullish mover at +15.32%, followed by GOOG at +6.88%. META, MSFT, NVDA, and TSLA remain Bullish at +3.28%, +3.02%, +2.93%, and +0.76%. AAPL is the most bearish mover at -7.35%.
Cross-Market ETFs: TLT, GLD, USO, IBIT
- USO 129.17 Bullish 1.33% ▲
- TLT 82.25 Bearish -0.66% ▼
- GLD 371.54 Bearish -1.49% ▼
- IBIT 35.64 Bearish -2.89% ▼
Other ETFs are Mixed: USO is the most bullish mover at +1.33%, while IBIT is the most bearish mover at -2.89%. GLD is Bearish at -1.49% and TLT is Bearish at -0.66%.
ETF, Mag7, and Cross-Market ETF Insights
Overall Tone
Mixed: large-cap equity strength was led by select Mag7 names, while small caps, bonds, gold, and bitcoin were Bearish.
Equity ETFs and Mag7:
Major Index ETFs were Mixed: SPY led at +0.72%, followed by QQQ at +0.65% and DIA at +0.54%, while IJH was marginal at -0.11% and IWM was the most bearish index ETF at -0.48%. Mag7 performance was selective, with AMZN the most bullish mover at +15.32%, followed by GOOG at +6.88%; META, MSFT, NVDA, and TSLA were also Bullish. AAPL was the most bearish mover across the snapshot at -7.35%, contrasting with the broader large-cap ETF gains.
Cross-Market ETFs:
Cross-Market ETFs were Mixed, with USO the most bullish mover at +1.33%, diverging from Bearish TLT at -0.66%, GLD at -1.49%, and IBIT at -2.89%. IBIT was the most bearish cross-market ETF, while USO provided the sole Bullish commodity-related move.
Futures Indices – Higher Time Frame Analysis
Summary of the current state of US Indices Futures based on higher time-frame (HTF) technical analysis as of: 2026-08-03: 07:16 CT.
US Indices Futures
- ES YSFG/MSFG/WSFG above F0%, benchmarks rising, UTrend; 7693.50 resistance, 7303.50 pivot support; monthly short signal accompanies consolidation.
- NQ YSFG above F0%, MSFG/WSFG below F0%; short-term corrective, 27231.50 support, 29938.00 pivot threshold, 31090.00 higher resistance.
- YM YSFG/MSFG/WSFG above F0%, all benchmarks rising; higher-high structure, 53656 resistance, 51218 and 51630 pivot supports.
- EMD YSFG/MSFG above F0%; weekly consolidation below 3892.4, daily bearish pullback; 3833.7 resistance, 3733.7 pivot, 3667.8 support.
- RTY YSFG/MSFG/WSFG above F0%; weekly UTrend, daily DTrend consolidation; 3068.4 resistance, 2902.3 support, 2852.8 reversal threshold.
- FDAX YSFG/MSFG/WSFG above F0%, all benchmarks rising; UTrend, 26117 resistance, 25391 pivot support, 24487 opposing swing threshold.
Overall State
- Short-Term: Bullish
- Intermediate-Term: Bullish
- Long-Term: Bullish
Conclusion
ES, YM, and FDAX retain aligned bullish YSFG, MSFG, WSFG, benchmark, and pivot structures near prior highs. RTY and EMD are consolidating within broader advances. NQ remains the principal divergence, with a short-term corrective weekly structure and intermediate daily weakness despite bullish yearly structure. Resistance is concentrated at ES 7693.50, YM 53656, RTY 3068.4, FDAX 26117, and EMD 3892.4; listed pivot supports define current retracement structure.
Note: Intra-day counter-trend pullbacks or retracements may occur, HTF is context for informational usage and market structure. Glossary: Session Fib Grids periods of YSFG:’Yearly’, MSFG:’Monthly’, WSFG:’Weekly’
For full details visit: AlphaWebTrader Technicals
ES Daily View
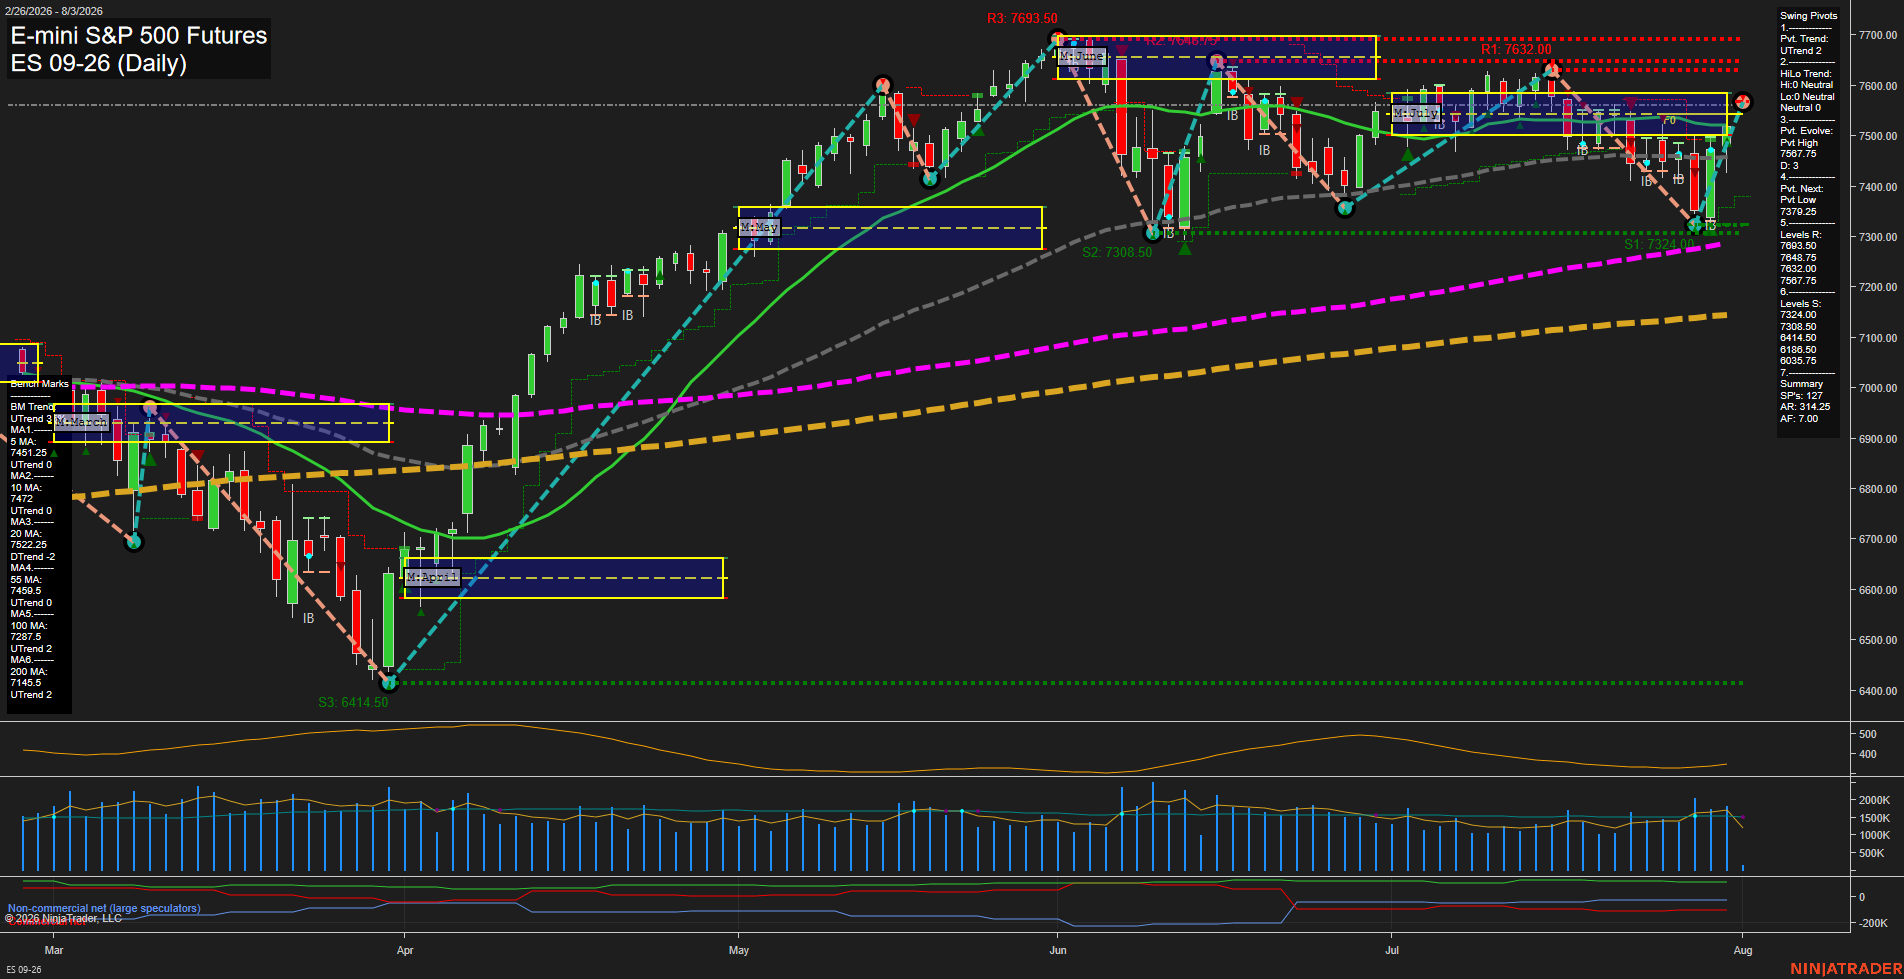
Overall Rating
- Short-Term: Bullish
- Intermediate-Term: Bullish
- Long-Term: Bullish.
Key Insights Summary
Price has staged a sharp V-style recovery from the late-July swing low and has reclaimed the 5, 10, 20, and 55-day benchmarks. The short-term pivot structure is up, weekly and monthly Fib-grid biases remain above F0%, and price is pressing beneath nearby 7587.75 resistance. Intermediate pivot structure remains neutral after the recent two-way rotation, but the rising benchmark alignment and price location above the monthly grid support the broader bullish trend. Resistance is layered at 7587.75, 7632.00, 7648.75, and 7693.50, while the 7348.50 to 7308.50 area defines the principal lower swing-support zone.
View charts on: AlphaWebTrader HTF Charts
NQ Daily View
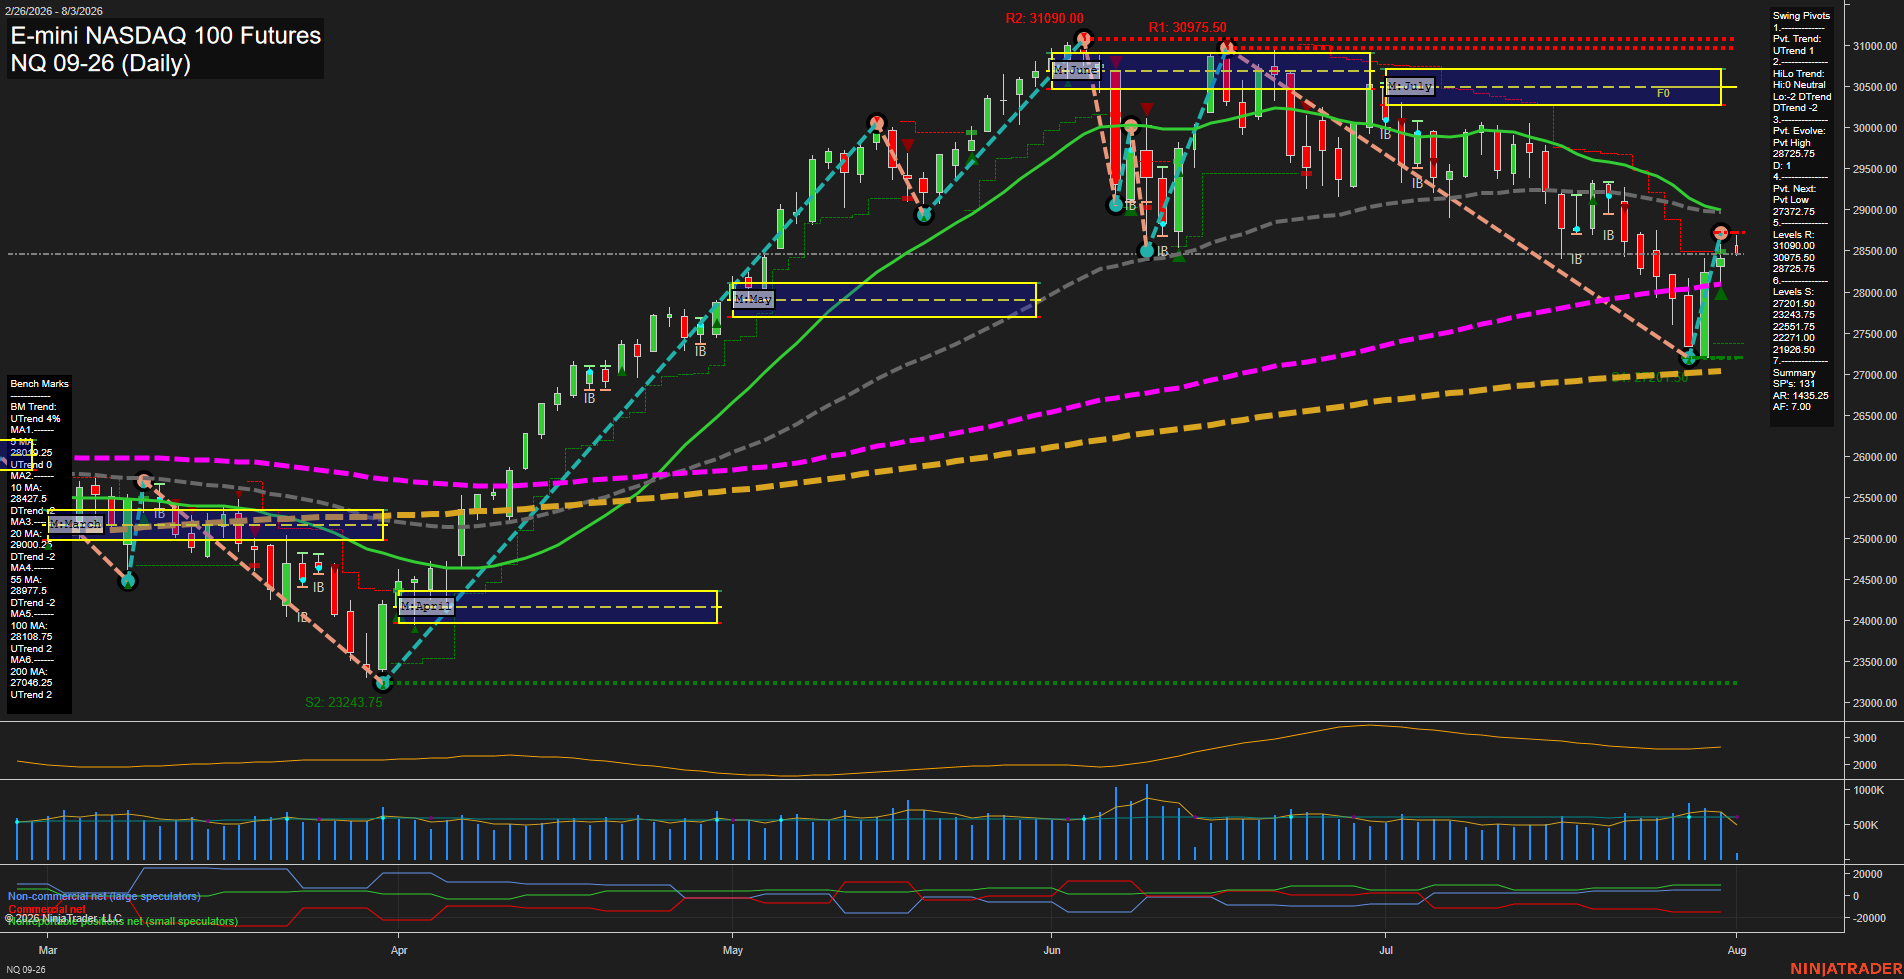
Overall Rating
- Short-Term: Bullish
- Intermediate-Term: Bearish
- Long-Term: Bullish.
Key Insights Summary
NQ is showing a fast, high-range rebound from the late-July 27201.50 pivot low, restoring the short-term pivot trend and placing price above the rising 5-day and 10-day benchmarks. The recovery remains an intermediate-term countertrend bounce because price is still below declining 20-day and 55-day averages and remains below the August monthly F0%/NTZ area. The 28725.75 pivot resistance is being tested, while 30975.50 to 31090.00 remains the higher resistance zone. The broader 100-day and 200-day uptrends, together with price above the annual grid, preserve the long-term bullish structure despite the active intermediate correction.
View charts on: AlphaWebTrader HTF Charts
CL Daily View
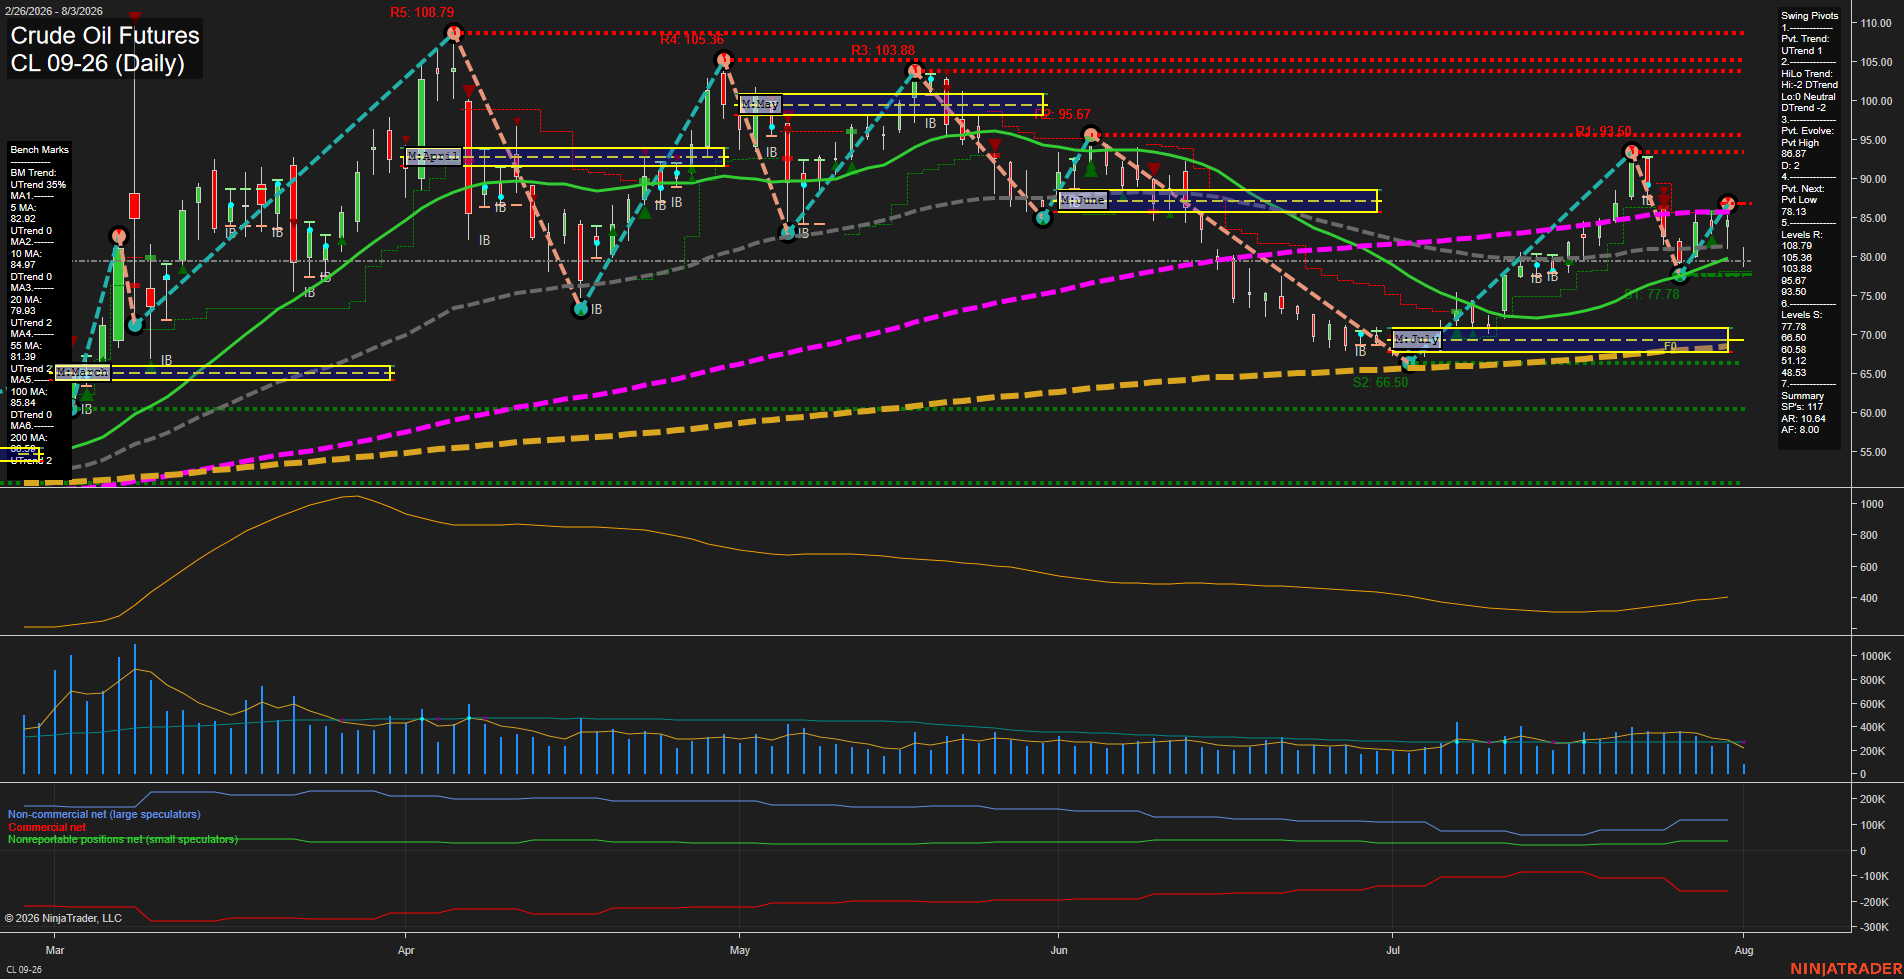
Overall Rating
- Short-Term: Bullish
- Intermediate-Term: Neutral
- Long-Term: Bullish.
Key Insights Summary
Price has staged a sharp V-shaped recovery from the July low near 66.50 and is holding above the rising 5, 20, 55, and 200-day benchmarks. Short-term pivot structure is upward, although the intermediate HiLo structure remains downward following the prior sequence of lower highs. The 85.84 to 86.87 area is a near-term congestion and pivot-high zone, while 93.50 and 95.67 remain the larger overhead resistance levels. The August monthly and weekly Fib grids remain below their F0% reference, indicating that the recovery is occurring within a broader intermediate-term retracement. Volume is moderate and ATR remains elevated, supporting continued wide daily swings.
View charts on: AlphaWebTrader HTF Charts
GC Daily View
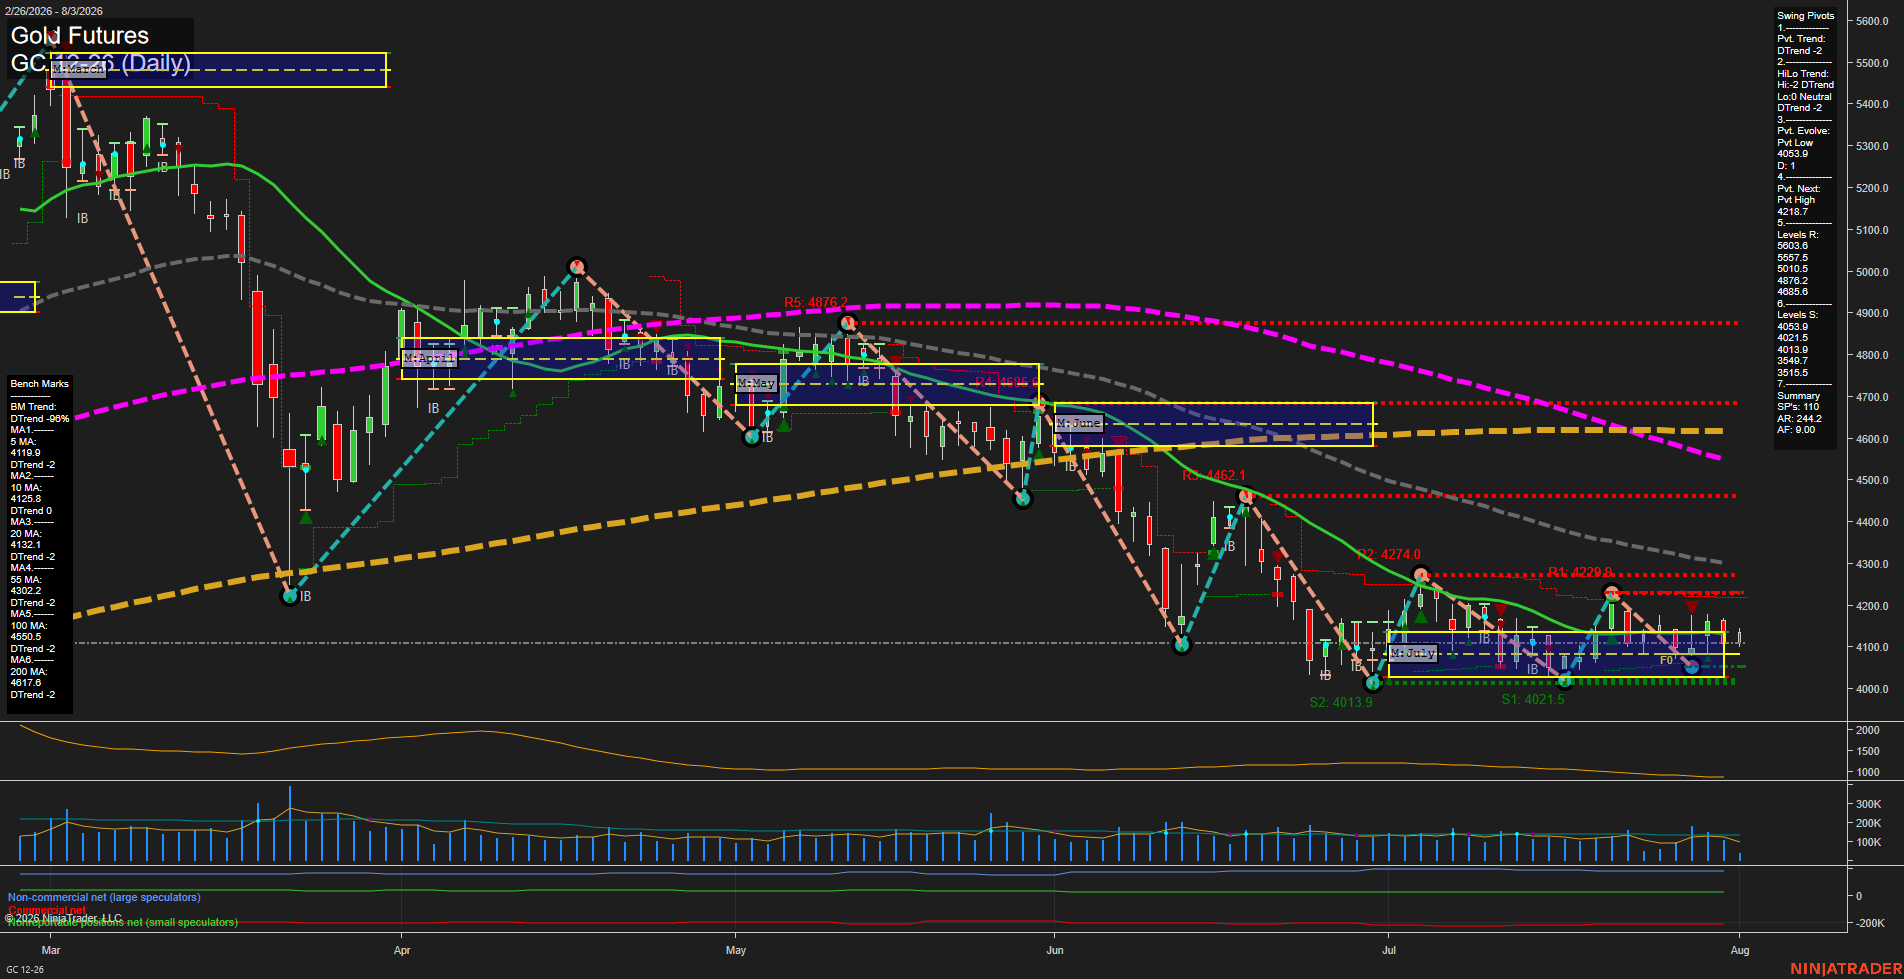
Overall Rating
- Short-Term: Bearish
- Intermediate-Term: Bearish
- Long-Term: Bearish.
Key Insights Summary
Price is consolidating near the July lows around the 4014 to 4054 support zone, but the broader structure remains bearish: pivots are lower, price is below the weekly and monthly F0% areas, and all six benchmark averages are declining. Small daily bars and slowing momentum show compression following the June-to-July selloff, while 4218.7 is the active pivot-reversal level defining the nearby countertrend ceiling. The 5-day through 200-day alignment remains negatively stacked, with the 4302, 4550, and 4618 benchmark areas marking substantial overhead trend resistance.
View charts on: AlphaWebTrader HTF Charts