AI’s Hidden Replacement Bill: Could Depreciation Trigger a 2001-Style Market Shakeout?
The first phase of the artificial-intelligence boom was about how much companies could invest. The next phase may be about how quickly that investment ages—and who can afford to replace it.
The market is intensely focused on AI demand, semiconductor performance, capital expenditure and model capability. Far less attention is being given to the cost that arrives after the equipment has been installed: depreciation, economic obsolescence, replacement capital, continuing research and development, and the financing obligations attached to the buildout.
This is not a distant accounting detail. It could become one of the principal forces separating the durable AI businesses from the companies that entered the industry during the rush for capital.
The central question is simple: will AI revenue and productivity rise quickly enough to pay for the current infrastructure before competition makes that infrastructure economically old?
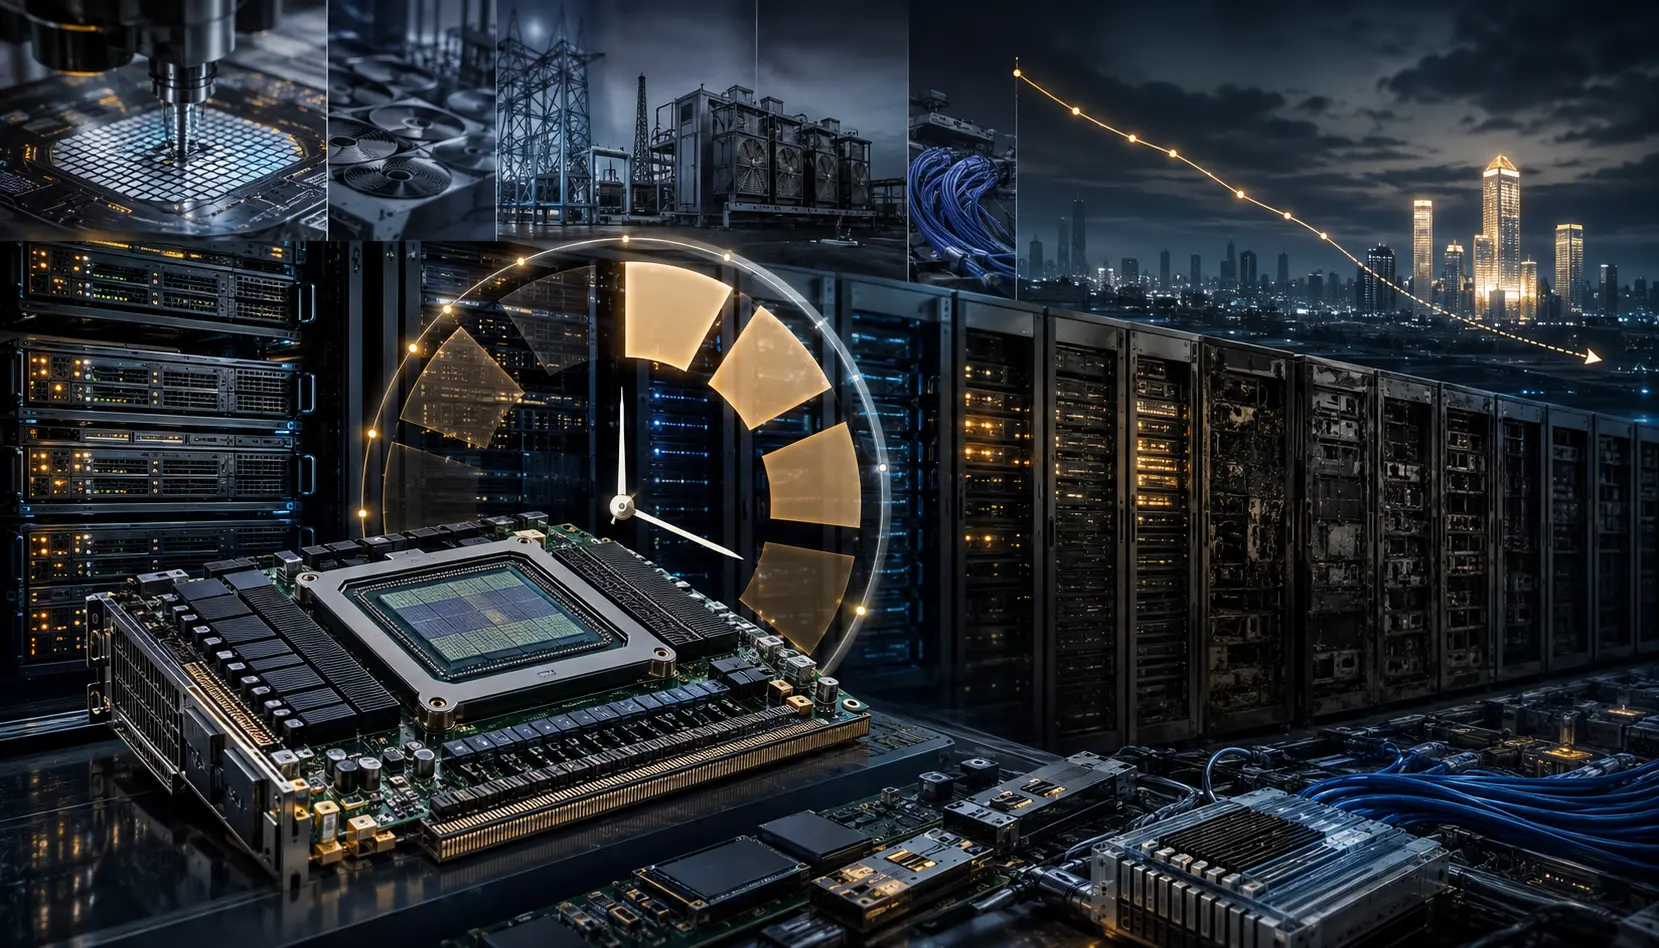
The Six-Year AI Replacement Clock
A six-year useful life implies annual straight-line depreciation equal to approximately 16.7% of the hardware’s original cost, assuming no residual value. If hardware represents 50% of the total AI investment, the annual depreciation charge attributable to that hardware is approximately 8.3% of the original total investment.
The calculation is:
Hardware share of total investment ÷ estimated useful life = annual depreciation as a percentage of total investment.
| Hardware Share | Useful Life | Annual Depreciation as % of Total Investment |
|---|---|---|
| 40% | 6 years | 6.7% |
| 50% | 6 years | 8.3% |
| 50% | 5 years | 10.0% |
| 50% | 4 years | 12.5% |
| 50% | 3 years | 16.7% |
This is a sensitivity model, not a forecast for every company. AI investment also includes buildings, power systems, cooling, networking, software and labor, each with different accounting treatment and useful lives. However, the model demonstrates how rapidly the burden changes if the economically competitive life of the hardware is shorter than the accounting estimate.
The six-year assumption is not detached from current company reporting. Alphabet says it generally depreciates servers and network equipment over six years. Meta extended most server and network-asset lives to 5.5 years. Amazon reports a range of five to six years—but shortened the life of a subset of equipment from six years to five because of the faster pace of AI and machine-learning development.
That Amazon revision increased 2025 depreciation and amortization expense by $1.4 billion and reduced net income by $1.0 billion. It is a practical example of the risk: a relatively small change in estimated life can move reported earnings by a material amount.
Accounting Life Is Not the Same as Competitive Life
A server can continue operating after it has stopped being the best economic tool for frontier AI. New accelerators may deliver more output per unit of electricity, memory, rack space or cooling capacity. A technically functioning asset can therefore become commercially inferior before it physically fails.
This creates two separate clocks:
- Accounting life: the period over which the recorded cost is charged against earnings.
- Economic life: the period during which the asset can produce a competitive return after power, maintenance and opportunity costs.
If economic life becomes shorter than accounting life, a company may have to accelerate depreciation, record an impairment, retire equipment early or operate an increasingly inefficient fleet. None of these outcomes is attractive when new capital is also required for the next generation.
Recent filings already show the size of the moving expense base. Meta reported $13.36 billion of server and network-asset depreciation in 2025. Alphabet reported that research and development expense rose by $7.9 billion year over year in the first half of 2026, including a $1.1 billion increase in depreciation. Microsoft’s 2026 annual report describes AI infrastructure investment as occurring at significant scale and on an accelerated timeline.
An Important Correction: AI R&D Is Usually Not Amortized Like Hardware
The phrase “amortization of AI R&D” captures a valid economic concern, but it is not normally the most accurate financial-reporting description.
Physical AI infrastructure is generally depreciated. Acquired intangible assets and qualifying capitalized software may be amortized. However, a large proportion of internally generated research, model development, engineering compensation and software maintenance is recognized as an expense when incurred.
Amazon, for example, states that its technology and infrastructure costs are generally expensed as incurred and that capitalized software-development costs were not significant for the periods presented.
This does not make the R&D burden smaller. It can make the competitive cycle more demanding. A company may be depreciating yesterday’s hardware while immediately expensing today’s engineers and simultaneously committing cash to tomorrow’s infrastructure. The economic value of research may fade quickly even when there is no separate accounting asset to amortize.
Depreciation Versus Financing Obligations
Depreciation and debt service are related to the same investment cycle, but they affect the accounts differently.
| Cost | Income Statement Effect | Immediate Cash Effect | Why It Matters |
|---|---|---|---|
| Depreciation | Reduces operating profit over the asset’s useful life | No new cash payment when the expense is recorded | Reveals the portion of past capital investment consumed during the period |
| Interest | Reduces profit as financing cost | Normally requires cash payment | Continues even if the financed AI capacity is underused |
| Debt Principal | Normally not an expense | Requires cash at repayment or refinancing | Creates maturity and refinancing risk |
| New R&D | Frequently expensed as incurred | Consumes current cash | Cannot be paused easily when competitors continue advancing |
| Replacement Capital Expenditure | Capitalized first and expensed later through depreciation | Consumes cash when equipment is purchased | Must be funded before the old asset has necessarily earned an adequate return |
Depreciation is therefore non-cash in the current period, but it is not economically imaginary. The original cash has already been spent, and a sustainable business must eventually earn enough to replace productive assets. A company financed with debt faces an additional problem: the lender must still be paid even if the equipment becomes obsolete sooner than expected.
The financing dimension is growing. The OECD’s 2026 Global Debt Report estimates that nine major AI players could issue approximately $1.2 trillion of corporate bonds between 2026 and 2030 to fund capital expenditure. Strong cash generation can support that borrowing, but the figure shows that the AI cycle is no longer funded only by retained earnings and equity-market optimism.
The Labor Paradox: AI May Need to Replace Work to Pay for AI
AI providers must absorb infrastructure depreciation, power and cooling costs, continuing model development and the price pressure created by aggressive competition. To protect margins, they can raise prices, improve utilization, use smaller models, extend equipment life, reduce energy consumption or increase scale.
Labor is not the only available lever, but it is one of the largest flexible operating costs. This creates an uncomfortable feedback loop: companies may use AI to reduce human labor costs partly to finance the continuing cost of developing and replacing AI itself.
The incentive extends beyond AI providers. Corporate customers will seek to justify AI subscriptions and integration costs through higher output per employee, fewer repetitive roles and smaller administrative, support, analysis or software teams.
That can improve productivity and margins for the winning companies. It can also shift part of the cost into the wider economy. Displaced professional workers may carry mortgages, consumer debt and other fixed obligations. If high-income employment weakens materially, the consequences can spread through consumption, residential property, office demand and credit quality.
Could This Become the Telecom Crash of 2001?
The comparison is credible, but it should not be applied mechanically.
The telecom boom was built around a real technological revolution. Demand for internet and communications capacity did grow. The failure was that investment, leverage and network construction ran far ahead of near-term monetization. A Federal Reserve Bank of Richmond study described soaring telecom valuations and capital spending followed by collapsing investment and a flood of bankruptcy filings. The technology survived; many owners of the capital did not.
| 2001 Telecom Cycle | Potential AI Parallel |
|---|---|
| Fiber and network capacity built ahead of demand | Compute, power and data-center capacity built ahead of proven AI revenue |
| Rapid technological improvement reduced the value of older systems | New accelerators and models can reduce the economic value of existing fleets |
| Falling service prices weakened returns on heavy fixed investment | Declining inference and model prices may benefit users while pressuring providers |
| Debt remained after expected demand failed to arrive on schedule | Interest, leases and purchase commitments can outlast an AI product’s competitive advantage |
| Bankruptcies transferred useful infrastructure to stronger owners | Distressed AI assets, teams and customers may be acquired by well-financed platforms |
There are also important differences. Today’s largest AI investors generally have profitable businesses, substantial operating cash flow, global distribution and the ability to use computing infrastructure across cloud, advertising, search, productivity software and consumer services. AI capacity is also more modular than a fixed long-distance fiber route and may be redirected toward inference, internal workloads or lower-tier services.
The most plausible parallel is therefore not a uniform collapse of every large AI company. It is a selective shakeout among firms with weak monetization, narrow product differentiation, expensive external financing or infrastructure commitments that are too large for their cash flow.
Five Scenarios for the Next Phase of the AI Market
1. Quality Concentration
The market thins toward companies with strong treasuries, durable operating cash flow, proprietary distribution, efficient infrastructure and the ability to spread AI costs across several revenue streams. Smaller providers merge, license larger models or become acquisition targets. The result is an oligopolistic market with fewer credible frontier competitors.
2. The Picks-and-Shovels Winners—Followed by a Volume Test
Leading suppliers of accelerators, semiconductor manufacturing equipment, advanced packaging, high-bandwidth memory, optical networking, power and cooling can continue selling higher-performance products at premium prices. Some previously unremarkable specialist companies may become essential infrastructure names.
However, “picks and shovels” are not automatically protected forever. After consolidation, there may be fewer buyers and a slower replacement cycle. Product quality and average selling prices may rise while total unit volume falls. Suppliers with high fixed costs or excessive capacity could then experience their own order correction.
3. A Compute Glut and AI Service Price War
If too much capacity is installed before paying demand matures, providers may cut prices to improve utilization. Lower AI prices would accelerate adoption and productivity, but they could also compress margins and lengthen the payback period on infrastructure. This would resemble the telecom paradox: the service becomes more useful and more widely consumed while the original capital earns a disappointing return.
4. A Debt, Depreciation and Credit Collision
A sharper downside scenario would combine slowing AI revenue, shortened asset lives and expensive refinancing with existing stress in commercial real estate and parts of the banking system. The FDIC reported that U.S. banks remained profitable in the first quarter of 2026, but unrealized securities losses still stood at $325.1 billion. Commercial-property pressure also remains uneven rather than resolved.
Public finance adds another layer. The Congressional Budget Office projects U.S. net interest outlays above $1 trillion in 2026. Large government borrowing needs do not determine corporate yields by themselves, but they can contribute to continued competition for capital and a higher hurdle rate for long-duration technology investment.
AI depreciation would not cause a banking or property crisis on its own. It could become an amplifier if technology layoffs weaken office demand and consumption while lenders are already cautious and highly leveraged companies need to refinance.
5. The Benign Productivity Absorption
The constructive scenario is that demand, utilization and efficiency improve fast enough to absorb the infrastructure. Older accelerators move from frontier training into inference and less demanding workloads. AI increases output across the economy, revenue scales faster than depreciation, and the major investors fund replacement from operating cash flow.
In this outcome, the depreciation concern remains real but manageable. The decisive variables are utilization, revenue per unit of compute and the ability to cascade older equipment into profitable secondary uses.
What the Market May Discover Next
The headline capital-expenditure number is no longer sufficient. The next stage of AI analysis requires attention to:
- changes in estimated server and network useful lives;
- accelerated depreciation, impairments and early equipment retirements;
- depreciation growth compared with AI-related revenue growth;
- capital expenditure compared with operating cash flow and free cash flow;
- debt, finance leases, power contracts and non-cancellable purchase commitments;
- R&D growth and the amount of new spending required merely to remain competitive;
- data-center and accelerator utilization;
- AI service prices and gross margins; and
- revenue or output per employee as companies use AI to offset its own cost.
The strongest company will not necessarily be the one announcing the largest AI budget. It will be the one able to convert that budget into recurring cash flow before the replacement clock forces the next round of spending.
ATN Bottom Line: A Thinning, Not the End of AI
Rapid AI depreciation could become the straw that breaks weaker business models—but only when combined with poor utilization, slow monetization, continuing R&D, labor costs and financing obligations.
A 2001-style outcome would not mean that artificial intelligence was a false revolution. Telecom infrastructure became indispensable even after many telecom investors and operators suffered severe losses. The same distinction may define the AI cycle: the technology can transform the economy while a large number of companies built around the first investment wave fail to earn an adequate return.
The likely destination is a narrower market composed of well-financed platforms, efficient specialist suppliers and companies that can prove real productivity. The “miners” that arrived only because capital was abundant will gradually disappear. A handful of businesses selling the essential picks, power, memory, cooling, networking and manufacturing tools may emerge as the banner names of the next phase.
The market currently celebrates the size of the AI buildout. Its next discovery may be the size of the replacement bill.
Sources
- Amazon 2025 Annual Report: useful lives, depreciation, technology costs and software-development accounting
- Meta 2025 Annual Report: server and network-asset useful lives and depreciation
- Alphabet 2025 Annual Report: technical-infrastructure depreciation policy
- Alphabet second-quarter 2026 Form 10-Q: R&D and depreciation growth
- Microsoft 2026 Annual Report: AI infrastructure investment and operating costs
- Federal Reserve Bank of Richmond: Boom and Bust in Telecommunications
- OECD Global Debt Report 2026
- FDIC Quarterly Banking Profile: First Quarter 2026
- Congressional Budget Office: The Budget and Economic Outlook, 2026 to 2036
Analysis current as of August 6, 2026. The depreciation calculations are illustrative and will vary according to asset mix, useful life, residual value and company accounting policy. This article provides independent market commentary and educational information, not investment advice.